


-
激光发射二轴转台是“光、机、电”结合的跟踪发射设备。转台应用范围广泛,通过转台与激光的结合,可用作测距设备、边防设备、侦查设备等[1]。激光发射二轴转台是激光传输和激光发射的载体,激光器发出的激光通过二轴转台内部库德光路进行多次反射,最终由激光发射设备发出,从而对目标进行作用[2-3]。随着计算机、自动控制、精密机械、激光光源技术不断发展,激光发射二轴转台的激光发射功率越来越高,作用距离越来越远,故对转台在不同环境温度下的静动态特性、轴系精度有着严格的要求[4]。
激光发射二轴转台使用环境复杂,由于环境温度变化,转台整体不可避免地发生“热胀冷缩”现象。转台结构发生热变形及部件间因热变形产生的过大间隙或过盈必然影响转台整体的使用性能,环境温度变化对转台性能有怎样的影响,以及影响程度如何,需要再对不同温度下转台性能进行分析研究。参考文献[5-6]设计了转台并对转台结构静动态特性进行分析研究,但未考虑不同环境温度对转台静动态特性的影响。参考文献[7-9]分析了多种误差对转台精度的影响,建立了转台系统的误差模型,但对于环境温度因素影响转台轴系精度的研究鲜有报道。
文中引入激光发射二轴转台结构,在温度指标范围−40~55 ℃内,以环境温度为自变量对转台结构进行静动态分析、轴系精度分析,得到环境温度对转台变形量、应力值、轴系垂直度、晃动精度及固有频率的影响。
-
激光发射二轴转台为大型立式“U-O”结构,分为俯仰轴系、方位轴系及底座三大部分,俯仰轴系轴线与底座平行,方位轴系轴线垂直于底座。
俯仰轴系包括四通与左右轴部分,左右轴固定在左右轴承上,轴承主要承受俯仰轴系重力载荷,可承受较小的轴向力;左立柱内安装伺服电机,驱动俯仰轴系绕X轴转动,左电机、左右轴承与左右立柱固定连接,同时左右立柱与台体固定连接。
方位轴系安装在底座上,底座主要承载方位轴系及俯仰轴系重力载荷,利用轴承减小回转摩擦力,通过驱动组件驱动方位轴系绕Z轴转动;激光发射设备与跟踪设备可根据需要固定在四通结构上。二轴转台结构如图1所示。

图 1 二轴转台结构图
Figure 1. Structure diagram of two-axis turntable
转台要达到质量轻且满足复杂环境温度条件,其结构必须有足够的强度、刚度及精度,同时还要兼顾成本问题。铝合金具有比重小、导热性好、易于成型、价格低廉等优点,所以二轴转台的四通、立柱、台体、基座等结构大件为特种铝合金材料。为提高计算效率,电机、轴承复杂结构部件均采用结构钢材料,在不同体积、等质量的原则下简化为实体模型,并定义材料密度,最终得到轻型的转台结构,满足质量要求。
-
二轴转台静态时,并无外界载荷作用,只考虑由于自身重力及环境温度变化而产生的变形与应力。静力学主要是用来分析固定载荷作用下的结构响应,不考虑系统的惯性及阻尼。系统的静力学方程为:
$$\ {\boldsymbol{K}} \left\{ {{{X}}\left( {{t}} \right)} \right\} = \left\{ {{{F}}\left( {{t}} \right)} \right\}$$ (1) 式中:K为转台刚度矩阵;{F(t)}为力;{X(t)}为转台位移。
激光发射二轴转台是在常温22 ℃进行装配与校核,选择22 ℃为参考温度。当结构温度由t0升至t1时,各方向的应变及相应的应力如公式(2)、(3)所示:
$$ \varepsilon =\mathrm{\alpha }({{t}}_{1}-{{t}}_{0}) $$ (2) $$ \sigma =\mathrm{\alpha }{E}({{t}}_{1}-{{t}}_{0}) $$ (3) 式中:
$ \alpha $ 为热膨胀系数,℃−1;E为弹性模量,Pa;t为温度,℃。由公式(2)、(3)可知,当温度变化存在温差时,温差一定,转台产生的热应变与热应力随着材料热膨胀系数的增大而升高;当材料选定后,转台热应变与热应力随着温差增大而升高。对二轴转台建立有限元模型,整个转台被划分为2703772个节点,1692259个单元,网格数量较大,分析结果较为准确。因库德光路组件在实际装配时采用弹性密封圈及垫片与其他结构接触,而分析时均假设为线性材料连接,为保证分析结果的准确性,故不再考虑库德光路组件的应力分析结果。
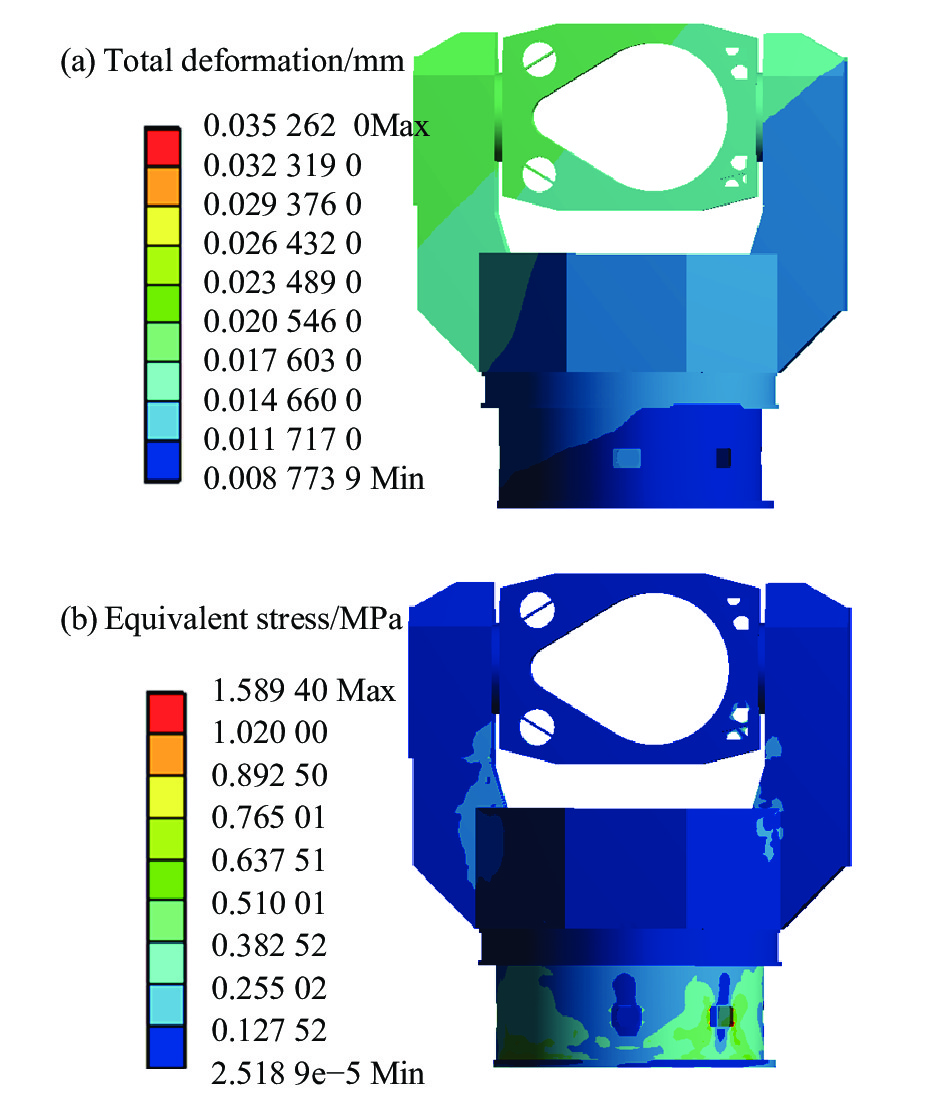
采用热力耦合的方法,添加温度边界22 ℃,转台固定约束在载物台上,添加重力加速度g=9.8066 m/s2,求解模型得到转台变形量云图,如图2(a)所示,最大变形量为35.262
${\text{μ}}$ m;转台应力分布云图如图2(b)所示,最大应力值为1.589 MPa。在温度指标范围内,均匀选取多个温度点,采用与常温22 ℃时相同的约束及载荷条件,添加不同温度边界,得到在不同温度点时,转台最大变形量$ {d}_{max} $ 变化如图3(a)所示,最大应力值$ {\sigma }_{max} $ 变化如图3(b)所示。
图 2 (a) 二轴转台变形量云图;(b) 二轴转台应力分布云图
Figure 2. (a) Deformation cloud diagram of two-axis turntable; (b) Stress distribution cloud diagram of two-axis turntable

图 3 (a)最大变形量随温度变化曲线;(b)最大应力值随温度变化曲线
Figure 3. (a) Curve of maximum deformation with temperature; (b) Curve of maximum stress with temperature
由图3可知,在温度指标范围内,
$ {d}_{max} $ 与$ {\sigma }_{max} $ 随温度变化趋势相同。当温度低于22 ℃时,$ {d}_{max} $ 和$ {\sigma }_{max} $ 随温度的升高而减小,在22 ℃达到最低值;当温度高于22 ℃时,$ {d}_{max} $ 和$ {\sigma }_{max} $ 随温度的升高而增大;以22 ℃为参考温度,温度每变化10 ℃,$ {d}_{max} $ 变化约0.529 mm,$ {\sigma }_{max} $ 变化约18.418 MPa。$ {d}_{max} $ 和$ {\sigma }_{max} $ 在−40 ℃时达到最大值,此时$ {d}_{max}= $ 3.315 mm,$ {\sigma }_{max}= $ 115.78 MPa。由有限元分析结果得到,最大应力值出现在基座上,基座为特种铝合金材料,其强度极限$ {\sigma }_{b}= $ 255 MPa,取安全系数为2,$ {\sigma }_{max} $ <$ {\sigma }_{b}/2= $ 127.5 MPa。结果表明,在温度指标范围内转台满足结构强度要求。 -
转台的轴系垂直度与晃动精度是其重要的精度指标,影响轴系垂直度与晃动精度的原因主要包括加工、装配误差、配合种类、轴承轴向径向窜动等。由于加工、装配误差不可避免,只能尽量减小,在有限元模型中,轴承被简化为实体模型且固定约束,并使轴与孔间理想配合。故只考虑二轴转台因温度变化产生了变形,其改变了轴系与支撑面的间隙,从而对转台轴系精度造成影响,最终归结为环境温度对轴系精度的影响。
-
二轴转台轴系垂直度误差包括方位轴系与俯仰轴系的垂直度误差
$ {\tau }_{1} $ ,方位轴系与底座支撑面的垂直度误差$ {\tau }_{2} $ 。空间两条直线方向向量夹角与90°的差值即是垂直度误差$ \tau $ :$$ \tau =\left(90°-\mathrm{a}\mathrm{r}\mathrm{c}\mathrm{c}\mathrm{o}\mathrm{s}\frac{\left|{\boldsymbol{\vartheta }_{1}}\bullet {\boldsymbol{\vartheta }_{2}}\right|}{\left|{\boldsymbol{\vartheta }_{1}}\right|\left|{\boldsymbol{\vartheta }_{2}}\right|}\right)\times 3\;600 $$ (4) 式中:
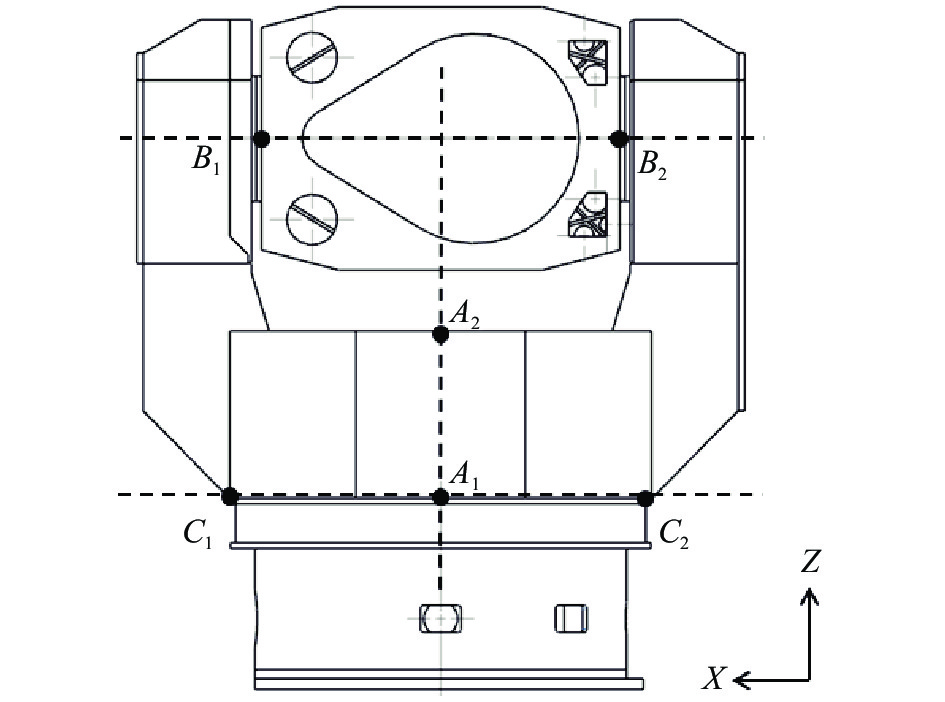
${\boldsymbol{\vartheta }_{1}}$ ,${\boldsymbol{\vartheta }_{2}}$ 为两条空间直线的方向向量。分别选取在转台方位轴系过轴线空间上的两点A1,A2;俯仰轴系过轴线空间上的两点B1,B2;底座支撑面X方向空间上的两点C1,C2。取点位置如图4所示,共得到3条空间直线的方向向量${\boldsymbol{\vartheta }_{a}}=\overrightarrow{{A}_{1}{A}_{2}}$ ,${\boldsymbol{\vartheta }_{b}}=\overrightarrow{{B}_{1}{B}_{2}}$ ,${\boldsymbol{\vartheta }_{c}}=\overrightarrow{{C}_{1}{C}_{2}}$ 。
图 4 空间向量取点位置
Figure 4. Taking the position of the space vector
在22 ℃情况下,由2节静力学分析中的各点变形量数据得到
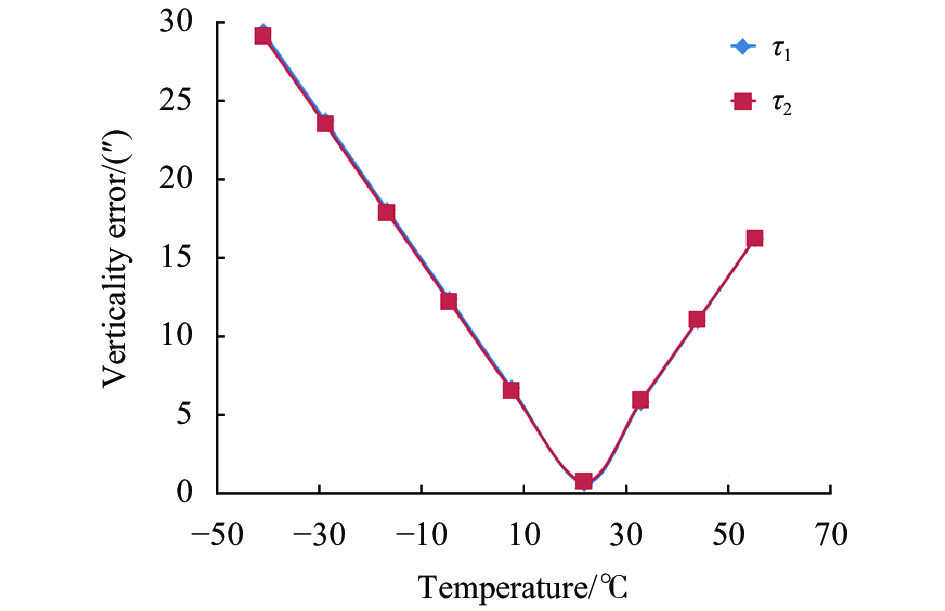
${\boldsymbol{\vartheta }_{a}}=$ (2.107×10⁻³, 3.134×10⁻⁶, 481.887),${\boldsymbol{\vartheta }_{b}}=$ (−1056.26, −6.063×10⁻⁵, 3.21×10⁻³),${\boldsymbol{\vartheta }_{c}}=$ (−1102.244,−2.147×10⁻⁵, 2.712×10⁻³),单位为mm。将${\boldsymbol{\vartheta }_{a}}$ ,${\boldsymbol{\vartheta }_{b}}$ 代入公式(4)中,计算得到$ {\tau }_{1}= $ 0.275″,将${\boldsymbol{\vartheta }_{a}}$ ,${\boldsymbol{\vartheta }_{c}}$ 代入公式(4)中,计算得到$ {\tau }_{2}= $ 0.394″。在温度指标范围内,均匀选取多个温度点,采用相同的方法求解不同温度点的垂直度误差,绘制垂直度误差$ {\tau }_{1} $ ,$ {\tau }_{2} $ 随温度变化曲线如图5所示。
图 5 轴系垂直度误差随温度变化曲线
Figure 5. Curve of shafting verticality error with temperature
由图5可知,在温度指标范围内,
$ {\tau }_{1} $ ,$ {\tau }_{2} $ 对温度变化敏感,其随温度变化趋势相同,且数值相差不大。当温度低于22 ℃时,$ {\tau }_{1} $ 、$ {\tau }_{2} $ 随温度升高而减小,在22 ℃达到最低值;当温度高于22 ℃时,$ {\tau }_{1} $ 、$ {\tau }_{2} $ 随着温度升高而增大;以22 ℃为参考温度,温度每变化10 ℃,$ {\tau }_{1} $ 变化约4.715″,$ {\tau }_{2} $ 变化约4.649″。当温度为−40 ℃时,$ {\tau }_{1} $ 为最大值29.505″,$ {\tau }_{2} $ 为最大值29.221″,均在转台误差允许范围内。 -
方位轴系的晃动精度取决于台体底部接触面的Z向位移。工程中常采用在同一高度下,转台方位轴系外圆周面,每隔30°取一点,共计12个样本点,利用电子水平仪测量样本点的Z向跳动量,通过公式(5)、(6)计算得到方位轴系晃动误差
$\; \beta $ :$$\begin{array}{l} {\beta _i} = \left( {{x_i} - \bar x} \right) - \dfrac{{\left[ { \displaystyle\mathop \sum \nolimits_{i = 1}^{12} \left( {{x_i} - \bar x} \right)\cos \left( {{\rho _i}} \right)} \right]{\rm{cos}}\left( {{\rho _i}} \right)}}{6} - \\ \dfrac{{\left[ {\displaystyle\mathop \sum \nolimits_{i = 1}^{12} \left( {{x_i} - \bar x} \right)\sin \left( {{\rho _i}} \right)} \right]{\rm{sin}}\left( {{\rho _i}} \right)}}{6}\;\left( {{{i}} = 1,2,3, \cdots ,12} \right) \end{array}$$ (5) $$\beta = {\rm{max}}({\beta _m}) - {\rm{min}}({\beta _n})\;\left( {{{m}},{{n}} = 1,2,3, \cdots ,12} \right)$$ (6) 式中:
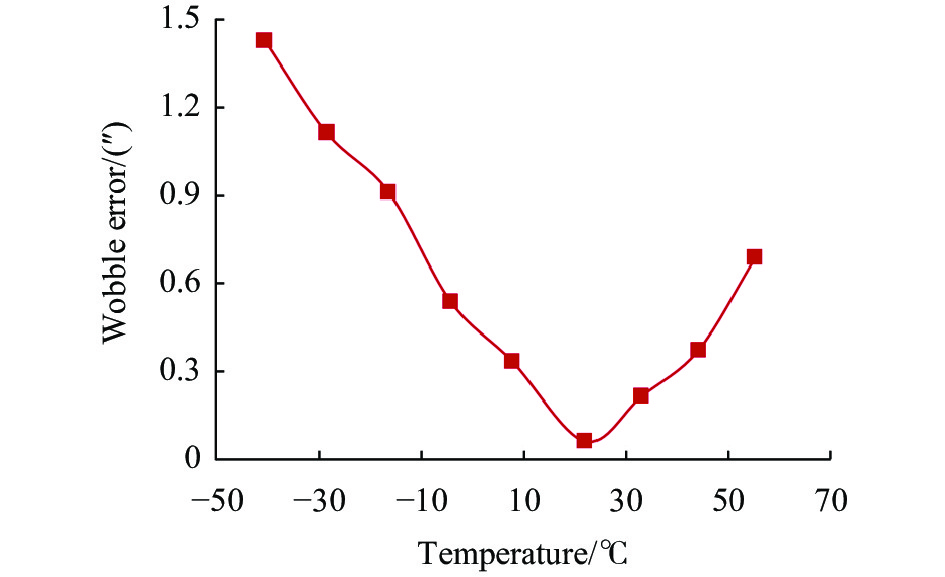
$ {x}_{i} $ 为样本点Z向位移偏转角度,";$ {\rho }_{i} $ 为样本点取点位置,rad。在22 ℃情况下,由第2节的静力学分析所得变形量数据,采用与工程测量相同的原理,在方位轴系底部直径为551 mm的圆周面取12个样本点,并提取各样本点的Z向变形量数据,如表1所示。代入公式(5)、(6),计算得到
$ \;\beta = $ 0.056″。在温度指标范围内,均匀选取多个温度点,采用相同的方法求解不同温度点的$ \; \beta $ 值,绘制方位轴系晃动误差$ \;\beta $ 随温度变化曲线如图6所示。表 1 22 ℃方位轴系样本点Z向变形量数据
Table 1. Z-direction deformation data of sample points of shaft system with 22 ℃
Sample data Sample point location/rad 0 $ \dfrac{\pi }{6} $ $ \dfrac{\pi }{3} $ $ \dfrac{\pi }{2} $ $ \dfrac{2\pi }{3} $ $ \dfrac{5\pi }{6} $ $ \mathrm{\pi } $ $ \dfrac{7\pi }{6} $ $ \dfrac{4\pi }{3} $ $ \dfrac{3\pi }{2} $ $ \dfrac{5\pi }{3} $ $ \dfrac{11\pi }{6} $ Z-direction deformation/(″) 7.804 7.563 7.409 7.36 7.406 7.564 7.801 8.061 8.269 8.357 8.272 8.065 
图 6 方位轴系晃动误差随温度变化曲线
Figure 6. Curve of azimuth axis wobble error with temperature
由图6可知,在温度指标范围内,
$ \;\beta $ 对温度变化较敏感。当温度低于22 ℃时,$ \;\beta $ 随温度的升高而减小,在22 ℃达到最低值;当温度高于22 ℃时,$ \;\beta $ 随着温度的升高而增大;以22 ℃为参考温度,环境温度每变化10 ℃,$ \;\beta $ 变化约0.22″。当温度为−40 ℃,$ \;\beta $ 为最大值1.421″,在转台误差允许范围内。 -
俯仰轴系晃动精度取决于左右轴的最大径向跳动量与跨距。在轴与轴承产生间隙后,左右轴实际轴线与理论轴线之间的最大夹角便是俯仰轴系晃动误差[10],计算公式如下:
$$ \gamma =\mathrm{a}\mathrm{r}\mathrm{c}\mathrm{t}\mathrm{a}\mathrm{n}\left[\right({D}+{d})/{L}] $$ (7) 式中:D,d为轴系两端最大径向跳动量,mm;L为轴系跨距,1400 mm;
$ \gamma $ 为晃动误差,"。D,d的取值等于不同温度下轴与轴承由于变形产生的最大间隙,且取相反方向的间隙值,即若D取左轴与左轴承Z方向上端接触面间隙值,则d取右轴与右轴承Z方向下端接触面间隙值。在22 ℃情况下,由第2节静力学分析变形量数据发现,俯仰轴系两端最大间隙值之和在Z轴方向,且取值在“左上右下”位置,最终得到两端最大间隙值之和为0.355
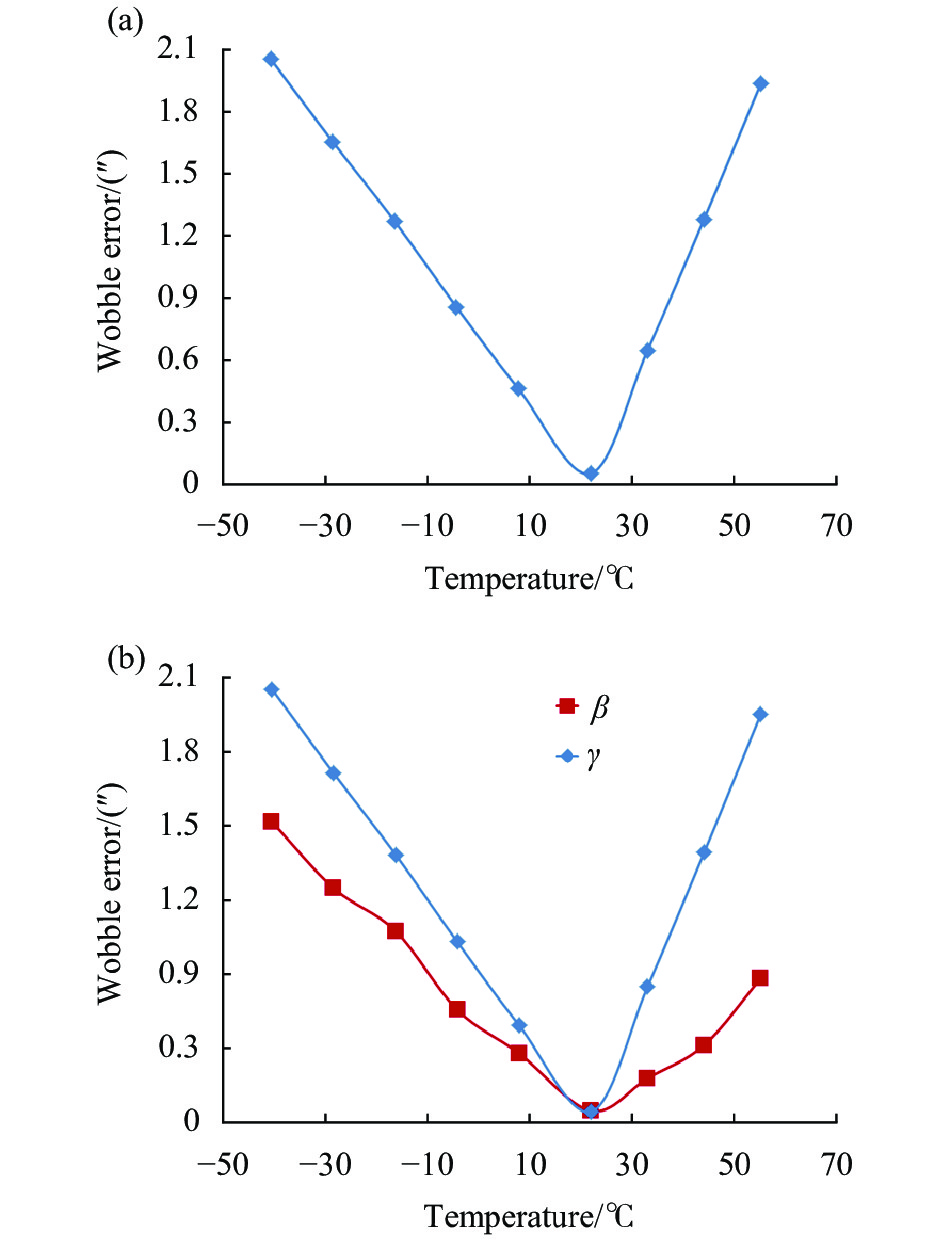
$ {\text{μ}} $ m,代入公式(7)中,计算得到$ \gamma = $ 0.052″。在温度指标范围内,均匀选取多个温度点,采用相同的方法求解不同温度点的$ \gamma $ 值,绘制俯仰轴系晃动误差随温度变化曲线如图7(a)所示,方位轴系与俯仰轴系晃动误差对比曲线如图7(b)所示。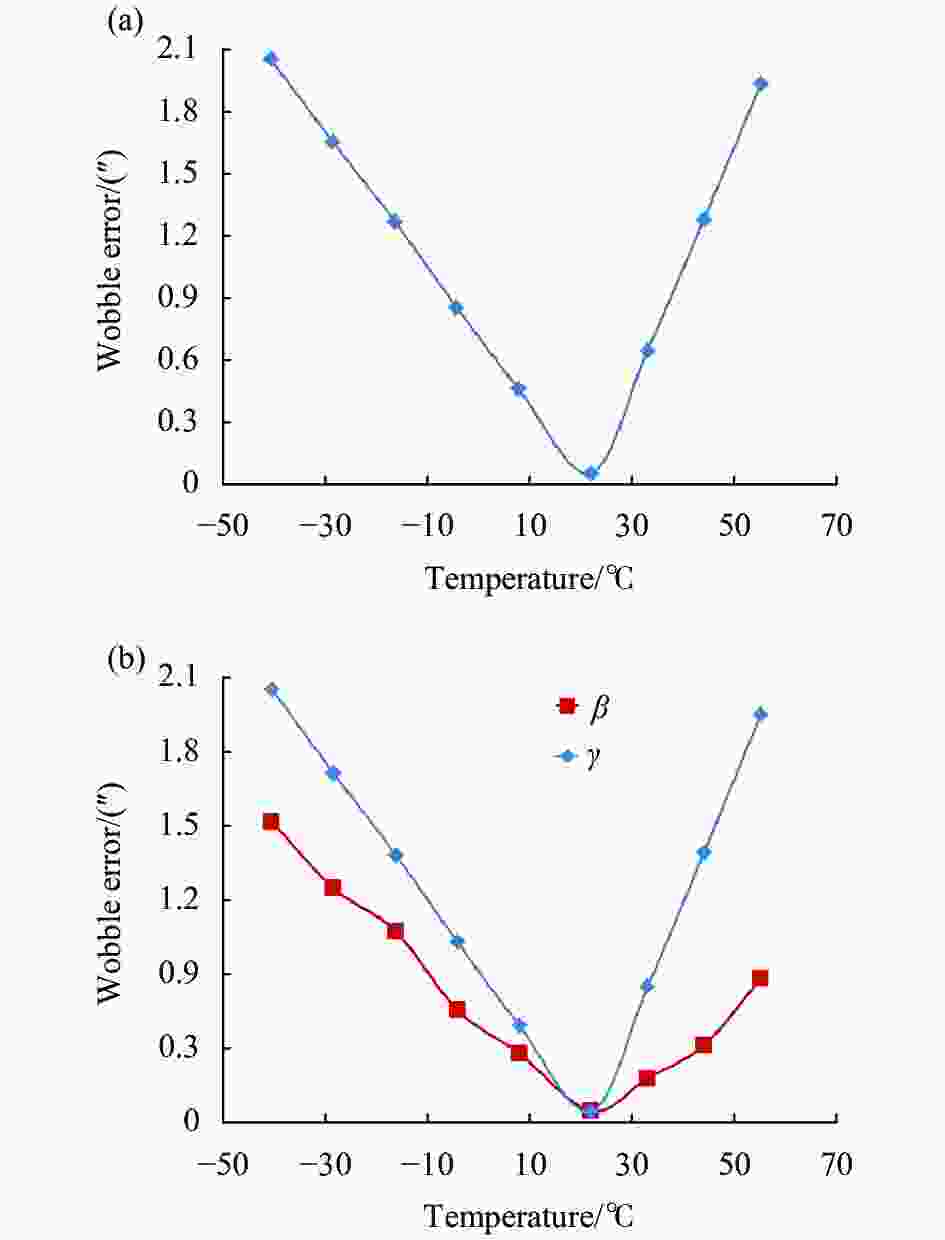
图 7 (a) 俯仰轴系晃动误差随温度变化曲线;(b) 方位轴系与俯仰轴系晃动误差对比曲线
Figure 7. (a) Curve of pitch axis wobble error with temperature; (b) Comparison curve of wobble error between azimuth axis and pitch axis
由图7(a)可知,在温度指标范围内,
$ \gamma $ 对温度变化较敏感。当温度低于22 ℃时,$ \gamma $ 随温度的升高而减小,温度每变化10 ℃,$ \gamma $ 变化约0.33″,在22 ℃达到最低值;当温度高于22 ℃时,$ \gamma $ 随温度的升高而增大,温度每变化10 ℃,$ \gamma $ 变化约0.569″。当温度为−40 ℃,$ \gamma $ 为最大值2.048″,在转台误差允许范围内。由图7(b)可知,在温度指标范围内,
$ \;\beta 、\gamma $ 随温度变化趋势相同,但$ \gamma $ 对温度变化更为敏感。在22 ℃附近时,$ \;\beta $ 、$ \gamma $ 相近,两者对转台轴系精度影响程度相差不大;在其他温度点时,$ \gamma $ 值总是大于$ \;\beta $ 值,且随温度偏离22 ℃越远,晃动误差差值越大。说明在温度偏离22 ℃时,$ \gamma $ 比$ \;\beta $ 更能影响转台轴系精度,且偏离越远,影响程度差距越大,当偏离程度一定时,结构由受热变形产生的晃动误差差值明显大于受冷变形产生的晃动误差差值。 -
模态分析是研究结构动力学特性的一种方法,因转台内部电机工作时会产生一定频率的振动,故通过二轴转台的模态分析,可以很好预测结构的固有频率,避免发生共振。转台主体采用的是特种铝合金材料,其弹性模量在温度指标范围内变化极小,假定弹性模量始终为定值,研究环境温度变化造成转台结构改变对模态频率的影响。
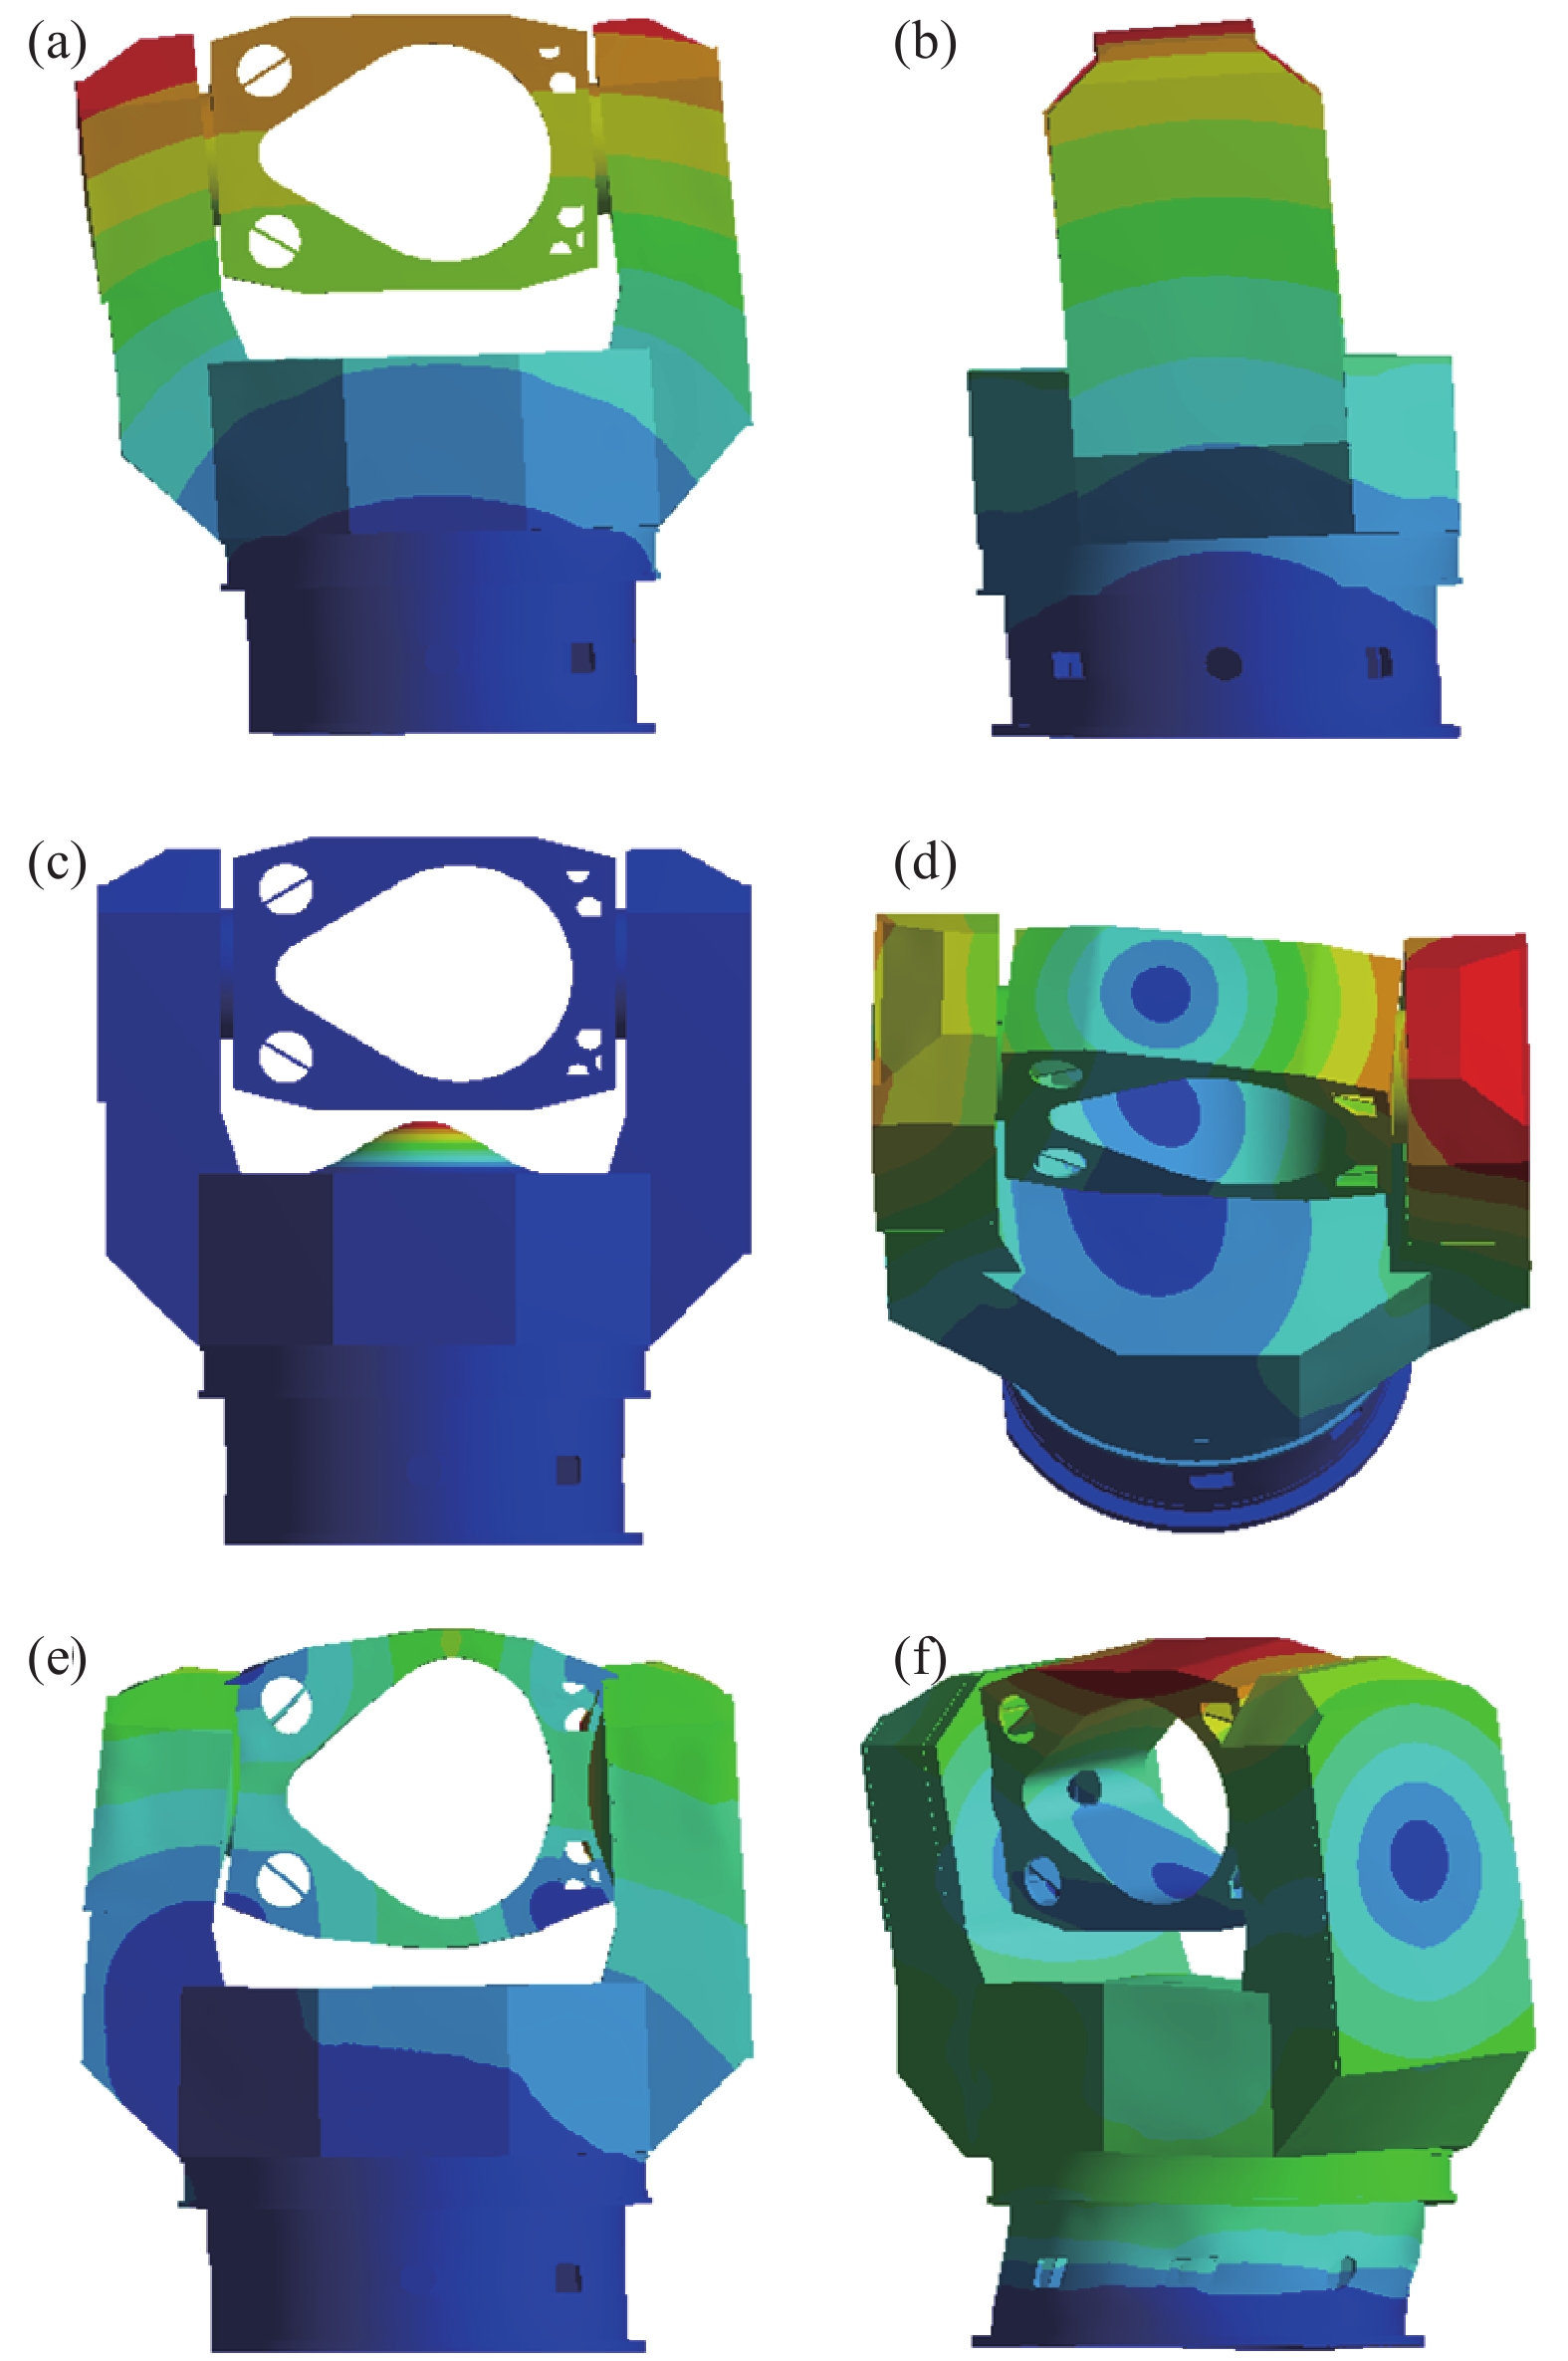
在22 ℃温度下,对转台进行模态分析,测得转台前6阶的振型与模态频率如图8所示,其中转台基频为77.531 Hz。在温度指标范围内,均匀选取多个温度点,采用相同的方法求解不同温度点的转台前6阶模态。求解得到各温度点下,转台振型与22 ℃振型特点相同,频率变化率随温度变化曲线如图9所示,其中频率变化率
$ \lambda $ 的计算公式如下:
图 8 (a) 1阶振型,沿X轴移动,频率为77.531 Hz;(b) 2阶振型,沿Y轴移动,频率为89.633 Hz;(c) 3阶振型,沿Z轴移动,频率为132.29 Hz;(d) 4阶振型,绕Z轴转动,频率为144.25 Hz;(e) 5阶振型,绕Y轴转动,频率为218.69 Hz;(f) 6阶振型,绕X轴转动,频率为237.92 Hz
Figure 8. (a) The first-order mode, moving along the X-axis, the frequency is 77.531 Hz; (b) The second-order mode, moving along the Y-axis, the frequency is 89.633 Hz; (c) The third-order mode, moving along the Z-axis, the frequency is 132.29 Hz; (d) The fourth-order mode, rotating around the Z-axis, the frequency is 144.25 Hz; (e) The fifth-order mode, rotating around the Y-axis, the frequency is 218.69 Hz; (f) The sixth-order mode, rotating around the X-axis, the frequency is 237.92 Hz

图 9 频率变化率随温度变化曲线
Figure 9. Curve of frequency change rate with temperature
$$ \lambda =\frac{{f}_{t}-{f}_{22}}{{f}_{22}}\times 100 {\text{%}} $$ (8) 式中:
$ {f}_{t} $ 为温度t时的转台模态频率;$ {f}_{22} $ 为温度22 ℃时的转台模态频率[11]。由图9可知,在温度指标范围内,第3阶模态频率变化率随温度变化幅度最大,频率变化率在−1.2%~0.7%之间,其他模态的频率变化率相近,在−0.05%~0.03%之间;第2阶模态频率随温度升高而降低,其他模态频率随温度升高而升高。
二轴转台工作时,只有内部电机会产生约20 Hz的外界激励,因此,需要将转台模态频率与电机频率做比较。由模态分析数据可知,当环境温度为−40 ℃,转台基频为最小值77.523 Hz,与电机频率相差很大,所以转台结构动态性能良好,并不会有发生共振的可能。
-
文中引入一种具有温度指标要求的激光发射二轴转台结构,通过对不同温度下转台性能的分析研究,得到结论如下:
(1) 环境温度对二轴转台静态特性及轴系精度有较大的影响。转台静态特性中的最大变形量、最大应力值,轴系精度特性中的轴系垂直度、晃动精度都表现出对温度变化敏感,且随温度变化趋势相同。随着环境温度与常温22 ℃温差越大,转台静态特性及轴系精度越差,因此转台在高低温环境使用时,应加强对转台结构的维护及瞄准精度的校准,保证设备仍具有良好的使用性能。
(2) 二轴转台静态特性及轴系精度变差主要是由于环境温度改变引起的变形所导致。通过选择具有较小热膨胀系数的材料,缩小装配部件间的热膨胀系数差值可有效改善环境温度对转台静态特性及轴系精度的影响。其次,尽量减小加工、装配误差,采用高精度轴承并进行轴向预紧,轴系与轴承间采用过盈配合,合理添加倒角,设计加强筋等措施也有一定的改善作用。
(3) 在文中的转台结构形式及约束条件下,二轴转台模态频率对温度变化不敏感,虽前6阶模态频率随温度变化呈一定规律,但在温度指标范围内,模态频率变化幅度不超过2%。由于转台结构形式及约束方式不同,其振型、模态频率及其随温度变化规律也会改变,需要根据实际结构进行具体分析。
Research on the influence of ambient temperature on the performance of laser launching two-axis turntable
-
摘要: 激光发射二轴转台是以转台为主体,承载激光传输及发射功能的设备。转台要求在温度指标范围−40~55 ℃内具有良好的使用性能,为更好地了解环境温度对转台性能的影响,引出了激光发射二轴转台结构,并采用有限单元法对不同环境温度下转台静动态特性进行分析研究,由静力学分析后的转台变形量结果得到环境温度对轴系精度的影响。分析得到,以22 ℃转台性能参数为基准,在温度指标范围内,室温22 ℃时,转台静态特性与轴系精度最优,环境温度偏离22 ℃越远,静态特性与轴系精度越差。当温度每变化10 ℃,转台最大变形量变化约0.529 mm,最大应力值变化约18.418 MPa;方位轴系与俯仰轴系垂直度误差变化约4.715″,方位轴系与底座支撑面垂直度误差变化约4.649″;方位轴系晃动误差变化约0.22″,俯仰轴系晃动误差:(1)温度低于22 ℃,变化约0.33″;(2)温度高于22 ℃,变化约0.569″。转台前6阶模态频率随温度变化具有不同的规律,但频率变化率最大不超过2%。分析结果表明,环境温度对此类转台静态特性与轴系精度影响较大,但对动态特性影响较小,结论与工程经验基本吻合。Abstract: The laser emission two-axis turntable is a device that takes the turntable as the main body, carrying the laser transmission and emission functions. The turntable is required to have good performance in the temperature range of −40-55 ℃. To better understand the impact of ambient temperature on the performance of the turntable, the structure of the laser emitting two-axis turntable was introduced, and the finite element method was used to analyze and study the static and dynamic characteristics of the turntable under different ambient temperatures. The effect of the ambient temperature on the accuracy of the shafting was obtained from the result of the deformation of the turntable after the static analysis. According to the analysis, under the condition of 22 ℃ turntable performance parameters as the benchmark, within the temperature index range, at room temperature 22 ℃, the static characteristics of the turntable and the shafting accuracy were the best. The farther the ambient temperature deviated from 22 ℃, the worse the static characteristics and shafting accuracy. When the temperature changed by 10 ℃, the maximum deformation of the turntable changed by about 0.529 mm, and the maximum stress value changed by about 18.418 MPa; the verticality error between the azimuth axis and the pitch axis changed by about 4.715″, and the verticality error between the azimuth axis and the base support surface changed about 4.649″; Azimuth shaft system wobble error changed about 0.22″, pitch shaft system wobble error: (1) The temperature was below 22 ℃, the change was about 0.33″; (2) The temperature was above 22 ℃, the change was about 0.569″. When changing with temperature, the first 6 modal frequencies of the turntable had different laws, but the frequency change rate did not exceed 2%. The analysis results show that the ambient temperature has a greater impact on the static characteristics and shafting accuracy of this type of turntable, but has a small impact on the dynamic characteristics. The conclusion is consistent with engineering experience.
-
图 2 (a) 二轴转台变形量云图;(b) 二轴转台应力分布云图
Figure 2. (a) Deformation cloud diagram of two-axis turntable; (b) Stress distribution cloud diagram of two-axis turntable
图 3 (a)最大变形量随温度变化曲线;(b)最大应力值随温度变化曲线
Figure 3. (a) Curve of maximum deformation with temperature; (b) Curve of maximum stress with temperature
图 7 (a) 俯仰轴系晃动误差随温度变化曲线;(b) 方位轴系与俯仰轴系晃动误差对比曲线
Figure 7. (a) Curve of pitch axis wobble error with temperature; (b) Comparison curve of wobble error between azimuth axis and pitch axis
图 8 (a) 1阶振型,沿X轴移动,频率为77.531 Hz;(b) 2阶振型,沿Y轴移动,频率为89.633 Hz;(c) 3阶振型,沿Z轴移动,频率为132.29 Hz;(d) 4阶振型,绕Z轴转动,频率为144.25 Hz;(e) 5阶振型,绕Y轴转动,频率为218.69 Hz;(f) 6阶振型,绕X轴转动,频率为237.92 Hz
Figure 8. (a) The first-order mode, moving along the X-axis, the frequency is 77.531 Hz; (b) The second-order mode, moving along the Y-axis, the frequency is 89.633 Hz; (c) The third-order mode, moving along the Z-axis, the frequency is 132.29 Hz; (d) The fourth-order mode, rotating around the Z-axis, the frequency is 144.25 Hz; (e) The fifth-order mode, rotating around the Y-axis, the frequency is 218.69 Hz; (f) The sixth-order mode, rotating around the X-axis, the frequency is 237.92 Hz
表 1 22 ℃方位轴系样本点Z向变形量数据
Table 1. Z-direction deformation data of sample points of shaft system with 22 ℃
Sample data Sample point location/rad 0 $ \dfrac{\pi }{6} $ $ \dfrac{\pi }{3} $ $ \dfrac{\pi }{2} $ $ \dfrac{2\pi }{3} $ $ \dfrac{5\pi }{6} $ $ \mathrm{\pi } $ $ \dfrac{7\pi }{6} $ $ \dfrac{4\pi }{3} $ $ \dfrac{3\pi }{2} $ $ \dfrac{5\pi }{3} $ $ \dfrac{11\pi }{6} $ Z-direction deformation/(″) 7.804 7.563 7.409 7.36 7.406 7.564 7.801 8.061 8.269 8.357 8.272 8.065  下载: 导出CSV
-
[1] Gao Guohua, Wang Jin. Structural design and modal analysis of a servo tracking turntable [J]. Mechanical Design, 2018(S1): 151-154. (in Chinese) [2] Luo Wei, Dong Wenfeng, Huo Liangyu. Design of small laser directional transmitter based on Kuder optical path [J]. Laser & Infrared, 2017, 47(6): 655-658. (in Chinese) [3] Wang Guang, Gao Yunguo, Ma Yakun, et al. Laser and theodolite high precision docking technology [J]. Infrared and Laser Engineering, 2018, 47(7): 0706006. (in Chinese) doi: 10.3788/IRLA201847.0706006 [4] Li Yiyong, Wang Jianhua, Li Zhi. Development trend of high-energy laser weapons [J]. Journal of Ordnance Equipment Engineering, 2017(6): 1-6. (in Chinese) [5] Li Deng, Li Mengwei, Zhang Peng. Structural design of wide-band multifunctional small three-axis turntable [J]. Journal of North University of China(Natural Science Edition), 2020, 41(3): 214-219, 237. (in Chinese) [6] 邓庆东. 飞行仿真三轴转台的静动力学分析[D]. 长春: 吉林大学, 2015. Deng Qingdong. Static and dynamic analysis of flight simulation three-axis turntable[D]. Changchun: Jilin University, 2015. (in Chinese) [7] Li Huipeng, Cao Yayun, Gao Shuang, et al. Error analysis and modeling of test triaxial turntable [J]. Navigation and Control, 2016, 15(2): 89-93, 68. (in Chinese) [8] Li Yan, Fan Dapeng. Modeling and analysis of three-axis turntable assembly error based on kinematics theory of multi-body system [J]. Chinese Journal of Orography, 2007, 28(8): 981-987. (in Chinese) [9] Kang Yueran, Xiao Benlong, Fu Yiyuan, et al. Modeling and analysis of pointing error under attitude change of three-axis turntable system [J]. Manufacturing Automation, 2018, 40(12): 135-139. (in Chinese) [10] Hu Jianfei, Liu Hongxu, Wen Qingrong, et al. High precision single axis turntable structure design and simulation analysis [J]. Laser & Infrared, 2020, 50(6): 718-723. (in Chinese) [11] Liu Zhe, Ding Yang, Zong Liang. Research on the influence of ambient temperature on modal frequency of circular arch steel structure [J]. Journal of Tianjin University (Natural Science and Engineering Technology Edition), 2019, 52(2): 183-190. (in Chinese) -

 点击查看大图

计量
- 文章访问数: 289
- HTML全文浏览量: 89
- PDF下载量: 24
- 被引次数: 0


