


 下载:
下载:

-
利伐沙班(Rivaroxaban,C19H18ClN3O5S)是一种新型口服抗凝药[1]。它具有疗效确切、安全性好、使用方便的优点,是国内外权威指南强力推荐的静脉血栓栓塞性疾病的用药[2-3]。但患者存在生理差异性,这会导致相同的给药剂量方案在不同患者体内产生的药物浓度不同,特别是在作用部位即受体反应部位的药物浓度可能有明显的差异[4-5]。而利伐沙班在患者体内的浓度,会影响其对凝血因子Xa的抑制作用,导致患者的临床反应有个体差异[6-7],影响治疗效果。因此,临床上医生需要检测利伐沙班浓度来了解利伐沙班在血栓患者中的代谢特征,从而计算出患者治疗所用的最佳剂量[8]。
远红外波段覆盖了大多数有机分子振动、转动运动的特征吸收频率[9]。因此,通过远红外指纹谱可对物质有效识别并定量分析。目前,远红外(far-IR)光谱作为一种分析表征方法,已应用于多种生物分子的识别和分析[10-13],并表现出快速、成本低、精准(样本无损,分子识别)的优点。拉曼效应来源于分子和点阵的振动、转动,从拉曼光谱中可以得到分子(或点阵)振动和转动的信息[14],在有机化学方面常用作结构鉴定和分子相互作用分析[15-16],与红外光谱互为补充,鉴别特殊的结构特征或特征基团。文中先通过傅里叶变换红外光谱仪检测利伐沙班的远红外吸收谱随其浓度发生的变化,再通过激光共聚焦拉曼光谱系统检测了利伐沙班的拉曼光谱随其浓度发生的变化,最后比较了远红外光谱法与拉曼法的准确率。该研究为以后快速检测人血/尿液中利伐沙班浓度提供了参考,临床医学具有实际意义。
-
利伐沙班纯品(≥99%,CAS:366789-02-8,Molecular Weight:435.88)和高密度聚乙烯(颗粒直径:40~48 µm,CAS:9002-88-4)均购自上海阿拉丁生化科技股份有限公司。
-
首先确定目标浓度范围。因为高密度聚乙烯在远红外波段透明[17],文中将利伐沙班与150 mg高密度聚乙烯混合、研磨并通过液压机压制成直径为13 mm、表面光滑的压片。这些压片中的利伐沙班浓度不同,用以模拟不同浓度的利伐沙班样本,具体的利伐沙班浓度(C, mol/L)计算公式如下:
$$ {{C}}=w/MV $$ (1) $$ {{V}}={\rm{\pi }}{{r}}^{2}{{d}} $$ (2) 式中:w和M分别是利伐沙班的质量和分子量(435.88);d和r分别是利伐沙班/聚乙烯混合压片的厚度和半径(13 mm)。所有片剂均控制在150 mg,质量损失控制在1%以下。根据公式(1)和(2)换算得利伐沙班浓度分别为0 mmol/L,43 mmol/L,86 mmol/L,129 mmol/L,172 mmol/L,215 mmol/L和430 mmol/L。测试时,纯PE压片用作参考,其测试光谱作为其余样品测试的参考光谱。
-
实验中采用传统的傅里叶变换红外光谱仪来检测利伐沙班样品。所用设备FTIR光谱仪购自布鲁克公司,型号为VERTEX 80v,信噪比优于55000∶1,检测中设置扫描分辨率为4 cm−1,扫描次数为64次,样品仓在室温(~22 ℃) 下,真空环境中,以减少水蒸气对实验的影响。
Raman光谱检测:将利伐沙班溶解在二甲基亚砜(DMSO)中,配制成不同浓度的利伐沙班溶液。取液体样品2 mL装入比色皿进行宏观大尺寸液体样品的拉曼检测。所用设备为自制拉曼光谱仪,激发波长532 nm,激光功率为500 mW,光栅为600 gr/mm。
-
文中采用傅里叶变换红外光谱仪对制备的利伐沙班压片进行了检测。得到浓度为430 mmol/L利伐沙班的远红外吸收谱,如图1所示。由图1可知,430 mmol/L利伐沙班36.6 cm−1、49.3 cm−1、80.6 cm−1、和96.2 cm−1处有明显的特征吸收峰,在73.3 cm−1附近存在一个不明显的肩峰。
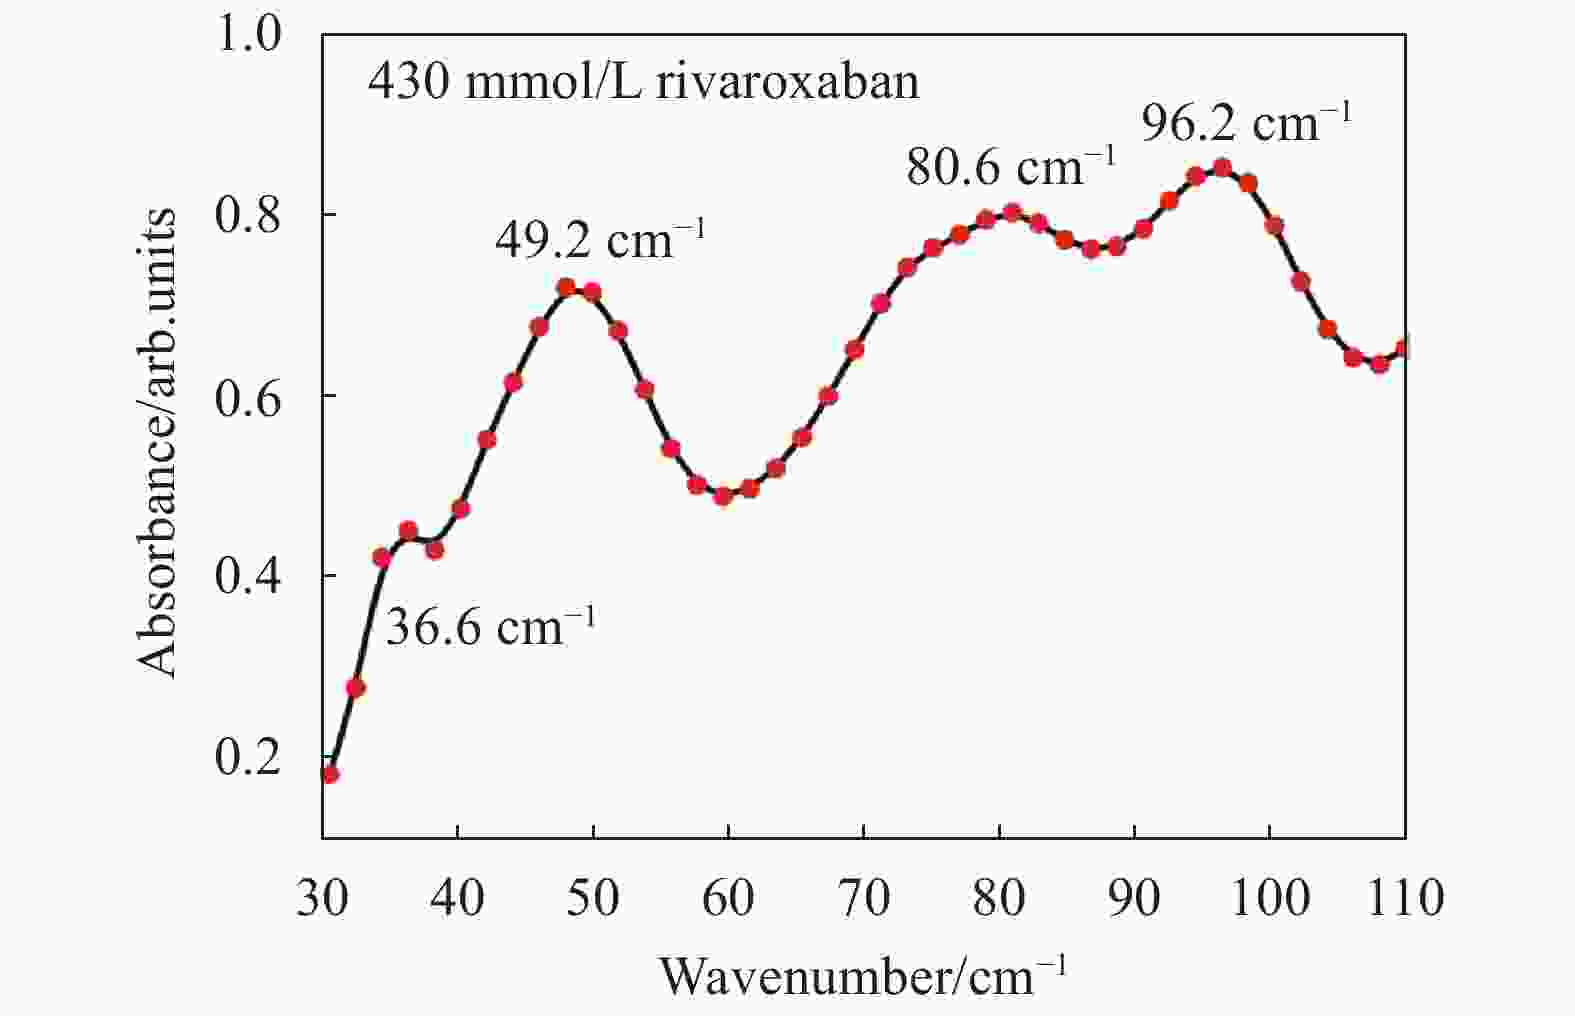
图 1 430 mmol/L利伐沙班的远红外谱图表征
Figure 1. Far-IR characteristic absorption spectrum of 430 mmol/L rivaroxaban detected by far-IR spectroscopy
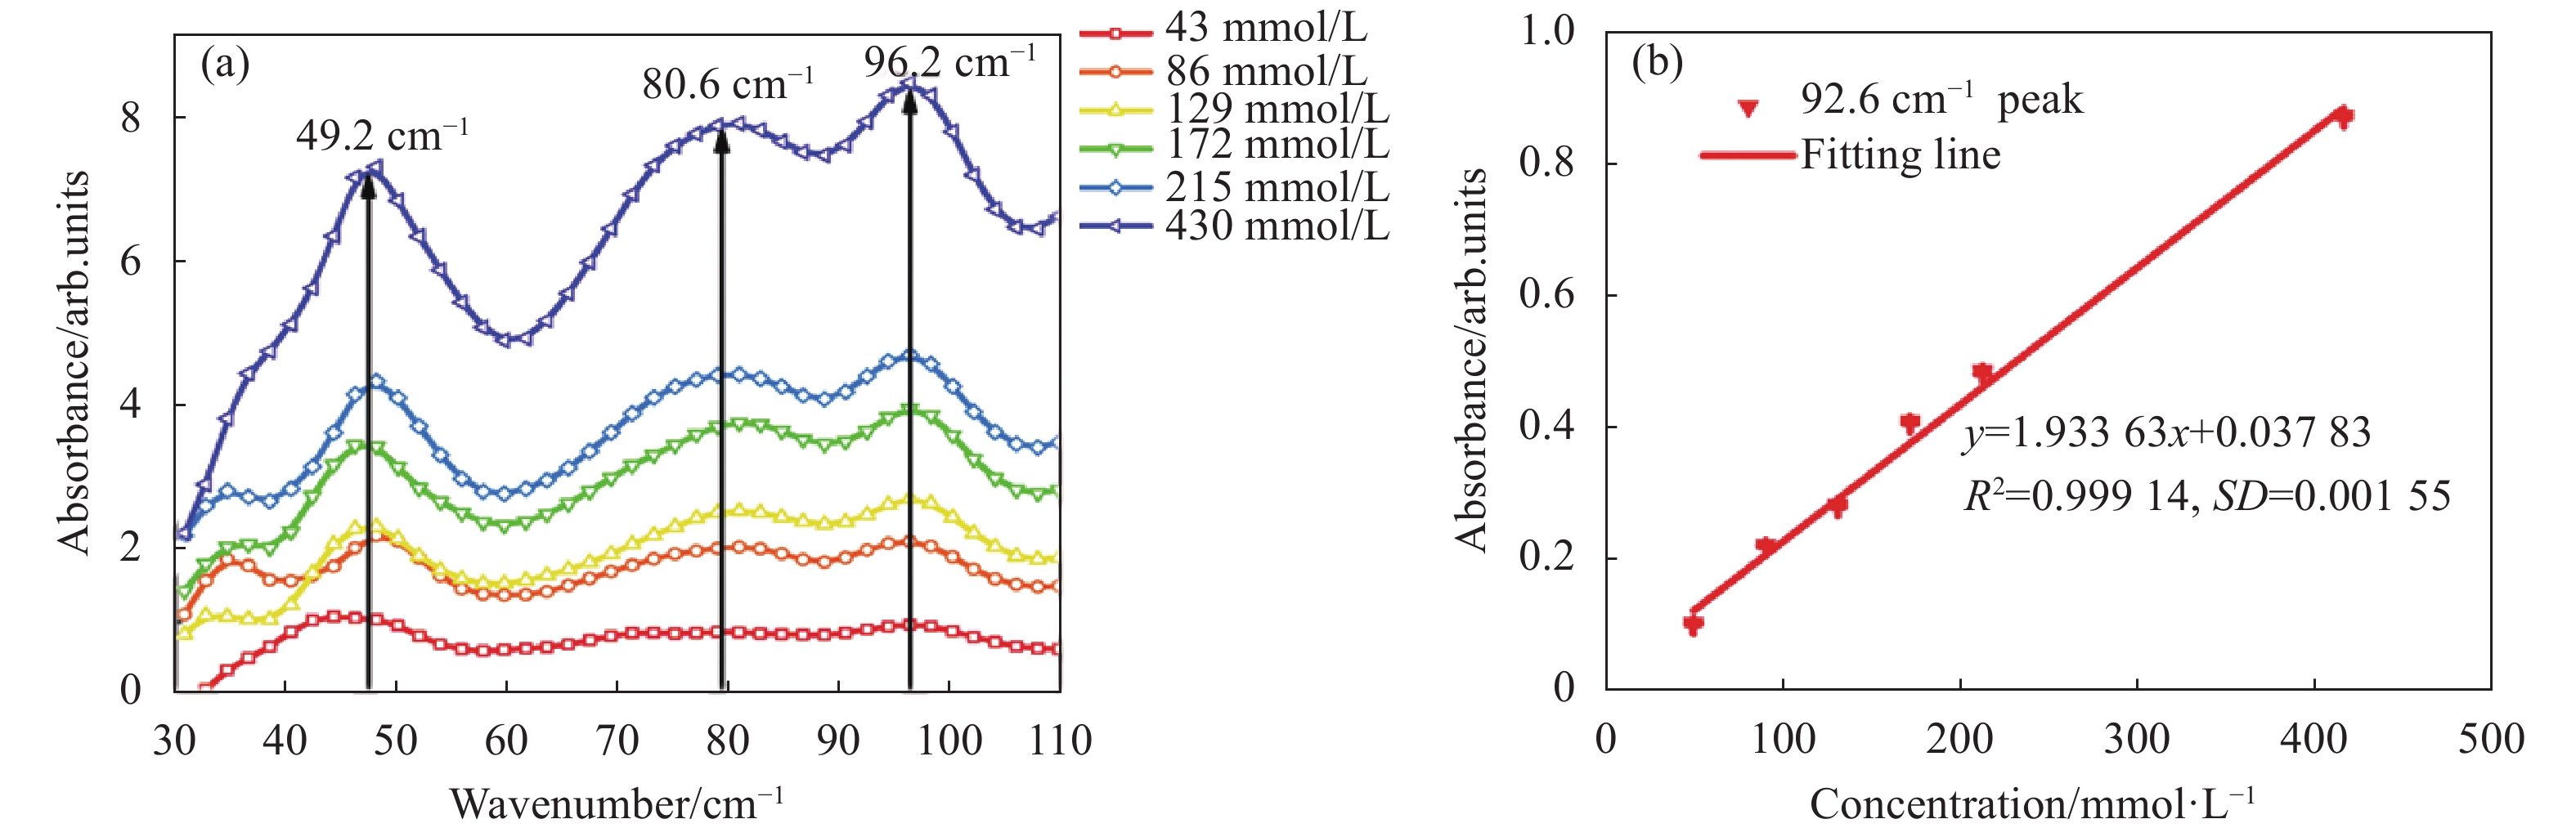
在明确利伐沙班的远红外特征吸收峰后,接着采用傅里叶变换红外光谱仪检测了不同浓度同利伐沙班压片的远红外吸收光谱,用于研究利伐沙班浓度与其远红外吸收光谱的变化规律关系。具体实验中,将不同质量的利伐沙班与PE混合,得到浓度分别43 mmol/L,86 mmol/L,129 mmol/L,172 mmol/L,215 mmol/L和430 mmol/L的样品,测得这些样品的吸收光谱如图2所示。图中清楚地显示,随着利伐沙班的浓度增大,其四个远红外特征吸收峰的幅值呈现有规律地上升趋势。

图 2 (a) 不同浓度利伐沙班的远红外吸收光谱图;(b) 不同浓度利伐沙班样品在96.2 cm−1处吸收度与其浓度的线性关系
Figure 2. (a) Far-IR absorbance spectra of rivaroxaban with different concentration; (b) Linear relationship between absorbance and concentration of rivaroxaban with different concentrations at 96.2 cm−1
为准确地定量分析利伐沙班,分别提取不同浓度利伐沙班样品在其最强的远红外特征吸收峰(即96.2 cm−1吸收峰)的吸光度(A),分析吸光度与利伐沙班浓度(C)之间的变化关系。根据朗伯-比尔定律,对数据进行线性拟合,拟合结果如图2(b)所示,相应的线性拟合函数表达式为:
$$ {{A}}=1.933\;63{{C}}+0.037\;83 $$ (3) 拟合函数的R2为0.9914,标准差SD为0.00155,表明实验结果与线性拟合函数高度吻合。随着利伐沙班的浓度增大,其远红外吸收光谱上对应的特征吸收峰的吸收系数也呈线性递增,符合与朗伯-比尔定律,且误差范围小。对于后期利伐沙班的定量检测,只需得到待测样品的利伐沙班远红外特征吸收峰位置处的吸收系数值,结合线性拟合函数,就可以反推得出待测物质中利伐沙班的浓度。
-
拉曼光谱与远红外光谱都属于物理性、无损的检测方法。接着,文中采用激光共聚焦拉曼光谱仪测试不同浓度的利伐沙班样本,并与远红外的定量检测结果对比。拉曼检测实验测试的样本形式为液态,检测结果如图3所示。在1300~1700 cm−1 Raman位移范围内,利伐沙班具有两个拉曼特征峰,分别位于1446 cm−1和1564 cm−1。但当利伐沙班的浓度为60 mmol/L时,没有观察到这两个利伐沙班的拉曼特征峰,直到其浓度增加至80 mmol/L,才观察到这两个拉曼特征峰。这表明拉曼光谱法对利伐沙班浓度的检测最低限约为80 mmol/L。基于以上实验结果,文中得出结论:对于利伐沙班的定量检测,远红外光谱法的检测最低限比拉曼光谱法的检测最低限更低。
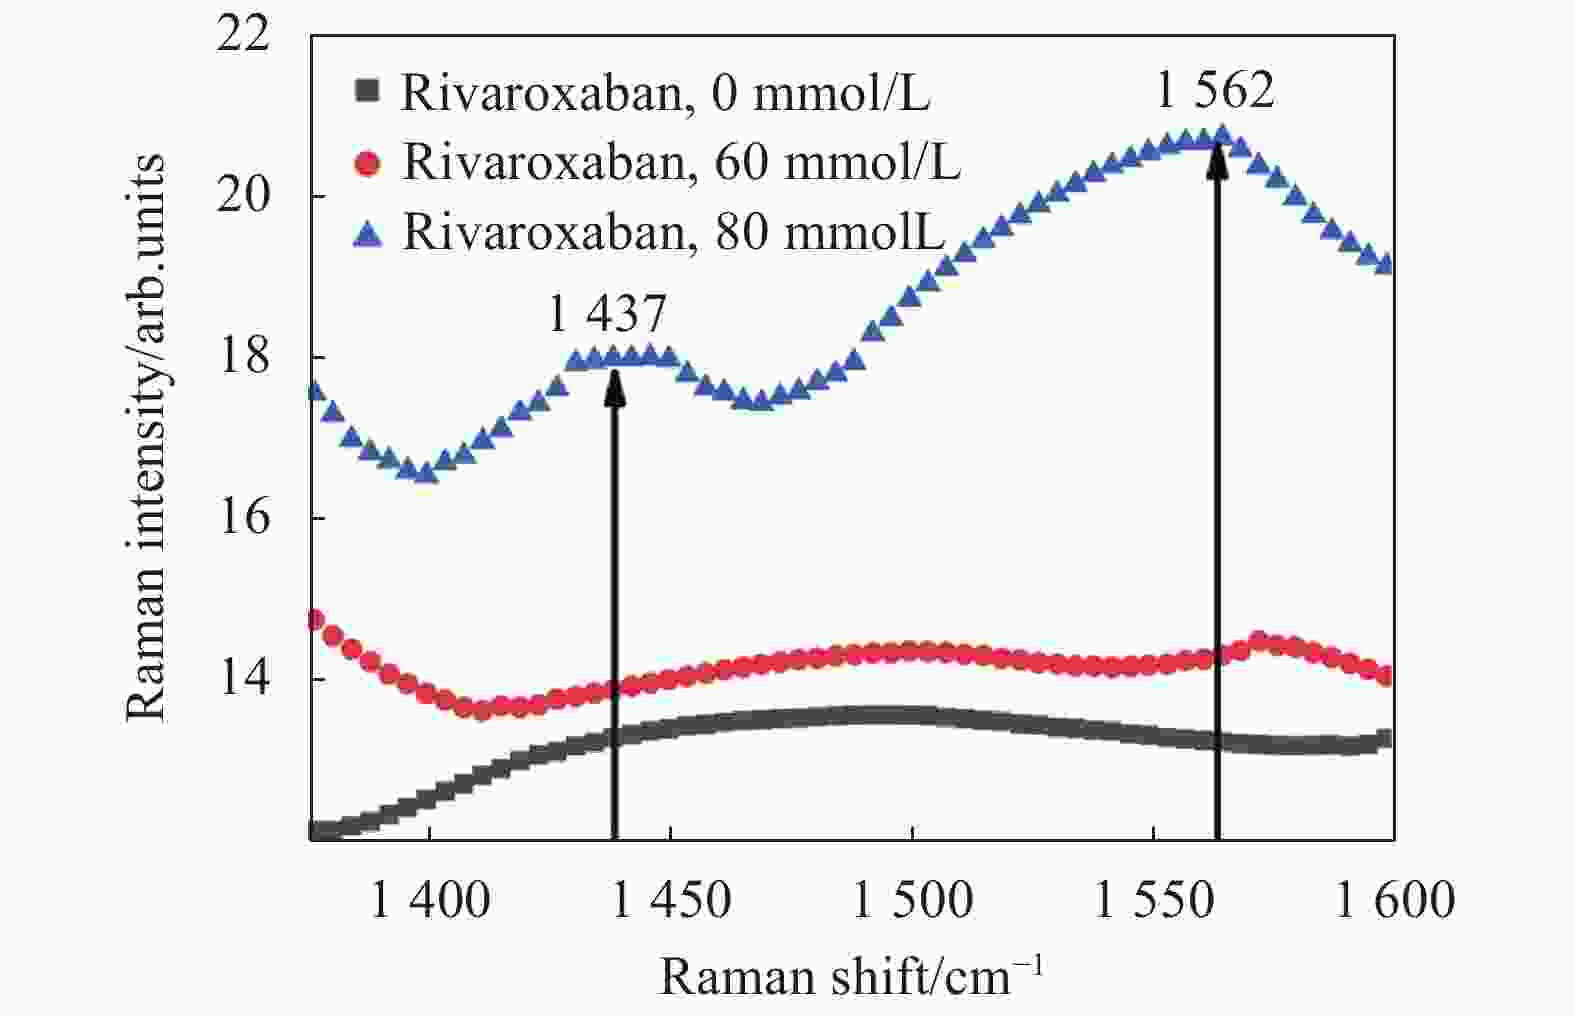
图 3 不同浓度利伐沙班的拉曼光谱图
Figure 3. Raman spectra of rivaroxaban with different concentrations
-
文中提出了两种针对利伐沙班浓度检测的方法,分别是远红外光谱法和拉曼光谱法。通过傅里叶变换红外光谱技术和激光共聚焦拉曼光谱技术,检测不同浓度下利伐沙班样品,发现两种方法都可以通过利伐沙班的特征峰对其进行识别和浓度定量检测。其中,利伐沙班的远红外特征峰强度与其含量之间存在线性变化规律,以此为基础可准确定量分析液态样本中利伐沙班的浓度,实现对液体状态下利伐沙班的定量检测。与拉曼法相比,远红外法的检测最低限更低。总体而言,文中研究结果不仅为人体血/尿液中利伐沙班的检测提供了参考价值,这对血栓患者的预防和治疗用药具有重要意义。
Quantitative detection of rivaroxaban based on far-IR absorbance spectroscopy and Raman spectroscopy
-
摘要: 利伐沙班是一种新型口服抗凝药,它具有疗效确切、安全性好、使用方便等优点,所以经常用于静脉血栓栓塞性疾病的预防与治疗,以及非瓣膜性房颤的卒中预防。由于利伐沙班在患者体内的浓度会影响其对凝血因子Xa的抑制作用,这导致患者的临床反应有个体差异,影响最终治疗效果。为了更加合理地使用利伐沙班,临床上需要监测人体血液或尿液中利伐沙班的浓度。针对该临床需求,文中基于远红外指纹谱和拉曼特征谱在物质有效识别和定量分析的优势,采用傅里叶变换红外光谱仪和激光共聚焦拉曼光谱系统,针对液体状态下利伐沙班进行识别并定量检测。文中先通过傅里叶变换红外光谱仪检测利伐沙班的远红外吸收谱随其浓度发生的变化,再通过激光共聚焦拉曼光谱系统检测了利伐沙班的拉曼光谱随其浓度发生的变化,最后比较了远红外光谱法与拉曼法的准确率。经过比较,远红外检测的精度比拉曼光谱检测的精度提升2倍。这些结果对临床医学中利伐沙班的使用具有重要意义。Abstract: Rivaroxaban is a new type of oral anticoagulant, which has the advantages of definite curative effect, good safety and convenient use, so it is often used in the prevention and treatment of venous thromboembolic diseases and stroke prevention of non valvular atrial fibrillation. Due to the concentration of rivaroxaban in patients, it will affect the inhibition of coagulation factor Xa, which leads to individual differences in the clinical response of patients and affects the final treatment effect. In order to use rivaroxaban more reasonably, it is necessary to monitor the concentration of rivaroxaban in human blood or urine. For the clinical needs, based on the advantages of far-infrared fingerprint spectrum and Raman characteristic spectrum in effective identification and quantitative analysis of substances, Fourier transform infrared spectrometer and laser confocal Raman spectroscopy system were used to identify and quantitatively detect rivaroxaban in liquid state. In this paper, the change of far-infrared absorption spectrum of rivaroxaban with its concentration was detected by Fourier transform infrared spectrometer, and then the change of Raman spectrum of rivaroxaban with its concentration was detected by laser confocal Raman spectroscopy system. Finally, the accuracy of far-infrared spectroscopy method and Raman method was compared. After comparison, it is proved that the accuracy of far-infrared detection is 2 times higher than that of Raman spectrum detection. These results are of great significance for the use of rivaroxaban in clinical medicine.
-
图 1 430 mmol/L利伐沙班的远红外谱图表征
Figure 1. Far-IR characteristic absorption spectrum of 430 mmol/L rivaroxaban detected by far-IR spectroscopy
图 2 (a) 不同浓度利伐沙班的远红外吸收光谱图;(b) 不同浓度利伐沙班样品在96.2 cm−1处吸收度与其浓度的线性关系
Figure 2. (a) Far-IR absorbance spectra of rivaroxaban with different concentration; (b) Linear relationship between absorbance and concentration of rivaroxaban with different concentrations at 96.2 cm−1
-
[1] Kubitza D, Becka M, Voith B, et al. Safety, pharmacodynamics, and pharmacokinetics of single doses of BAY 59‐7939, an oral, direct factor Xa inhibitor [J]. Clinical Pharmacology & Therapeutics, 2005, 78(4): 412-21. [2] Kirchhof P, Benussi S, Kotecha D, et al. 2016 ESC Guidelines for the management of atrial fibrillation developed in collaboration with EACTS [J]. European Heart Journal, 2016, 37(38): 2893-962. doi: 10.1093/eurheartj/ehw210 [3] Maqsood M, Imran Hasan Khan M, Yameen M, et al. Use of oral rivaroxaban in cerebral venous thrombosis [J]. Journal of Drug Assessment, 2021, 10(1): 1-6. doi: 10.1080/21556660.2020.1838769 [4] Weinz C, Schwarz T, Kubitza D, et al. Metabolism and excretion of rivaroxaban, an oral, direct factor Xa inhibitor, in rats, dogs, and humans [J]. Drug Metabolism and Disposition, 2009, 37(5): 1056-1064. doi: 10.1124/dmd.108.025569 [5] Harenberg J, Du S, Wehling M, et al. Measurement of dabigatran, rivaroxaban and apixaban in samples of plasma, serum and urine, under real life conditions. An international study [J]. Clinical Chemistry and Laboratory Medicine (CCLM), 2016, 54(2): 275-283. [6] Mueck W, Lensing A W A, Agnelli G, et al. Rivaroxaban: population pharmacokinetic analyses in patients treated for acute deep-vein thrombosis and exposure simulations in patients with atrial fibrillation treated for Stroke prevention [J]. Clinical Pharmacokinetics, 2011, 50(10): 675-686. doi: 10.2165/11595320-000000000-00000 [7] Shadvar K, Sadaghi P, Hamishekar H, et al. Efficacy of prothrombin complex concentrate for reversal of major bleeding due to rivaroxaban: A pilot randomized controlled trial [J]. Journal of Clinical Anesthesia, 2021, 68: 110093. doi: 10.1016/j.jclinane.2020.110093 [8] Mueck W, Stampfuss J, Kubitza D, et al. Clinical pharmacokinetic and pharmacodynamic profile of rivaroxaban [J]. Clinical Pharmacokinetics, 2014, 53(1): 1-16. doi: 10.1007/s40262-013-0100-7 [9] Plusquellic D F, Siegrist K, Heilweil E J, et al. Applications of terahertz spectroscopy in biosystems [J]. Chem Phys Chem, 2007, 8(17): 2412-2431. doi: 10.1002/cphc.200700332 [10] Cheng C, Zhu Z, Li S, et al. Broadband terahertz recognizing conformational characteristics of a significant neurotransmitter γ-aminobutyric acid [J]. RSC Advances, 2019, 9: 20240-20247. doi: 10.1039/C9RA02971K [11] Li T, Ma H, Peng Y, et al. Gaussian numerical analysis and terahertz spectroscopic measurement of homocysteine [J]. Biomed Opt Express, 2018, 9(11): 5467-5476. doi: 10.1364/BOE.9.005467 [12] Zhu Z, Cheng C, Chang C, et al. Characteristic fingerprint spectrum of neurotransmitter norepinephrine with broadband terahertz time-domain spectroscopy [J]. Analyst, 2019, 144(8): 2504-2510. doi: 10.1039/C8AN02079E [13] Zhao Z, Zheng X, Peng W, et al. Terahertz electromagnetically-induced transparency of self-complementary meta-molecules on Croatian checkerboard [J]. Scientific Reports, 2019, 9: 6205. doi: 10.1038/s41598-019-42038-8 [14] Resende G C, Ribeiro G A S, Silveira O J, et al. Origin of the complex Raman tensor elements in single-layer triclinic ReSe2 [J]. 2D Mater, 2021, 8(2): 025002. [15] Abu Bakkar M, Nawaz H, Majeed M I, et al. Raman spectroscopy for the qualitative and quantitative analysis of solid dosage forms of Sitagliptin [J]. Spectrochimica Acta Part a-Molecular and Biomolecular Spectroscopy, 2021, 245: 118900. doi: 10.1016/j.saa.2020.118900 [16] Ryzhikova E, Ralbovsky N M, Sikirzhytski V, et al. Raman spectroscopy and machine learning for biomedical applications: Alzheimer's disease diagnosis based on the analysis of cerebrospinal fluid [J]. Spectrochimica Acta Part A, Molecular and Biomolecular Spectroscopy, 2021, 248: 119188. doi: 10.1016/j.saa.2020.119188 [17] Hangyo M, Tani M, Nagashima T. Terahertz time-domain spectroscopy of solids: A review [J]. International Journal of Infrared and Millimeter Waves, 2005, 26(12): 1661-1690. doi: 10.1007/s10762-005-0288-1 -

 点击查看大图

图(3)
计量
- 文章访问数: 830
- HTML全文浏览量: 220
- PDF下载量: 48
- 被引次数: 0


