


-
光纤光栅(FBG)传感作为近年来迅速发展的一项新型传感技术,由于其具有抗电磁干扰、线性传感、便于复用组网等优点,在结构健康监测领域具有巨大的应用价值[1-2],为大型工程如桥梁大坝、土木建筑、电力系统等不同环境健康监测提供技术解决途径[3-5]。近年来,由于其在多测点、多测量参量应用中具有可串接、高集成、小体积、轻质量的突出优势,备受航天监测应用青睐[6]。为了实时监测航天器结构系统的安全性和可靠性,美国国家航空航天局(NASA)研究和开发了结构健康管理技术,光纤传感器是其首选技术,他们利用FBG对无人机上的机翼进行了变形测量的实验。在机翼表面粘贴光纤,利用2 000个应变测量元件实时感知并测量机翼的应力,并得到了很好的应用[7]。
FBG传感网络在结构健康监测系统中需要进行长期的信息监测,不可避免地会受到诸如环境温度、湿度、化学腐蚀等外界因素的冲击影响[8-10]。在长期的循环荷载和环境侵蚀的双重作用下,FBG传感器会出现不同程度的性能退化现象[11]。FBG性能退化会出现不同程度的光谱畸变、光强衰减、光谱重叠等现象,这些退化光谱难以被解调,进而使FBG失去传感能力[12]。文中主要研究光强衰减这一现象,光强衰减使光纤光栅反射谱峰值强度差异过大,导致无法有效寻峰或寻峰误差增大,影响了监测系统监测精度、可靠性、实时性。一般工程中会通过维修光源或传感线路解决上述问题,但这造成及时性不够,甚至无法实施,所以,需要一种自适应解调技术来解决这一问题。
为了解决光纤光栅光谱反射强度差异过大这一问题,文中分析了影响寻峰稳定性的因素,探究了曝光周期与光谱峰值的关系,确定了寻峰阈值的计算方法,提出了利用不同曝光周期多次曝光解调的方法,建立了曝光周期、寻峰阈值自适应调整规则,用LabVIEW软件平台编写了自适应寻峰解调算法,经过实验验证,该算法能够有效提高谱峰识别数量、解调系统自适应能力和工作可靠性。
-
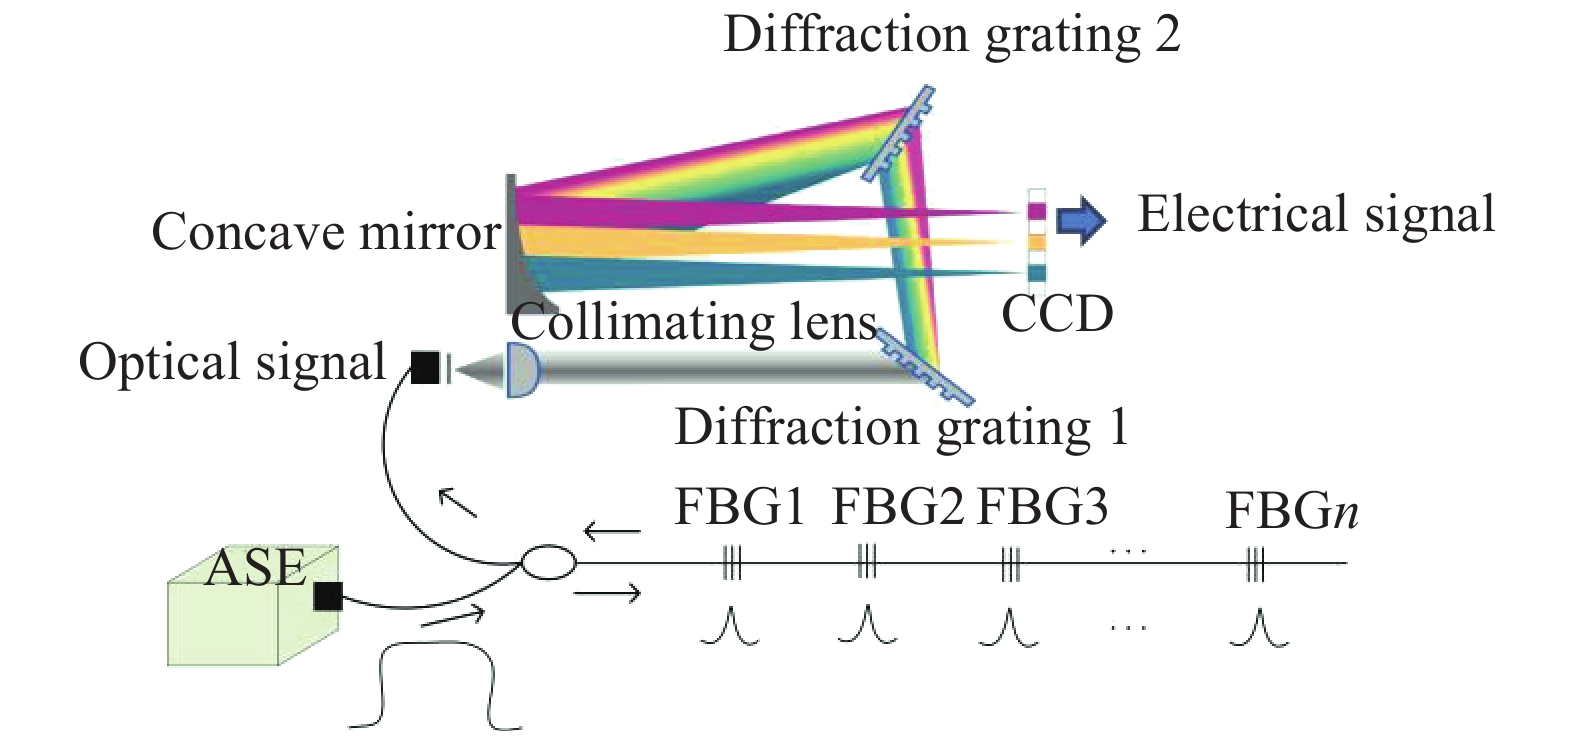
对于光纤光栅传感信号解调的核心工作,是依据对光纤光栅不同的中心波长返回值进行读取和变换,进而得到外界信息的变化量[13]。文中采用的解调仪是基于多级衍射光栅及线阵红外CCD原理,光路采用透射光栅色散原理[14]。由宽带光源(ASE)入射的光经FBG反射后,带有传感信息的反射光经准直透镜后,由衍射光栅进行二级色散处理,完成频域—空间域的信息映射,最终聚焦于CCD线阵光电探测器[15]上,生成电信号,工作原理如图1所示。
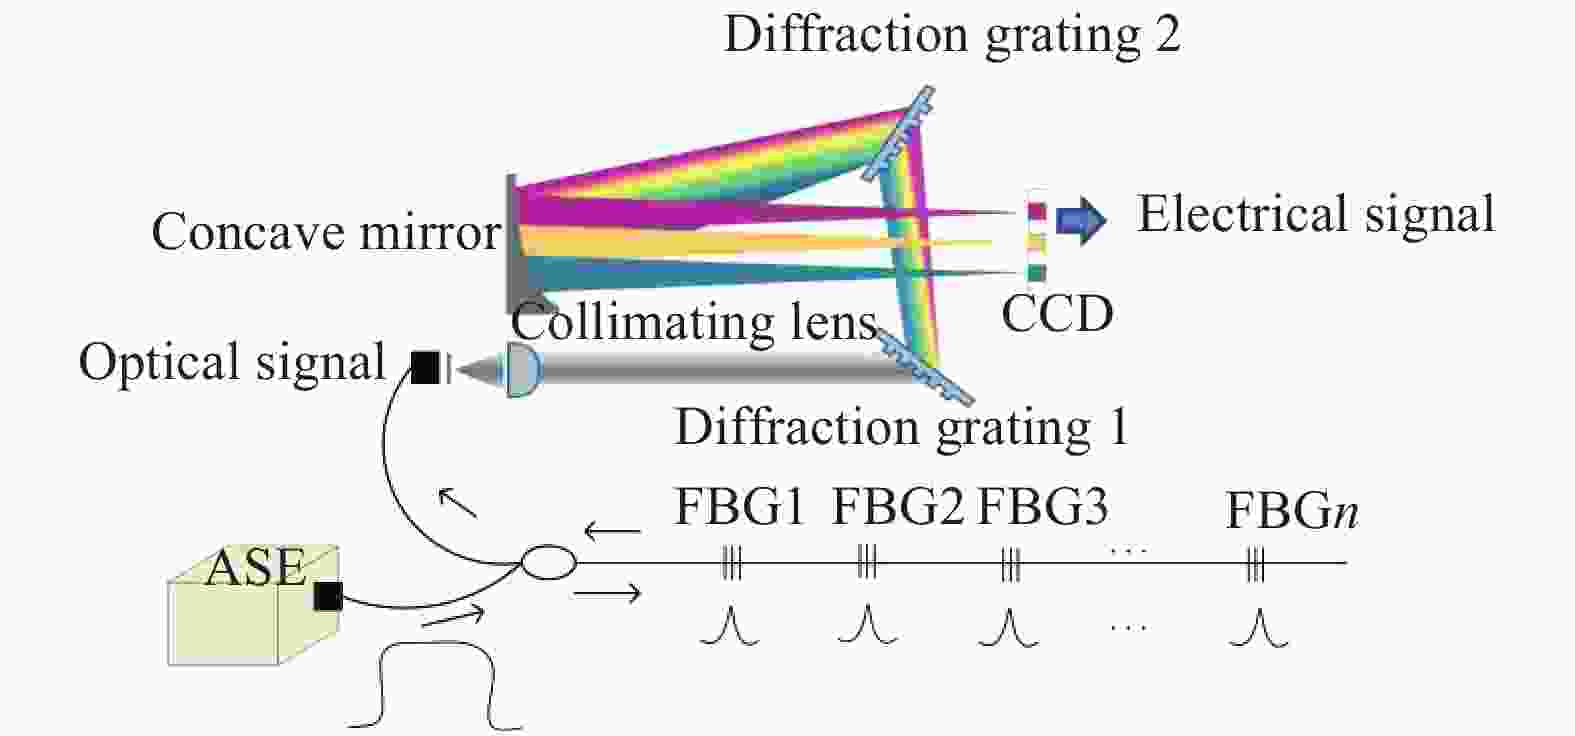
Figure 1. Schematic diagram of demodulator
CCD线阵光电探测器包含256个线性排列的光电二极管。每个光电二极管都有各自的积分电路,该电路统称为像素。经过线阵光电探测器的采集处理,得到的是FBG反射谱的光强信息,光强仅代表积分电路电压的一个数字量,电压经过16位的AD转换器转换为数字量,并无实际单位,并且与线阵探测器的像素点一一对应。每个像素所采集的光强和曝光周期有关,曝光周期指的是积分电路的时钟周期个数,一个时钟周期为100 ns,曝光周期与时钟周期的乘积为积分时间,积分时间越长,电压越大,对应的光强也越大。通过改变曝光周期可以改变每个像素点光强大小。
-
FBG反射光谱包含CCD线阵探测器256个像素点的光强信息,通过设置寻峰阈值将FBG反射光谱分段,即可对阈值以上的离散数据点进行拟合作寻峰处理,计算反射光谱谱峰的中心波长。
FBG反射谱可看作多个高斯曲线,表达式为:
式中:IO为反射谱强度的幅值;λC为反射谱中心波长;Δλ为反射谱的3 dB带宽。FBG反射谱是通过CCD线阵探测器的输出得到(Pi,Ii),即每个像素点对应的光强值。线阵探测器像素点与波长的关系通过可调谐激光器标定得到,像素点与波长的对应关系表示为:
式中:p=0.255表示线阵探测器的像素点数。
-
传统的光谱解调方法是输入不同的曝光周期和寻峰阈值观察光谱的变化,使光谱既不出现过饱和,又能尽可能地识别出较低的谱峰,同时还要保证寻峰的稳定性。但在多光栅反射谱谱峰强度不一致的情况下,很难同时符合上述要求。自适应解调算法通过自动调整曝光周期和寻峰阈值,最大限度增加有效寻峰的个数,保证寻峰的稳定性。
-
文中提出采用不同曝光周期多次曝光解调方法,每次曝光解调只保留有效寻峰得到的中心波长,最后把多次曝光解调得到的结果拼接到一起构成对整个多光栅反射谱的解调结果。
具体的算法步骤为:
(1) 根据光谱强度饱和值确定最优峰值区间,上限为Imax
,下限为Imin。 (2) 给曝光周期设定两个初始值,将曝光周期的最大初始值设为一个较大的值,保证使最高峰饱和,最小初始值设为0。
(3) 对光谱进行首次调节,在给定的两个曝光周期的初始值范围内,利用二分法寻找使整个光谱最高的峰值达到最优峰值区间的曝光周期,记录首次调节过程中的曝光周期变化值和每次所有谱峰的峰值及其像素序号,还有最终峰值达到最优峰值区间的谱峰像素序号。
(4) 根据步骤(3)记录的所有谱峰的峰值及其像素序号,删除首次调节最终达到最优峰值区间的谱峰像素序号,得到没有达到最优峰值区间的谱峰,利用像素序号索引步骤(3)记录的峰值-曝光周期点,拟合它们的峰值-曝光周期关系式组。
(5) 对光谱进行后续调节,从步骤(4)拟合的关系式组中索引最高谱峰对应的关系式,计算最高谱峰达到最优峰值区间的曝光周期,计算公式为:
式中:k和b是最高谱峰关系式的系数。以该曝光周期进行解调,筛选此时有哪些谱峰峰值达到最优峰值区间,记录该次调节的曝光周期和符合要求的谱峰,并筛选没有达到最优峰值区间的谱峰中的最高谱峰,循环执行该步骤,直到所有谱峰都达到最优峰值区间。
-
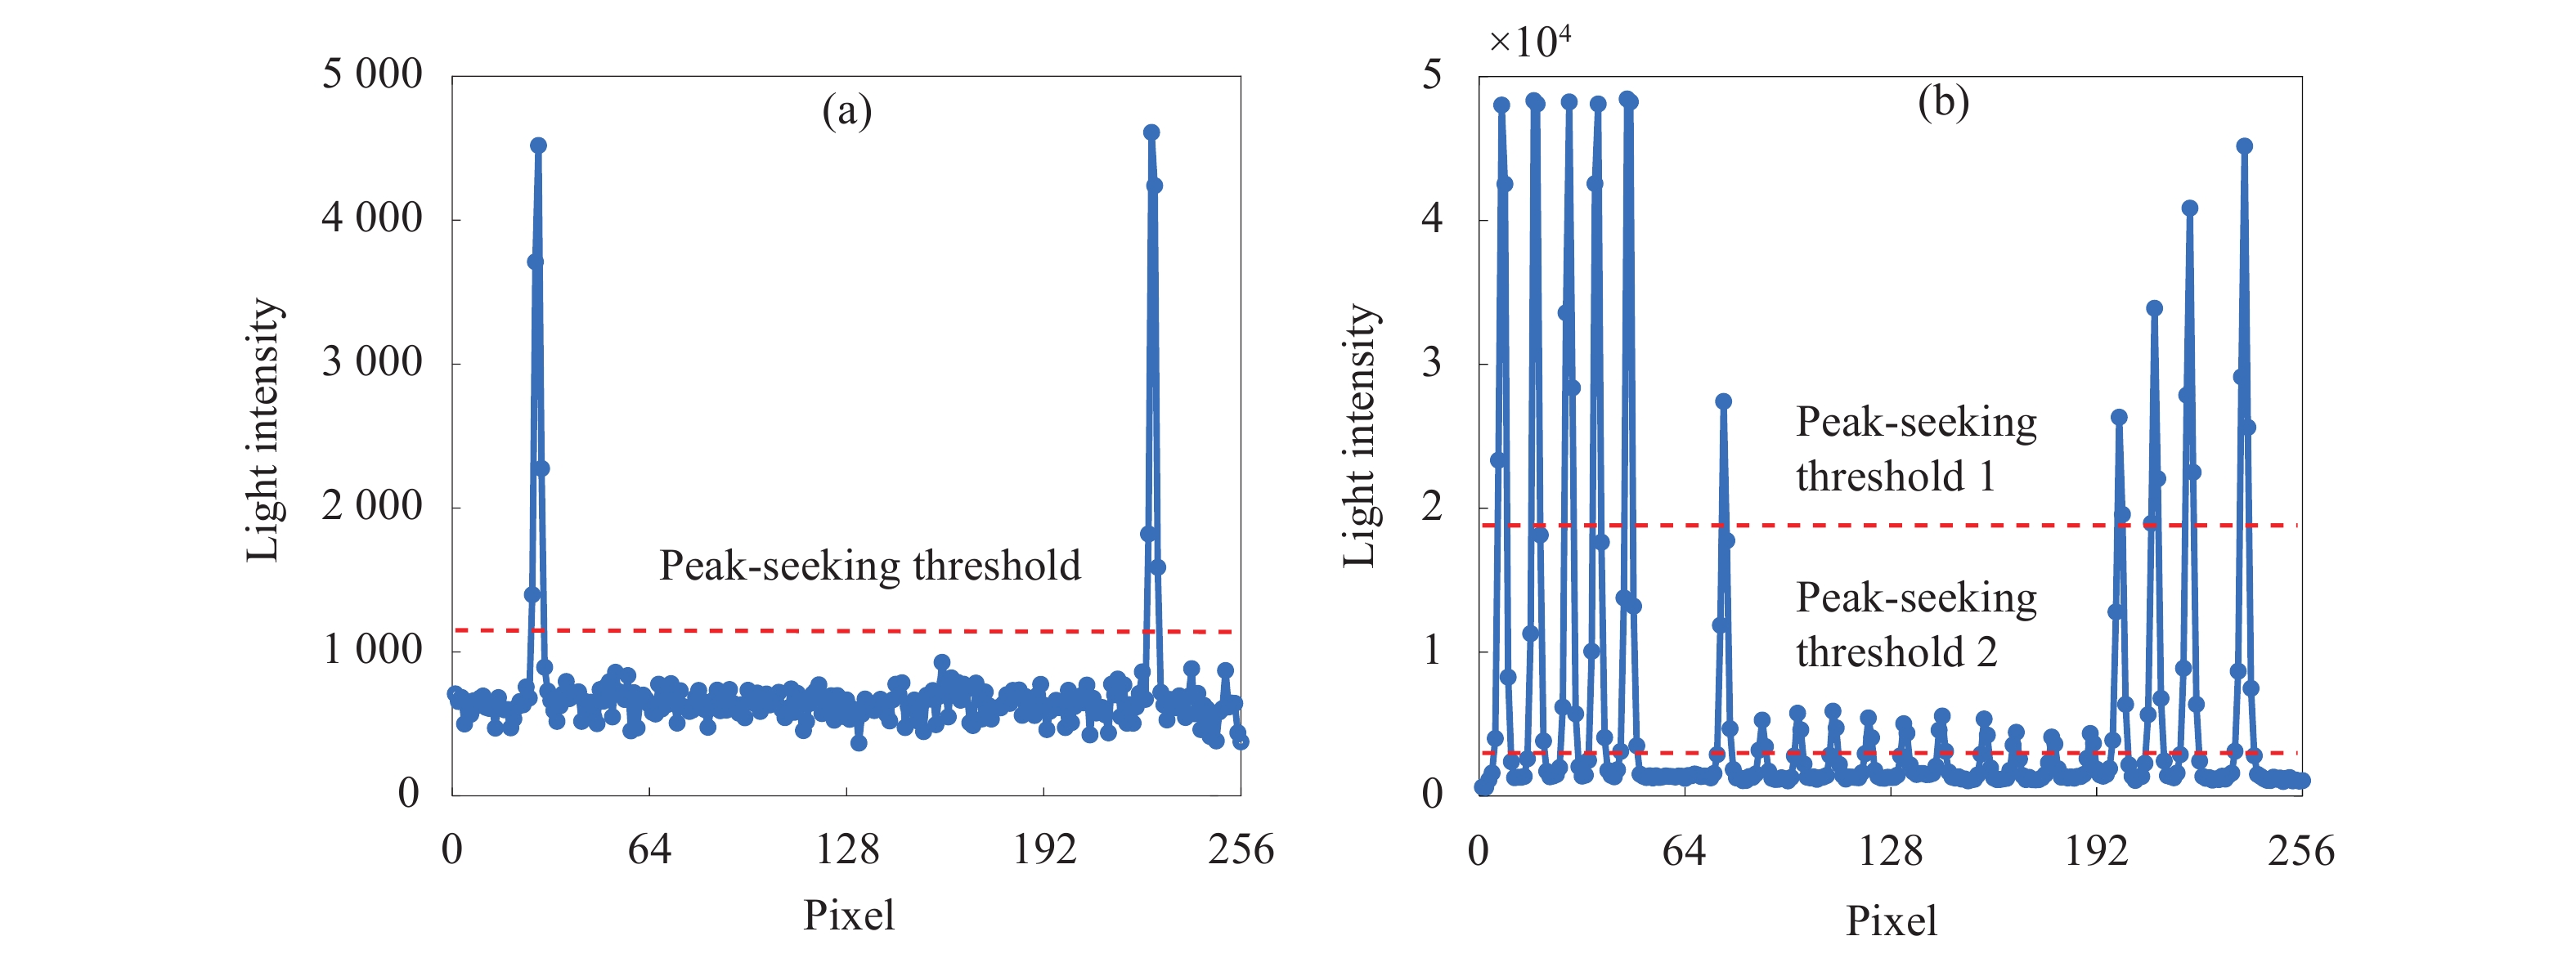
由于光谱数据中的噪声点较多,且高低不一,会产生许多小的波峰,所以需要将噪声波峰去除,留下真正的谱峰。寻峰阈值的作用是对光谱数据进行分割,阈值以下为噪声点,阈值以上为信号点,信号点构成真正的谱峰,如图2(a)所示。
在光纤光栅反射谱峰值高低差异过大时,有些谱峰会比较低,导致信号点与噪声点不易区分,如果阈值比较大,如图2(b)中的寻峰阈值1,那么就会导致比较低的谱峰无法识别,所以需要降低阈值识别更多的谱峰,如图2(b)中的寻峰阈值2,因此对于寻峰阈值的要求就是大于噪声部分,小于光谱最低峰的峰值。
因此,寻峰阈值的选取对于能否有效寻峰至关重要。对于文中提出的多次曝光解调的方法,因为曝光周期在变化,光谱也在变化,故每次曝光解调都需要根据光谱确定寻峰阈值。文中提出通过直方图统计光谱数据的分布情况来确定寻峰阈值,即分别统计在各个光强区间内光谱数据点的多少,数据点数最多的区间即为光谱噪声点所在的区间,那么,选择该区间的右边界值作为寻峰阈值,起到分割噪声点和信号点的作用。
例如,图3(a)为待统计的原始光谱图,所以寻峰阈值需要识别出9个峰。图3(b)为光谱数据分布情况的统计,图中包含点数最多的区间为1 440~2 160,区间右边界值为2160,此时能识别9个谱峰,实现了对低强度谱峰的识别,因此可以选择2160作为寻峰阈值。
Figure 2. (a) Peak-seeking threshold; (b) Comparison of peak-seeking threshold
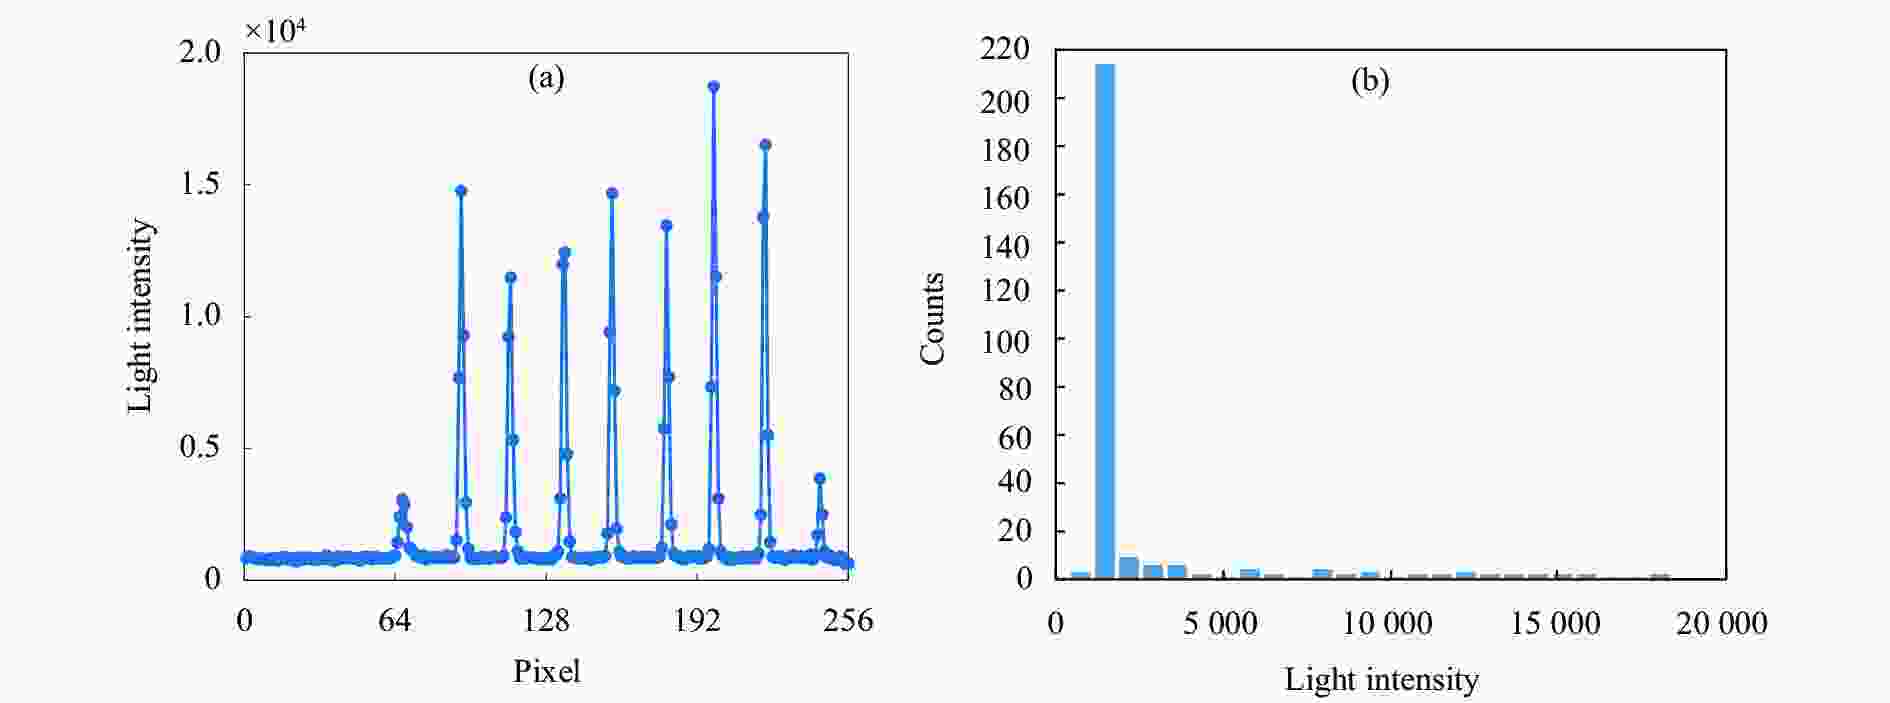
Figure 3. (a) Original spectrogram; (b) Histogram of spectral data
-
依据图4所示FBG解调实验系统进行实验。解调仪使用线阵InGaAs图像传感器[16]测量FBG反射谱的变化,该图像传感器在1525~1570 nm波长的范围内有256个像素点,像素间隔约为0.176 nm。FBG的3 dB带宽为0.2~0.3 nm。
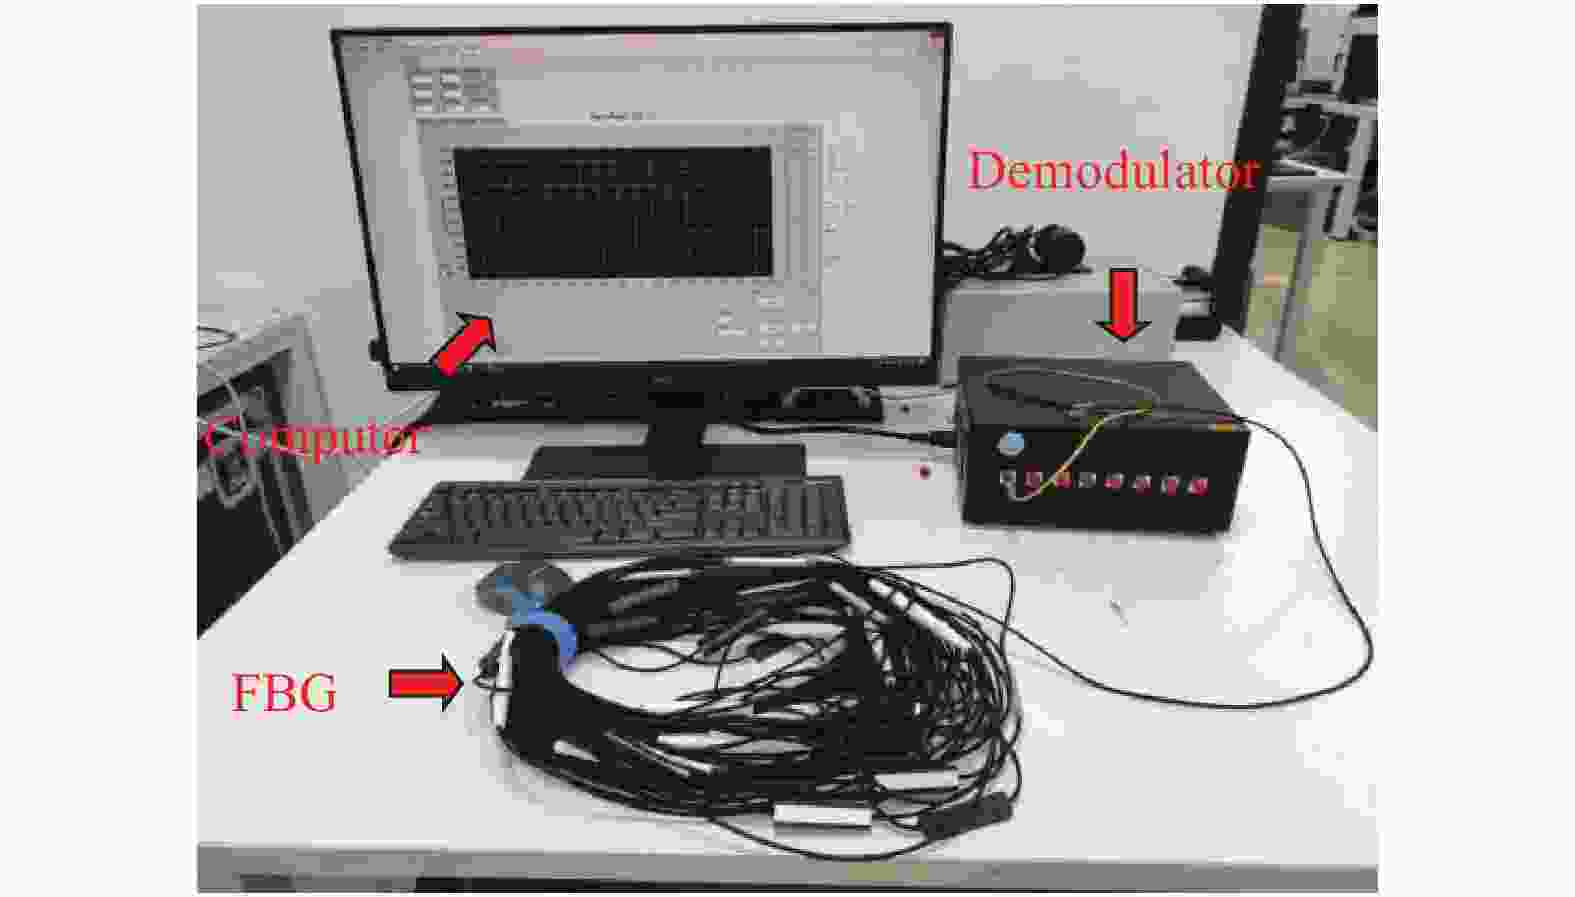
Figure 4. Experimental system of FBG demodulation
-
该实验分单光栅实验和多光栅实验,探究不同波峰数的光谱中光强峰值和曝光周期的关系。
-
将单光栅光纤连入解调仪的1通道,分别在不同的曝光周期下曝光解调,求得不同曝光周期下谱峰的光强峰值,并根据记录的峰值-曝光周期点绘制关系图,结果如图5所示,由图可知在曝光周期达到200左右时,谱峰达到过饱和,峰值基本不再变化。
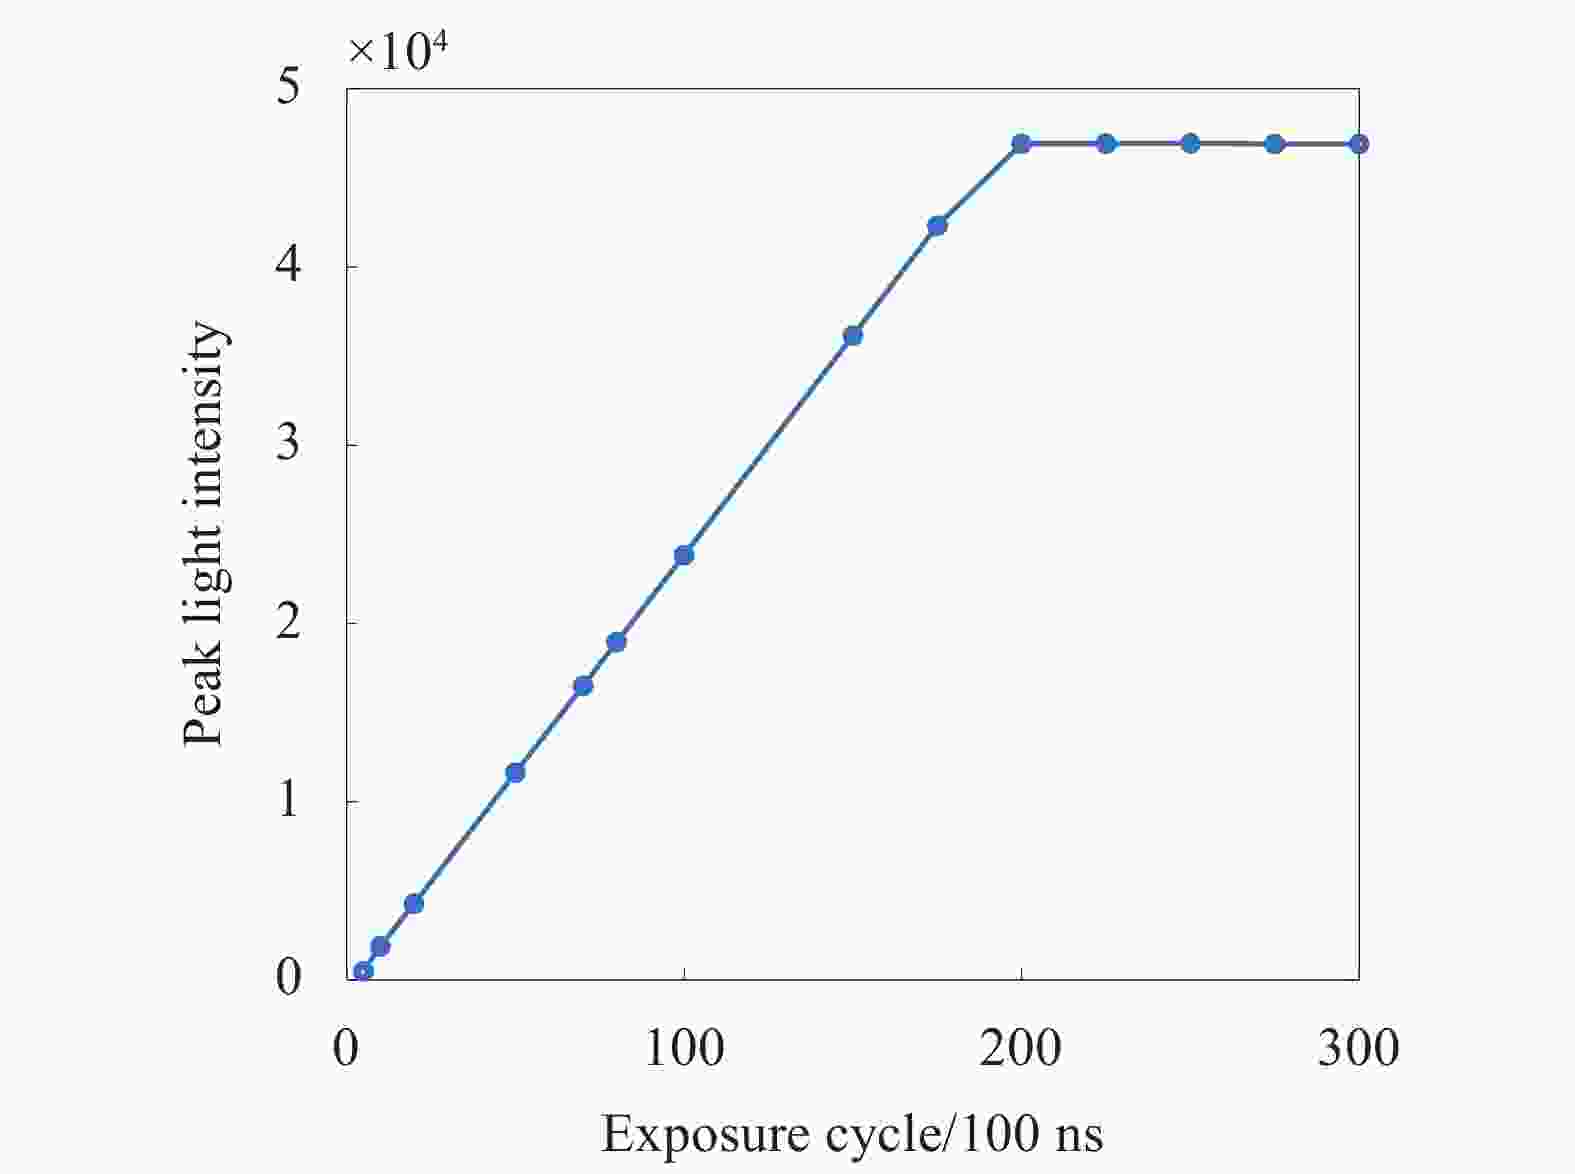
Figure 5. Peak light intensity-exposure cycle relationship of single grating fiber
由于该实验研究的是光谱光强饱和值之下的峰值变化规律,所以截取饱和值之下的数据进行分析,比较不同方式的拟合效果,结果如表1所示。
其中线性拟合和多项式拟合的决定系数最大,说明线性拟合和多项式拟合x对y的解释程度非常高,从计算效率考虑,线性拟合优于多项式拟合,因此在单峰光谱的情况下可以认为峰值和曝光周期呈一次线性关系。
Fitting mode Relational expression Determining coefficient R2 Exponential fitting y=1 904e0.021 6x 0.754 4 Linear fitting y=245.93x−669.76 0.999 99 Logarithmic fitting y=10 877ln(x)−24 004 0.822 6 Polynomial fitting y=0.004 3x2+245.19x−652.06 0.999 99 Power function fitting y=94.961x1.204 7 0.987 2 Table 1. Comparison of different fitting methods of single grating fiber peak light intensity-exposure cycle
-
该实验选取的多光栅光纤带有10个光栅,将光纤光栅连入解调仪的2通道,多次曝光解调,记录不同曝光周期下每个峰的峰值,并根据每个峰的峰值-曝光周期数据绘制关系图,结果如图6所示,由图可知,每个谱峰的峰值与曝光周期也近似线性拟合,故分别进行线性拟合,结果如表2所示。
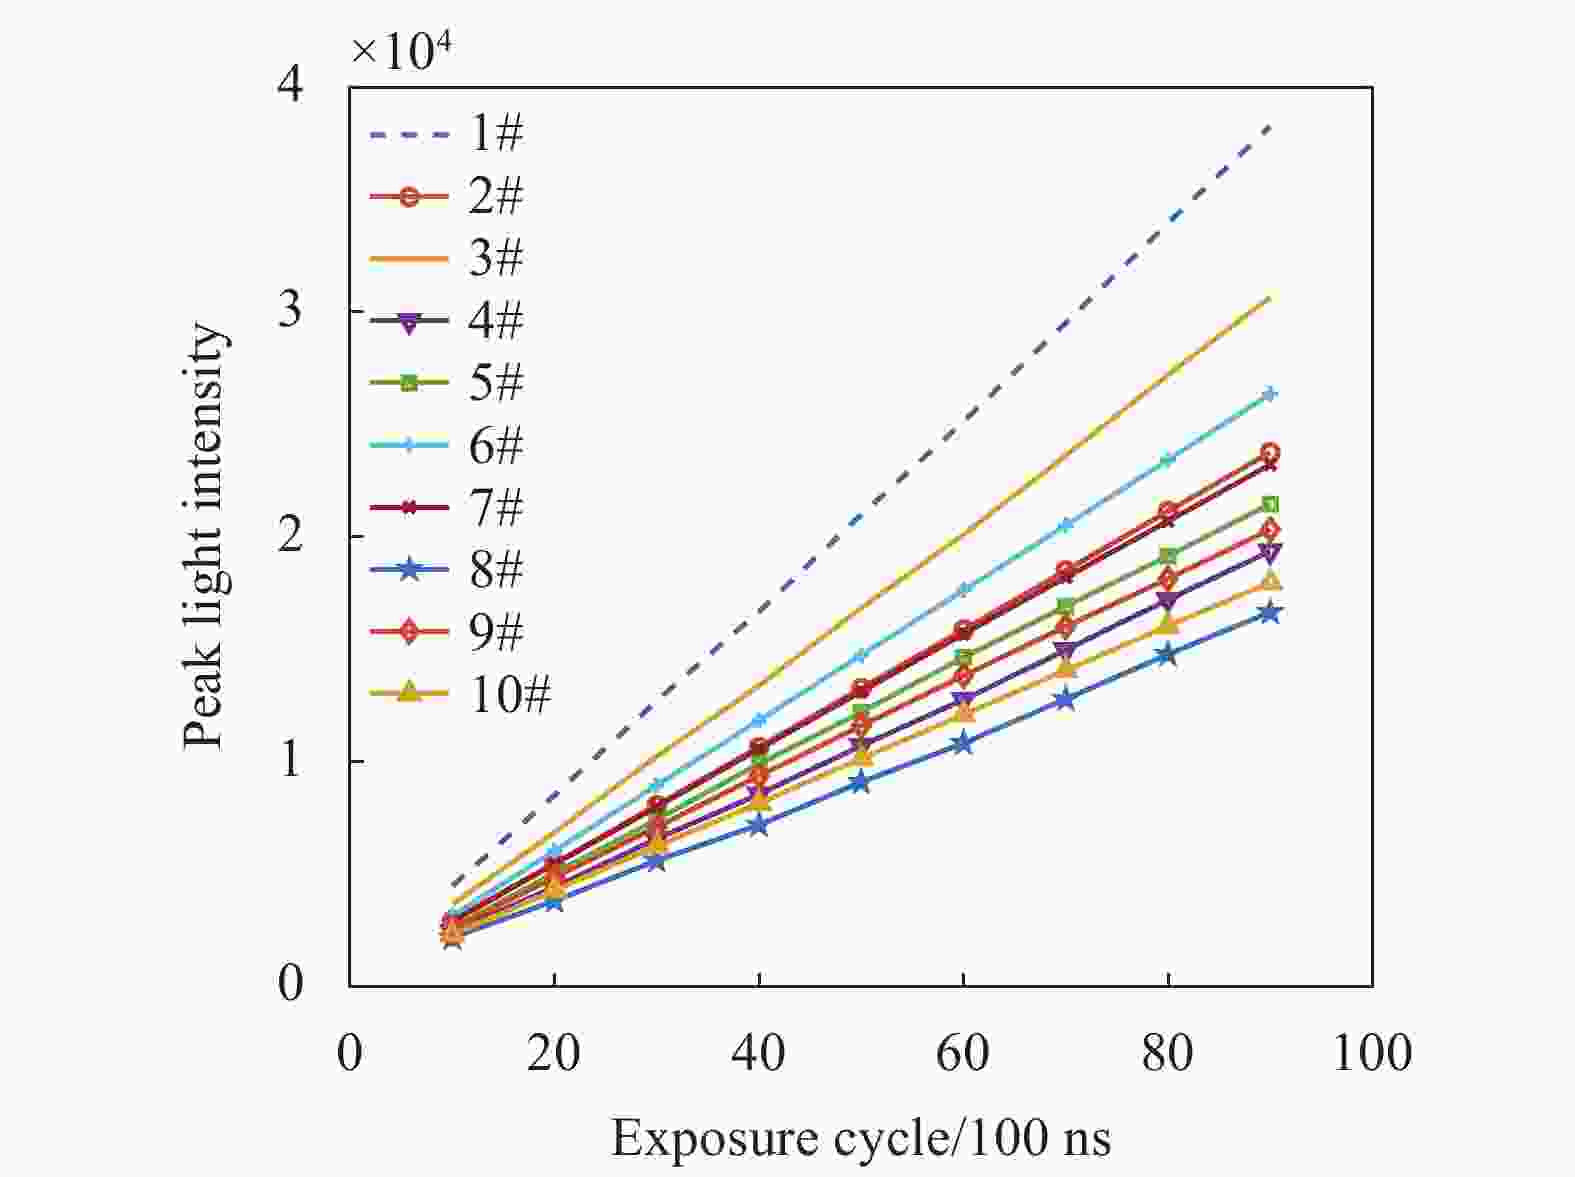
Figure 6. Peak light intensity-exposure cycle relationship of multi-grating fiber
Peak serial number 1# 2# 3# 4# 5# Linear relation y=422.3x+1.944 y=260.4x+259.7 y=337.4x+62.25 y=211.7x+175.2 y=235.6x+352.8 Determining coefficient R2 0.999 75 0.999 97 0.999 69 0.999 74 0.99978 Peak serial number 6# 7# 8# 9# 10# Linear relation y=289.6x+239.3 y=254.1x+367 y=181.3x+135.6 y=221.8x+425.3 y=195.7x+346.7 Determining coefficient R2 0.999 996 0.999 98 0.998 99 0.999 89 0.999 99 Table 2. Linear fitting results of multi-grating fiber peak light intensity-exposure cycle
由于表2中线性拟合的决定系数极接近1,因此对于多峰光谱峰值和曝光周期之间的关系能够用一次线性关系来表述。
-
影响寻峰稳定性的因素包括噪声类型、光纤布拉格光栅谱型、噪声大小和寻峰算法的种类。噪声大小反映的是信噪比的大小,噪声类型和光纤布拉格光栅谱型的影响比噪声大小的影响相对较小,也不影响寻峰算法本身的优劣比较。信噪比对于寻峰稳定性的影响最大,信噪比大小的改变对寻峰稳定性的影响超过相同信噪比时各种算法间稳定性的差异,且信噪比对所有算法的影响基本一致[17]。在FBG反射光谱中信噪比的计算公式为:
式中:P表示谱峰的凸起高度,谱峰的凸起高度与峰值有关;N表示当前曝光周期下的全像素暗电流标准差,不同曝光周期下的标准差基本一致,可以当成常数。因此,信噪比的大小与谱峰峰值直接相关。经过上述分析可知,影响寻峰稳定性的主要因素为谱峰峰值,所以该实验主要研究谱峰峰值对寻峰稳定性的影响。
光纤光栅反射光中心波长的变化反映了外界信号的变化,针对FBG中心波长的分析处理是光谱解调算法的关键,因此衡量寻峰的稳定性从寻峰得到的中心波长稳定性分析。该实验选取了三个谱峰进行分析,在不同峰值下各采集10000帧光谱的数据,分别计算在不同光强峰值下的中心波长标准差,结果如图7所示。
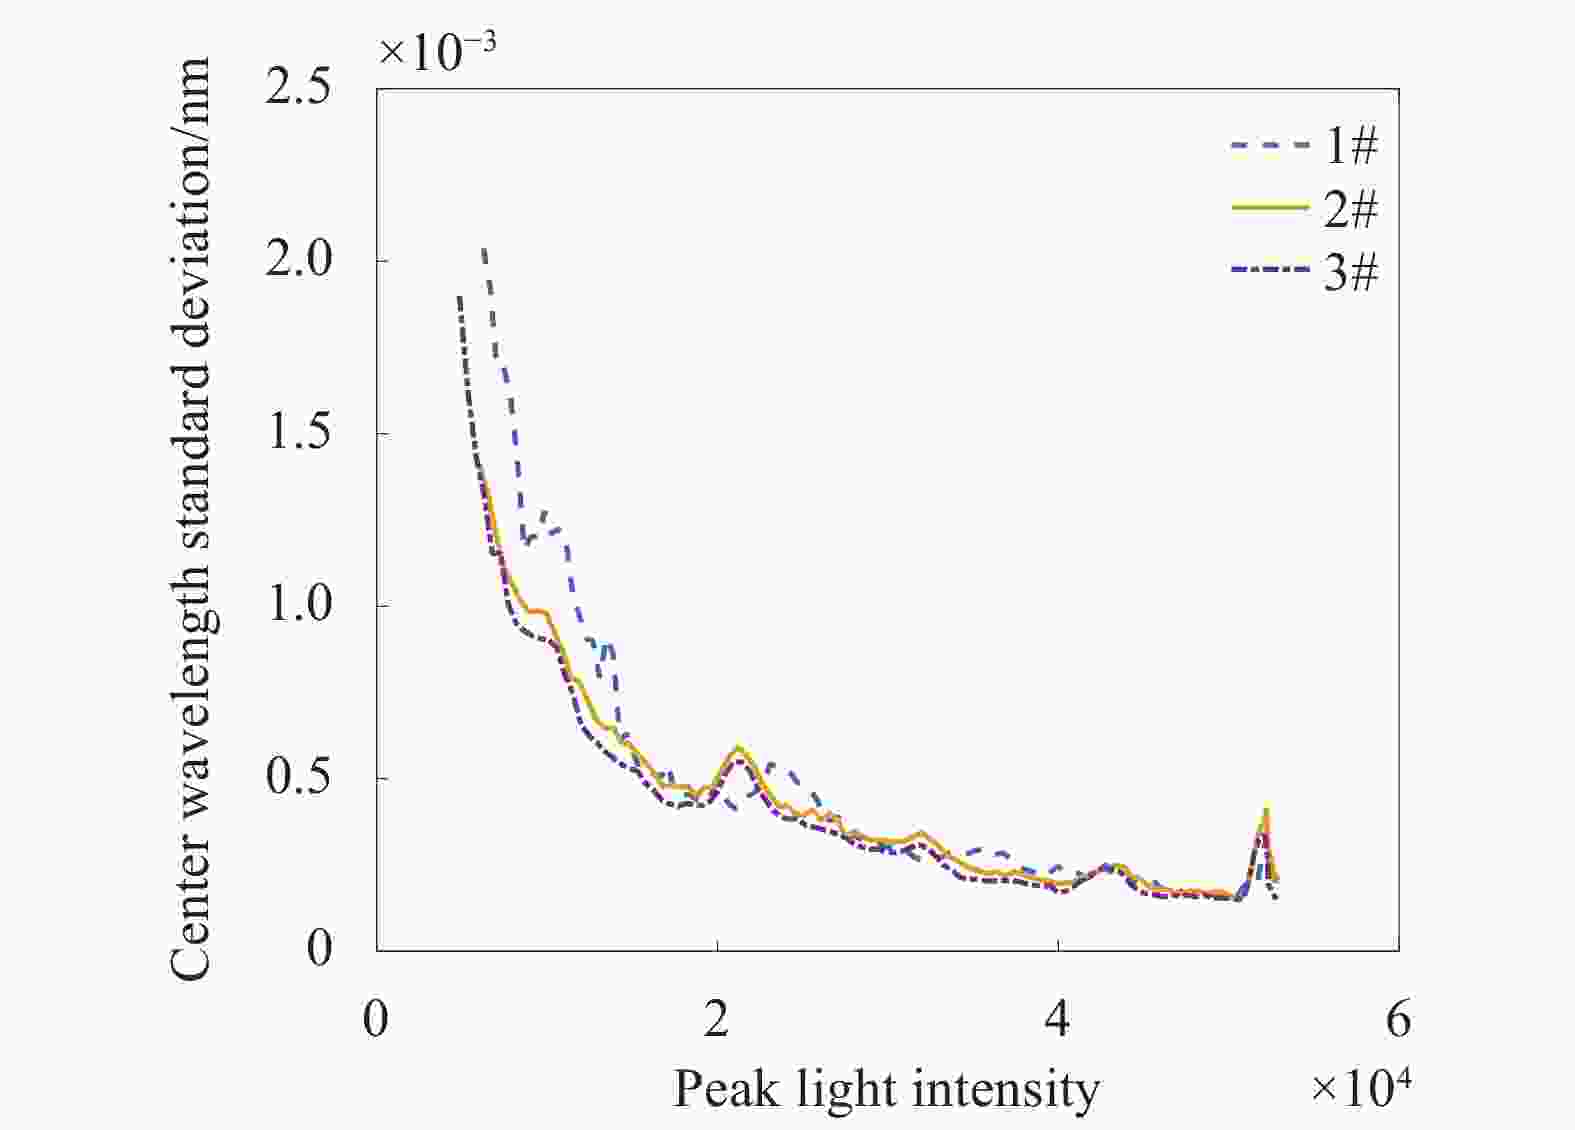
Figure 7. Curve diagram of peak light of intensity-center wavelength standard deviation
分析并总结,由以上关系图可知随着谱峰峰值的增加,中心波长的标准差逐渐减小,当峰值达到饱和时,中心波长标准差急剧增加。所以图7中最优峰值区间是35 000~45 000,在该区间中心波长标准差在0.5 pm以内,谱峰峰值在10000以下时,中心波长标准差在1 pm以上,谱峰峰值35 000~45 000时的中心波长标准差比峰值在10 000以下时减小了50%,稳定性提高了50%。图7中光谱饱和值大约是50000,因此可以选取在饱和值的70%~90%内为最优峰值区间,使寻峰具有更高的稳定性,稳定性在0.5 pm以内。
-
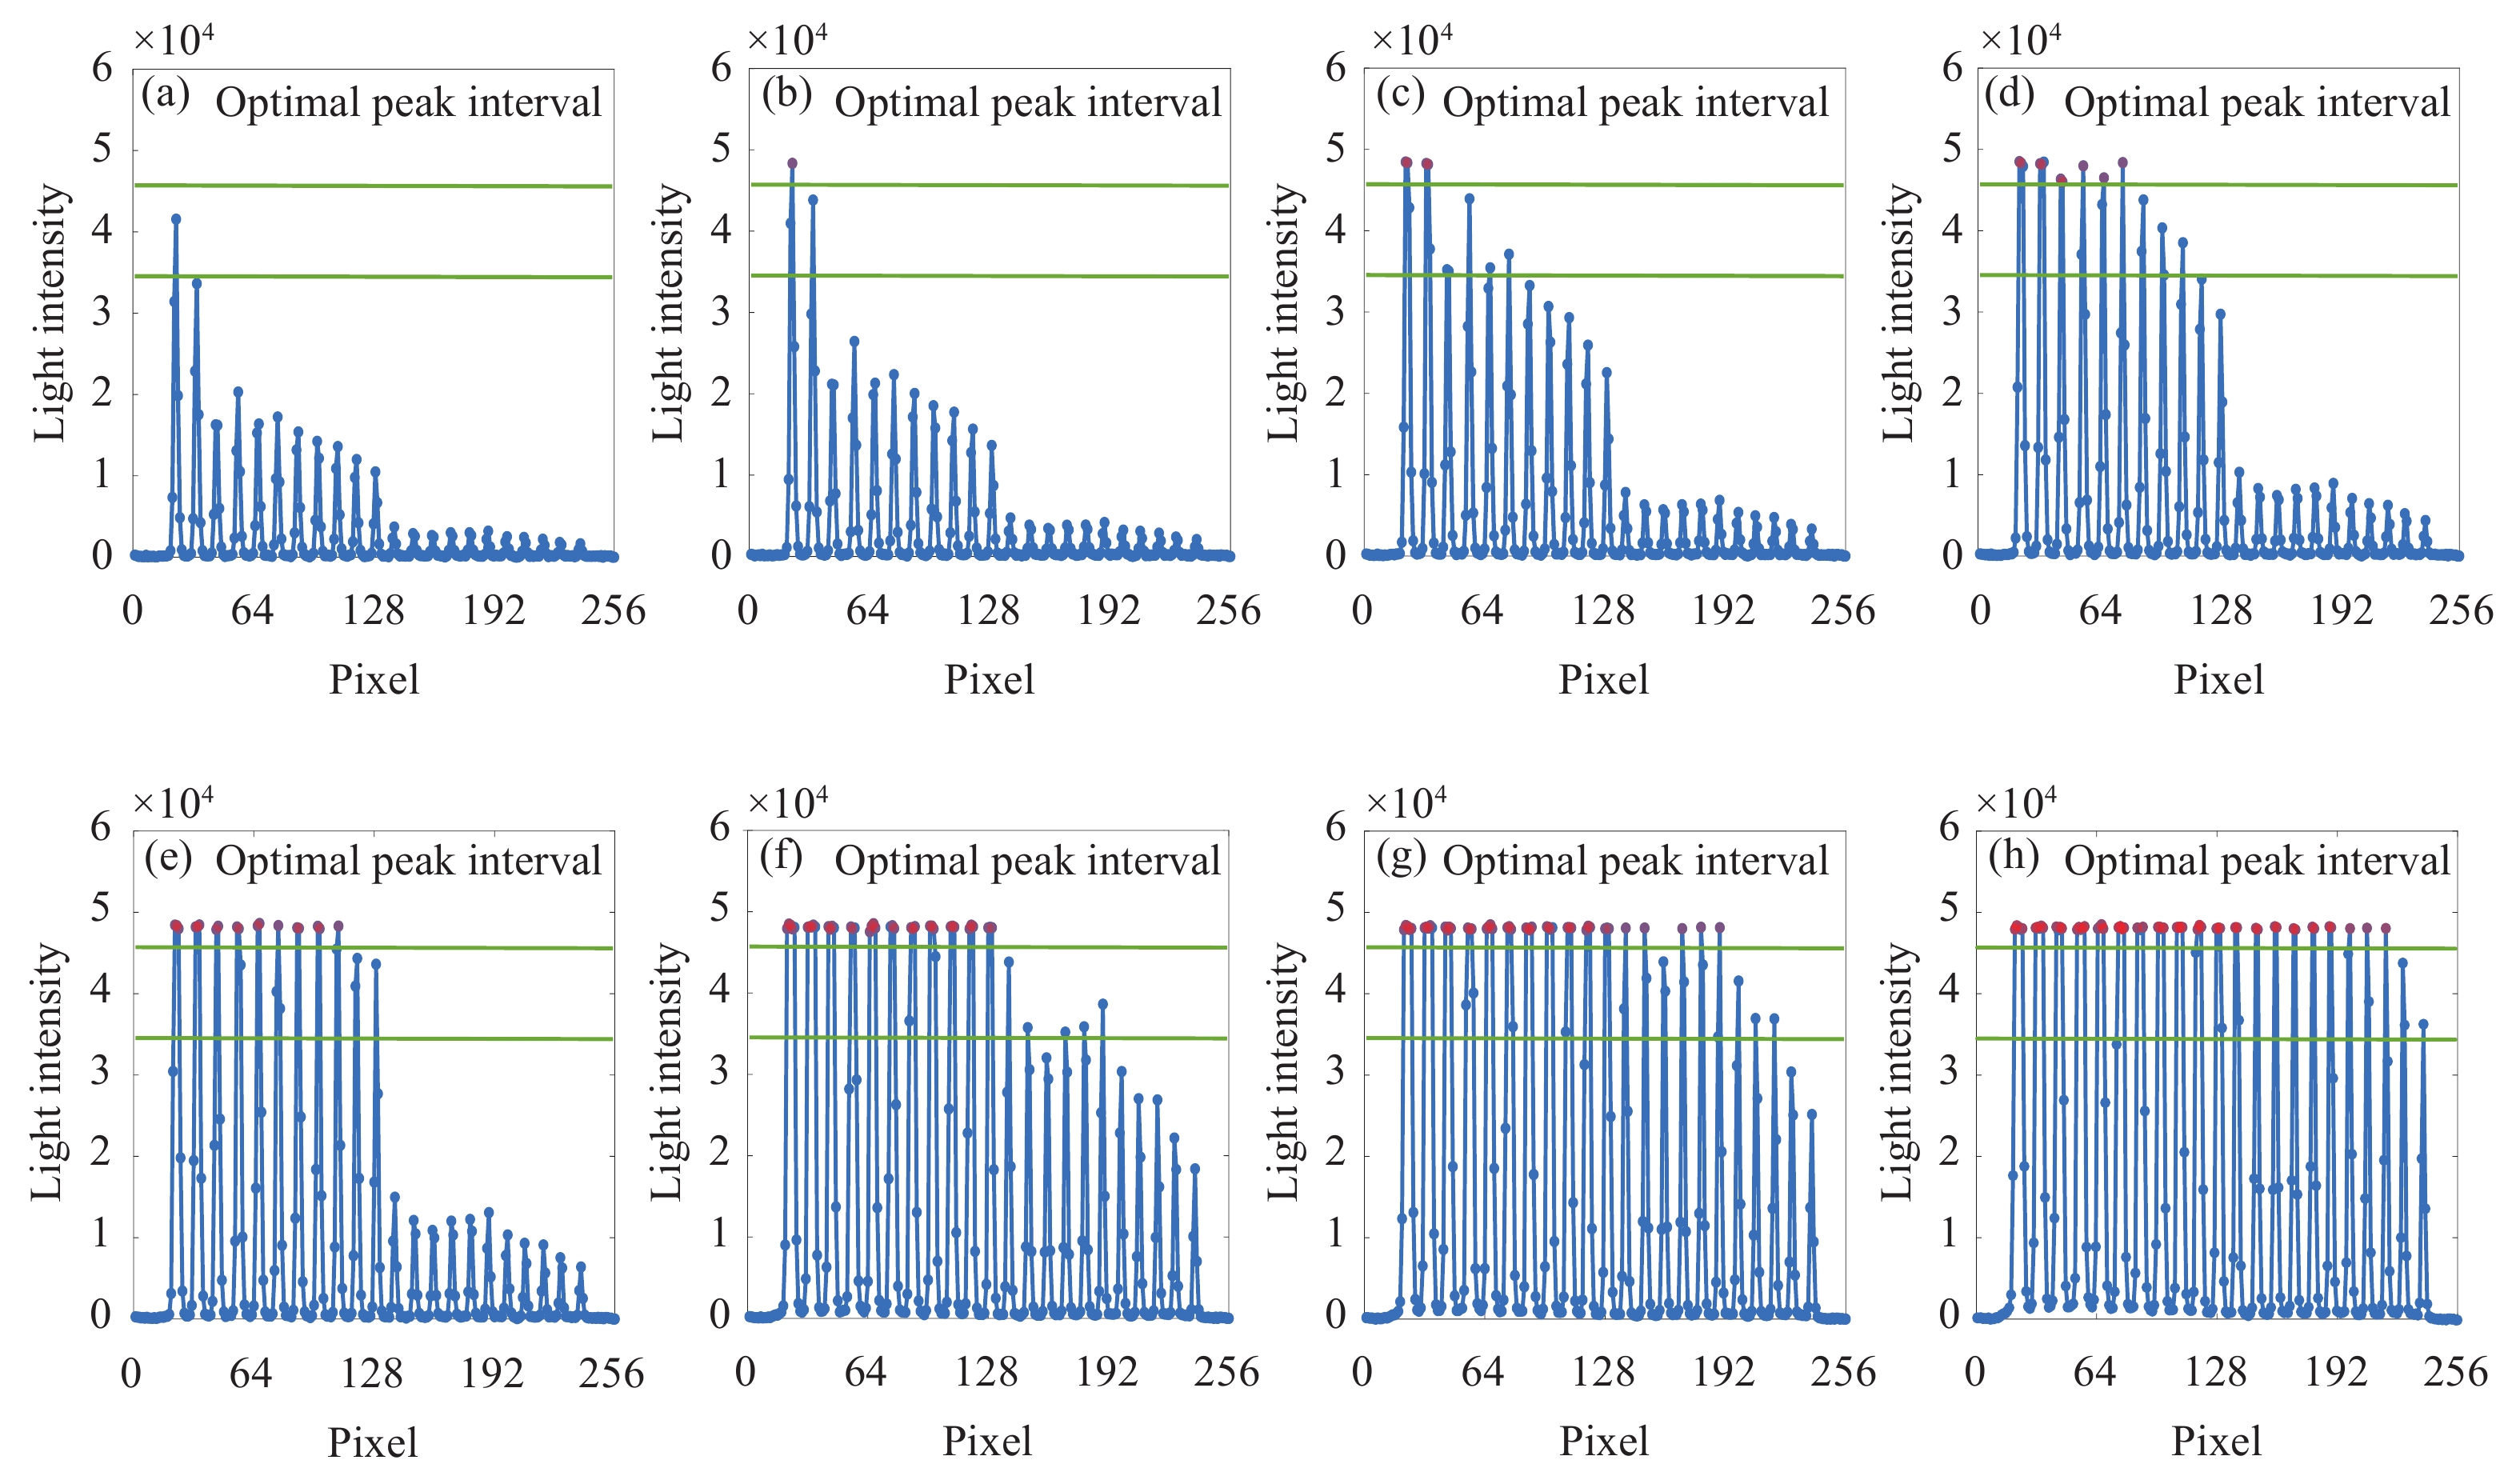
该实验选取具有22个光栅的光纤传感器,由于在光路中产生了损耗,所以导致光谱强度严重不一致,光谱如图8(a)所示。根据图7所示的谱峰峰值与中心波长标准差的关系可知,图8(a)所示光谱图中后11个谱峰的峰值在5 000以下,产生了光强衰减的现象,严重影响了寻峰的稳定性。利用文中提出的自适应解调算法对光谱多次调节,结果如图8所示。
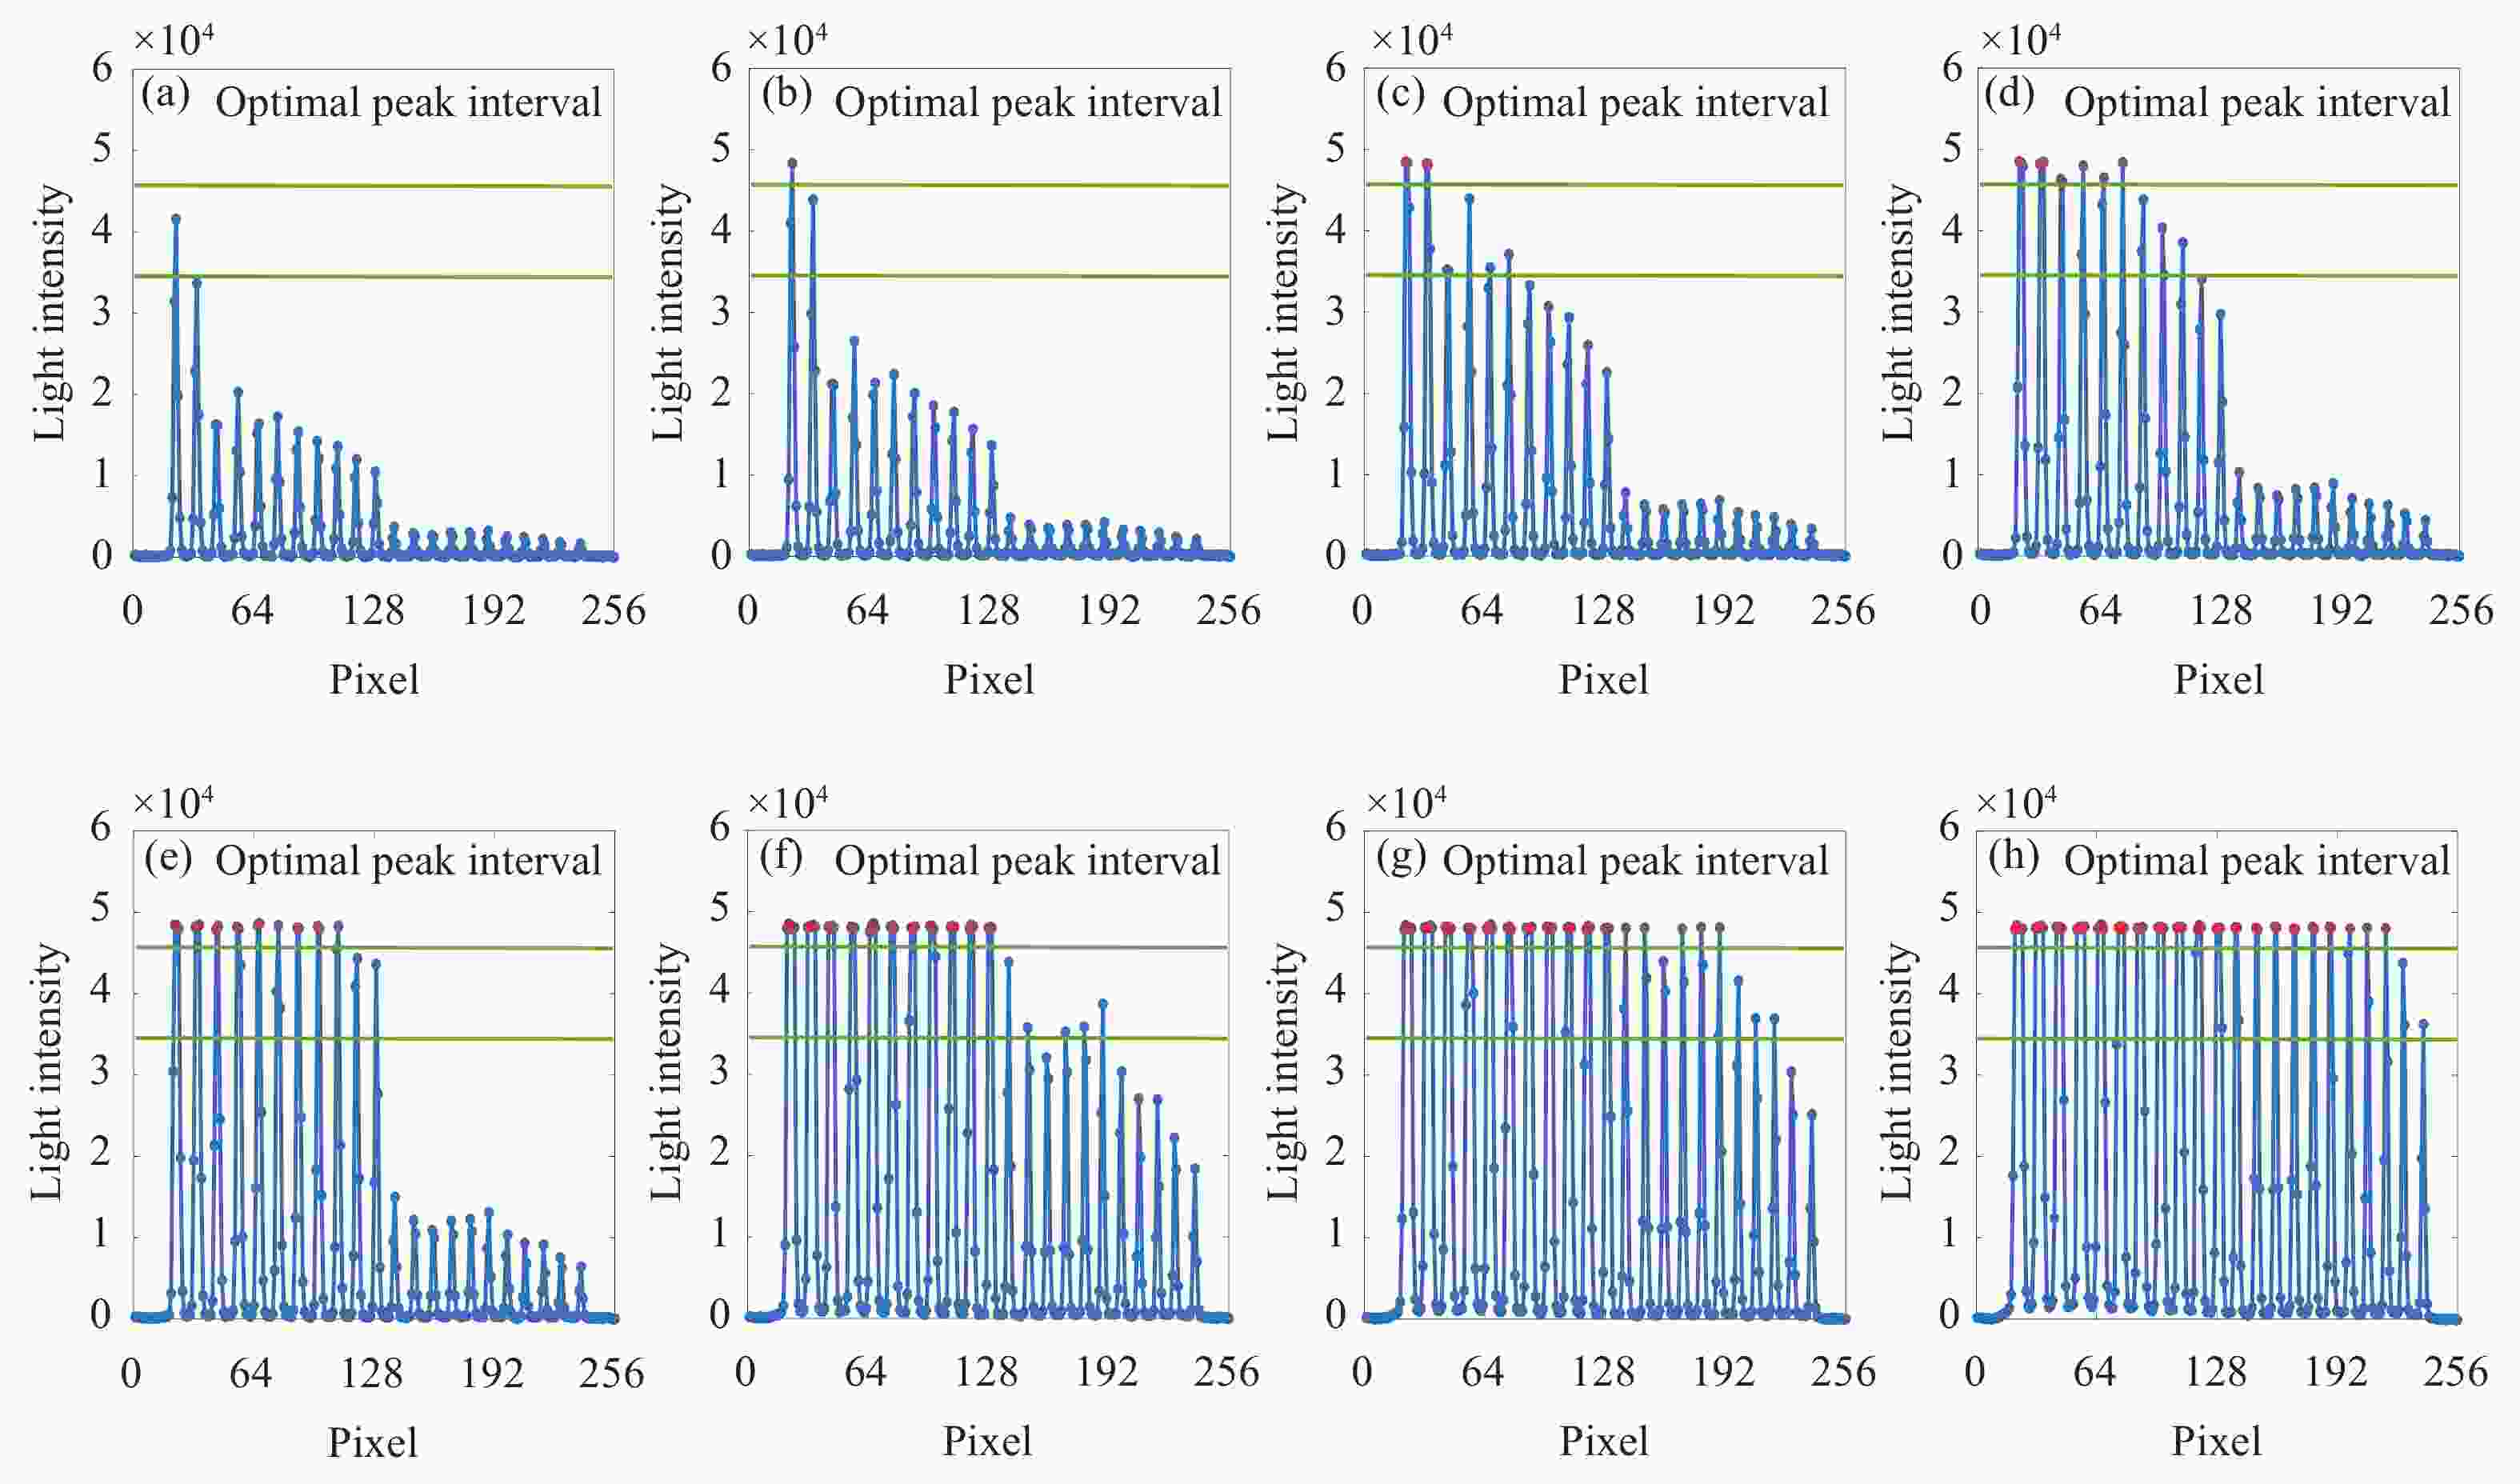
Figure 8. Adaptive demodulation spectrogram. (a) Exposure cycle/100 ns:234.4; (b) Exposure cycle/100 ns:304; (c) Exposure cycle/100 ns:503.1; (d) Exposure cycle/100 ns:659.6; (e) Exposure cycle/100 ns:967.2, (f) Exposure cycle/100 ns:2832.6; (g) Exposure cycle/100 ns:3881.2; (h) Exposure cycle/100 ns:5562.8
在对光谱自适应解调之前,首先求出光谱的饱和值,即用曝光周期上限值对光谱解调,可以得到光谱的饱和值为48380;然后根据70%~90%的最优峰值区间范围划定峰值区间,认为峰值超过饱和值90%的谱峰为不稳定谱峰;再根据自适应解调算法求出剩余谱峰中最高峰达到最优峰值区间的曝光周期,结果如表3所示。
Adjustment order Exposure cycle/100 ns Spectral peak number for each demodulation Peak/saturation value 1 234.4 1# 85.90% 2 304.0 2# 89.05% 3 503.1 3#, 4#, 5#, 6# 72.74%, 89.70%, 73.22%, 76.68% 4 659.6 7#, 8#, 9# 88.47%, 83.36%, 79.59% 5 967.2 10#, 11# 89.61%, 88.13% 6 2 832.6 12#, 13#, 15#, 16#, 17# 88.52%, 73.87%, 72.71%, 74.07%, 79.82% 7 3 881.2 14#, 18#, 19#, 20# 88.75%, 85.88%, 76.35%, 76.28% 8 5 562.8 21#, 22# 87.52%, 75.02% Table 3. Experimental results of adaptive demodulation algorithm
以表3中的曝光周期分别曝光解调,图8中(a)~(h)为每次解调得到的光谱图。该实验共经过八次曝光解调,每次只取峰值位于最优峰值区间内的解调结果,避免了不稳定谱峰的解调结果。图8中超出最优峰值区间的谱峰,属于不稳定谱峰,会严重影响寻峰的稳定性。实验结果如表3所示,解调得到的谱峰峰值均位于饱和值的70%~90%的最优峰值区间,寻峰得到的中心波长标准差在0.5 pm以内,寻峰稳定性比单次曝光解调提高了50%。程序运行时间为74.422 ms,可以满足快速解调的要求。
-
对于光纤光栅链路反射谱强度不一致时的解调,文中提出利用多次曝光解调的方法自适应调整曝光周期,利用光谱直方图自适应调整寻峰阈值。不仅实现了低强度谱峰的识别,还保证了寻峰的稳定性。
通过探究光谱峰值与曝光周期关系的实验,发现光谱的峰值和曝光周期之间存在线性关系y=kx+b,并且发现,寻峰的稳定性与谱峰峰值有很大关系,谱峰峰值在谱峰饱和值70%~90%的区间范围内,寻峰稳定性最高,在此区间内寻峰,能够保证中心波长标准差在0.5 pm以内,解调稳定性提高了50%,并且算法运行时间在100 ms以内,可以实现快速解调。
Adaptive demodulation of reflection spectrum intensity of fiber grating link
doi: 10.3788/IRLA20200440
- Received Date: 2021-11-03
- Rev Recd Date: 2022-02-27
- Available Online: 2022-06-08
- Publish Date: 2022-06-08
Fund Project:
National Natural Science Foundation of China (61903042);Beijing Natural Science Foundation(4194077);Supported by the Subject Innovation and Intellectual Introduction Program of Higher Education(D17021)
-
Key words:
- optical fiber sensing /
- spectral intensity /
- exposure cycle /
- peak-seeking threshold /
- adaptive demodulation algorithm
Abstract: In view of the large difference in the intensity of single channel multi-grating reflection spectrum of demodulator, which leads to the failure of peak-seeking or the increase of peak-seeking error, a method of multiple exposure demodulation in different exposure cycles was proposed to adjust the peak value, and the peak-seeking threshold was determined according to the histogram of the spectral data. The influence of peak value of spectrum on the stability of peak-seeking was analyzed, the adaptive adjustment rules of exposure cycle and peak-seeking threshold were established, and the adaptive peak-seeking demodulation algorithm was realized by LabVIEW software. Through the actual fiber grating sensor test, the automatic exposure and peak-seeking demodulation of the reflection spectrum with large difference could be completed. On the premise of ensuring the peak-seeking stability, the number of spectral peak identification, the adaptive ability of the demodulation system and the working reliability were effectively improved. The experimental results show that the peak stability is the highest when the peak value is in the range of 70%-90% of the saturation intensity. The standard deviation of the center wavelength obtained by peak-seeking is within 0.5 pm, the stability is increased by 50% compared with single exposure demodulation, and the program running time is within 100 ms, which can realize fast demodulation.


 DownLoad: