


-
光谱成像技术将成像技术和光谱技术相结合,可以同时探测目标的二维几何空间和一维光谱信息,具有图谱合一的优势。宽波段的光谱成像系统(0.4~1.7 μm )在食品[1~2]、农业[3~4]、医学[5~6]、刑侦[7~8]等领域具有更大的优势。光栅是宽波段光谱成像系统的主流分光元件,但在光栅型宽波段光谱成像系统中存在着多级次衍射光谱相互串扰的问题,严重影响了成像光谱的质量。为了得到性能良好的光谱成像系统,必须对其多级次衍射带来的杂散光进行分析及抑制。
目前,国内外对于光谱成像系统的多级次衍射杂散光抑制进行了广泛的研究。2014年,美国喷气推进实验室利用带通滤光片对立方体卫星成像光谱仪(0.4~1.7 μm)中多级次衍射杂散光进行了抑制[9];2021年,美国罗切斯特大学利用狭缝和多个带通滤光片对立方体卫星成像光谱仪(0.4~1.7 μm)中多级次衍射光谱杂散光进行了抑制[10];2015年,中国科学院安徽光学精密机械研究所利用百叶挡光板和杂光收集器对中红外平面光栅光谱仪(8.04~13.96 μm )多级次衍射杂散光进行分析及抑制,最大杂光系数降低至1.3%[11];2016年,中国科学院通用光学与表征技术重点实验室利用长波通滤光片和短波通滤光片对平板波导光栅光谱仪(8~12 μm)多级次衍射杂散光进行分析及抑制,最大杂光系数降低至0.033%[12]。总的来看,现有研究要么给出了多级次衍射杂散光抑制结果,缺少对多级次衍射杂散光的分析与认识;要么所研究的系统波段范围不属于宽波段范畴。
文中从平面典型的Schwarzschild结构光栅型宽波段光谱成像系统出发,使用TracePro软件深入分析了宽波段光谱成像系统多级次杂散光的来源,得出了其杂光类型主要有两种:一是由于长波长多级衍射光在光路内多次反射和衍射与短波长光谱通道交叠导致;二是由于短波长多级次衍射与长波长光谱通道交叠导致;然后基于仿真分析得到的多级次衍射杂散光路径,分别设计了分区域滤光片和线性渐变带通滤光片用于多级次杂散光抑制,并对它们的抑制效果进行评价。
-
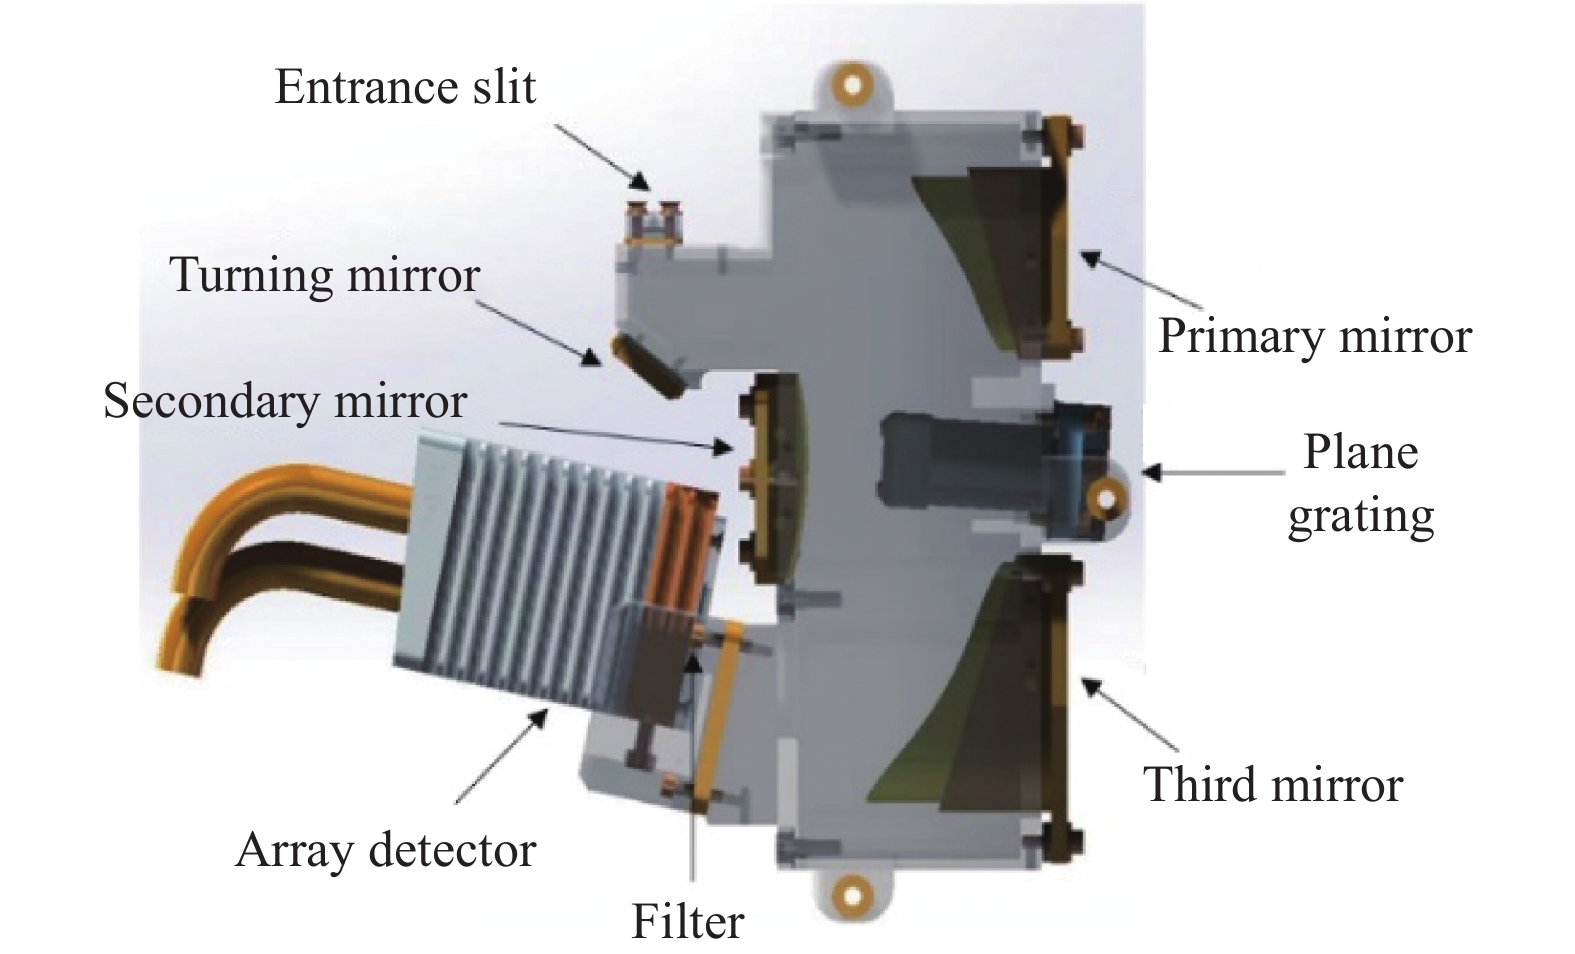
图1为典型的Schwarzschild结构平面光栅型宽波段光谱成像系统光路图,包括入射狭缝、转折镜、主镜、次镜、平面光栅、三镜和阵列探测器,其中主镜、次镜和三镜均采用自由曲面反射镜,实现了紧凑型的光路。宽波段光谱成像系统三维图如图2所示,系统主要设计参数如表1所示,探测器的特性参数如表2所示。

图 1 光学系统光路图
Figure 1. Optical path diagram of optical system

图 2 宽波段光谱成像系统三维图
Figure 2. 3D diagram of a broad band spectral imaging system
表 1 光学系统设计参数
Table 1. Design parameters of optical system
Parameter Value Spectral range 0.4-1.7 F/# 3.2 Spectral sampling interval/nm 2.6 Magnification 1∶1 Slit W×H/mm2 12.8×0.02 Diffraction order k −1 表 2 探测器特性参数
Table 2. Detector characteristic parameters
Parameter Value Detector type InGaAs Number of pixels 640×512 Spectral response/μm 0.4-1.7 Detector pixel size/μm2 20×20 Quantum efficiency >80% (peak) -
光机系统杂散光分析一般采用蒙特卡洛非序列光线追迹的方法。TracePro是一个基于实体模型的光学分析软件,是杂散光分析的主流软件。文中选用TracePro软件来实现对宽波段光谱成像系统的仿真分析,光学仿真流程如图3所示。

图 3 TracePro软件光学仿真流程
Figure 3. TracePro software optical simulation process
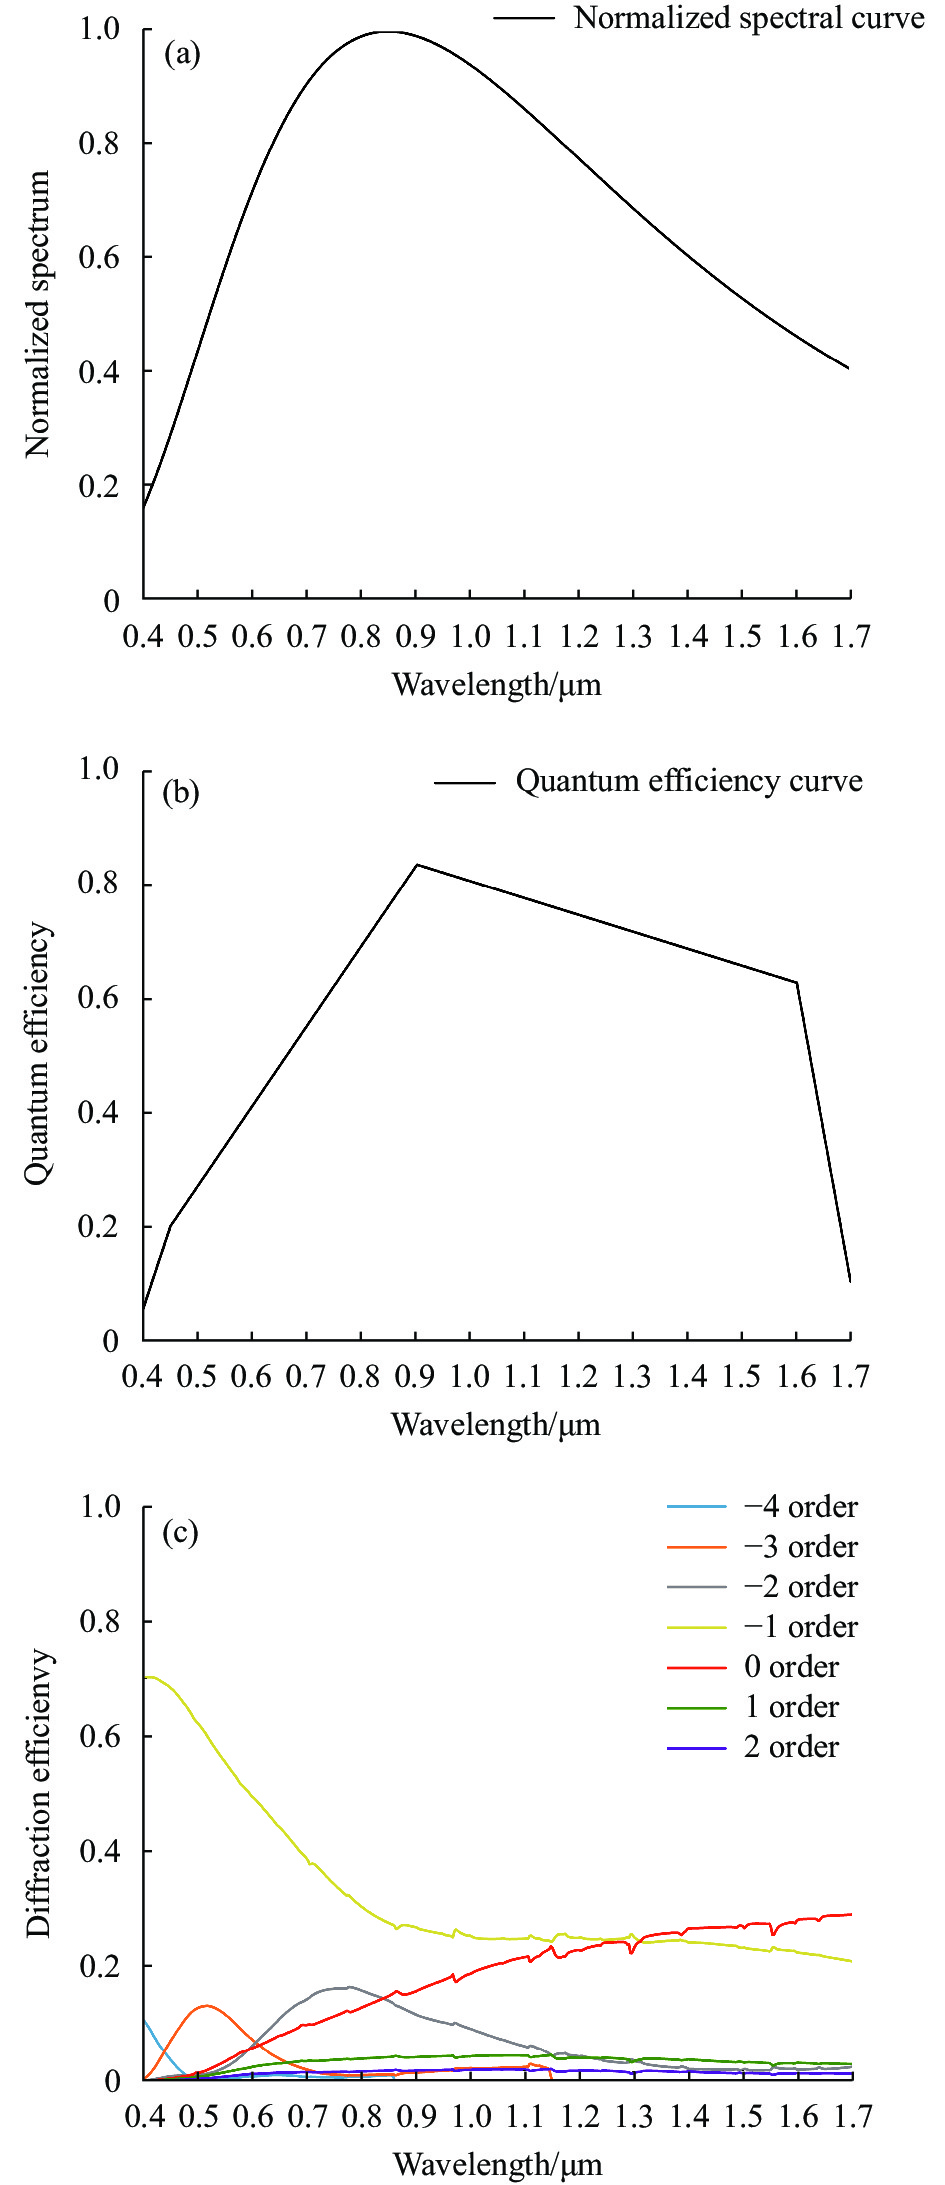
在TracePro中建立三维模型有两种方式:一种是使用TracePro软件中布尔运算建立三维模型;另一种是导入其他三维软件建立好的三维模型。文中使用Solidworks软件建立光机系统三维模型,然后将光机系统模型导入到TracePro软件中,接着在TracePro软件中设置光机结构与光学元件的表面和材料属性。在该光机系统中,反射镜表面属性设置为98%反射、2%吸收,光谱仪框架表面属性设置为90%吸收、10%朗伯散射,光源采用3400 K卤钨灯作为光源。光源的归一化光谱曲线、探测器量子效率曲线和光栅各个级次的衍射效率曲线如图4所示。
系统中选用格点光源的光源模型,光源尺寸为狭缝尺寸,放置在狭缝位置,其发散角为18.4°,波长范围为0.4~1.7 μm ,光线数量为2000000。最后使用蒙特卡洛算法进行光线追迹,对宽波段光谱成像系统多级衍射杂散光进行分析。
引入杂散光系数
$ \mathrm{\gamma } $ 来评价系统杂散光抑制能力。杂散光系数定义式为:$$ \gamma =\frac{{E}_{0}}{E} $$ (1) 式中:
$ {E}_{0} $ 为像面上杂散光的照度;$ E $ 为像面上信号光和杂散光的总照度。
图 4 (a)光源归一化光谱曲线;(b)探测器量子效率曲线;(c)光栅各个级次的衍射效率曲线
Figure 4. (a) Normalized spectral curve; (b) Detector quantum efficiency curve; (c) Diffraction efficiency curves of grating orders
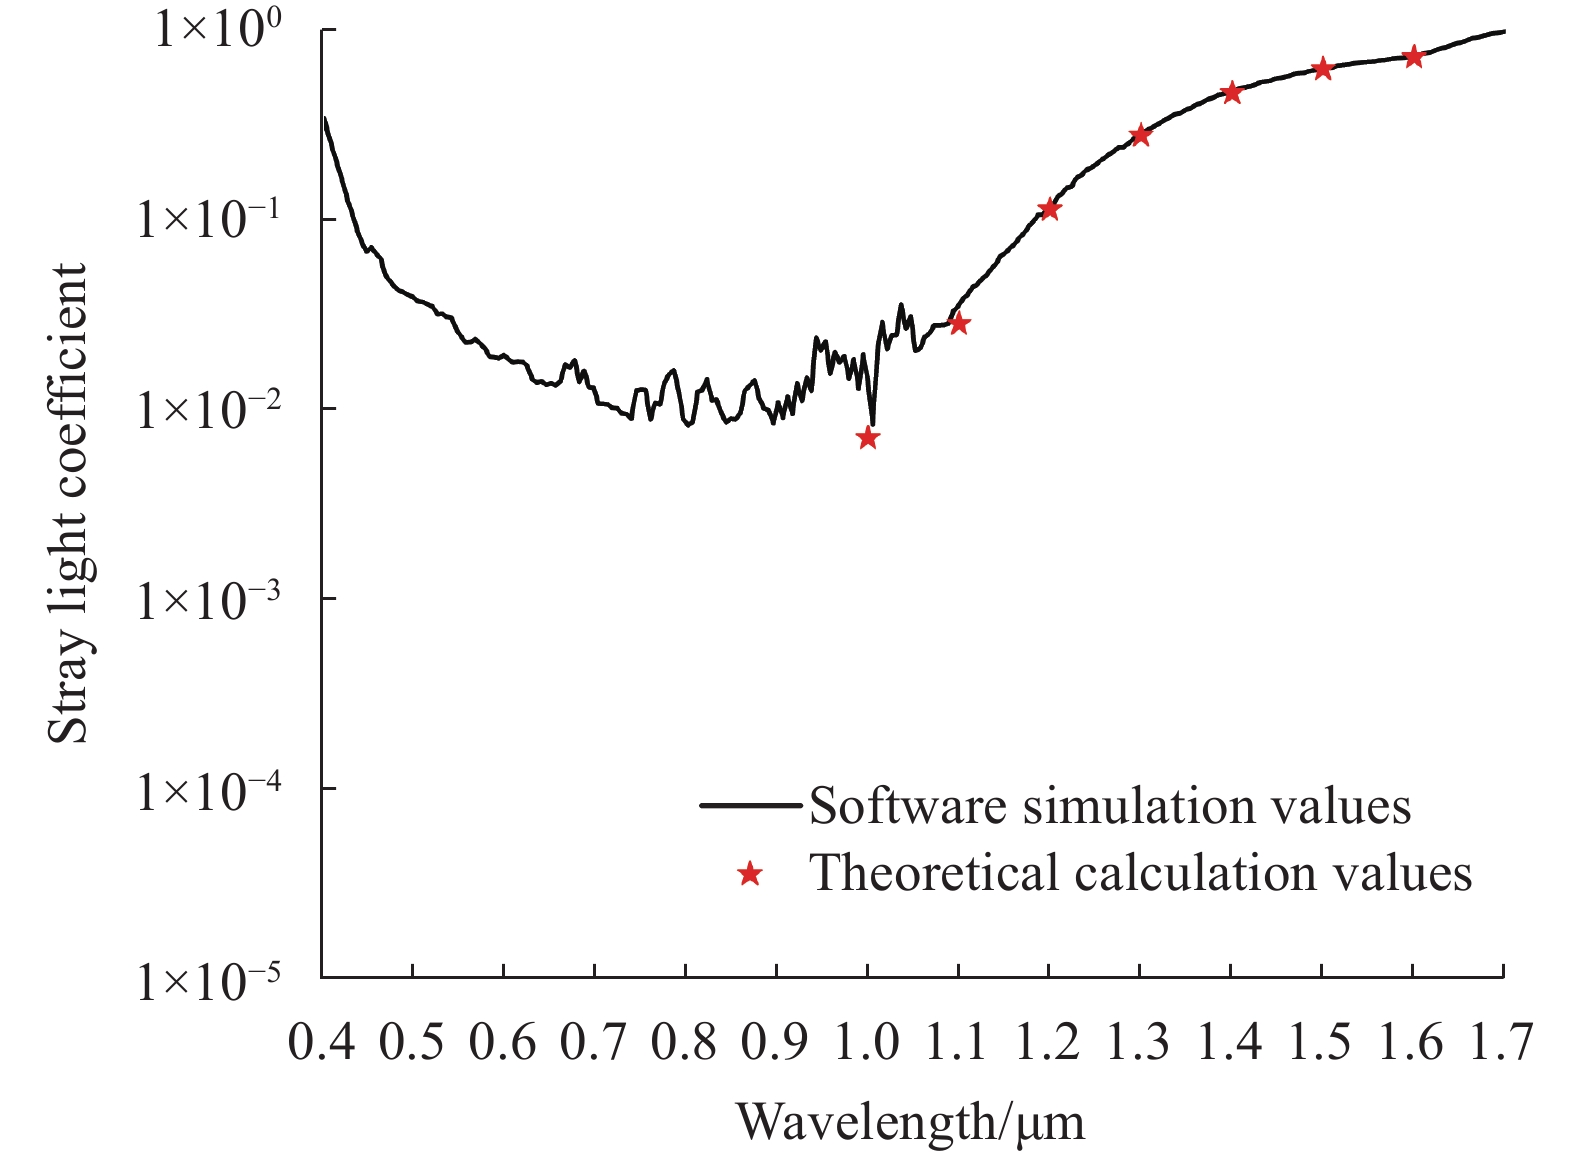
基于公式(1)理论计算得到系统由多级次衍射导致的杂散光系数如表3所示。基于TracePro软件光线追迹得到系统各个波段的杂散光系数如图5所示,理论计算结果与软件仿真结果相吻合。
图 5 系统杂散光系数
Figure 5. Stray light coefficient of the system
表 3 归一化光源能量下的理论信号能量、杂散光能量及杂散光系数
Table 3. Theoretical signal energy at normalized light source energy, stray light energy and stray light coefficient
Wavelength/
μm−1 order −2 order −3 order −4 order Stray light
coefficient1.0 0.1735 0.0011 - - 0.0063 1.1 0.1502 0.0041 - - 0.0266 1.2 0.1320 0.0157 0.000019 - 0.1064 1.3 0.1131 0.0383 0.0012 - 0.2588 1.4 0.0922 0.0640 0.0060 - 0.4316 1.5 0.0737 0.0862 0.0134 - 0.5747 1.6 0.0597 0.0979 0.0194 0.0008 0.6642 从图5中可以看出,在0.4~0.6 μm和大于1.0 μm部分,系统杂散光系数非常高,杂散光系数最高达到0.91。为了探究这两个部分杂散光产生的原因,在0.4~0.6 μm和大于1.0 μm波段分别选择了一个特征波长进行分析。
在0.4~0.6 μm波段选择0.4 μm波长,通过光线追迹得知0.8 μm波长的光会到达0.4 μm波长的光谱通道,因此对0.8 μm波长进行光线追迹,得到光线传播路径图,如图6所示。光线从狭缝发出,经转折镜反射到主镜,然后经主镜反射到次镜,再经次镜反射到平面光栅上,经平面光栅+2级的衍射光入射到次镜,经次级再次反射回平面光栅,经平面光栅−2级次的衍射光再次入射到次镜,最后由次镜反射到三镜上,聚焦到探测器像面上。因此,短波波段杂散光主要是长波长多级衍射光在光路内多次反射和衍射与短波长光谱通道交叠,最终形成杂散光。
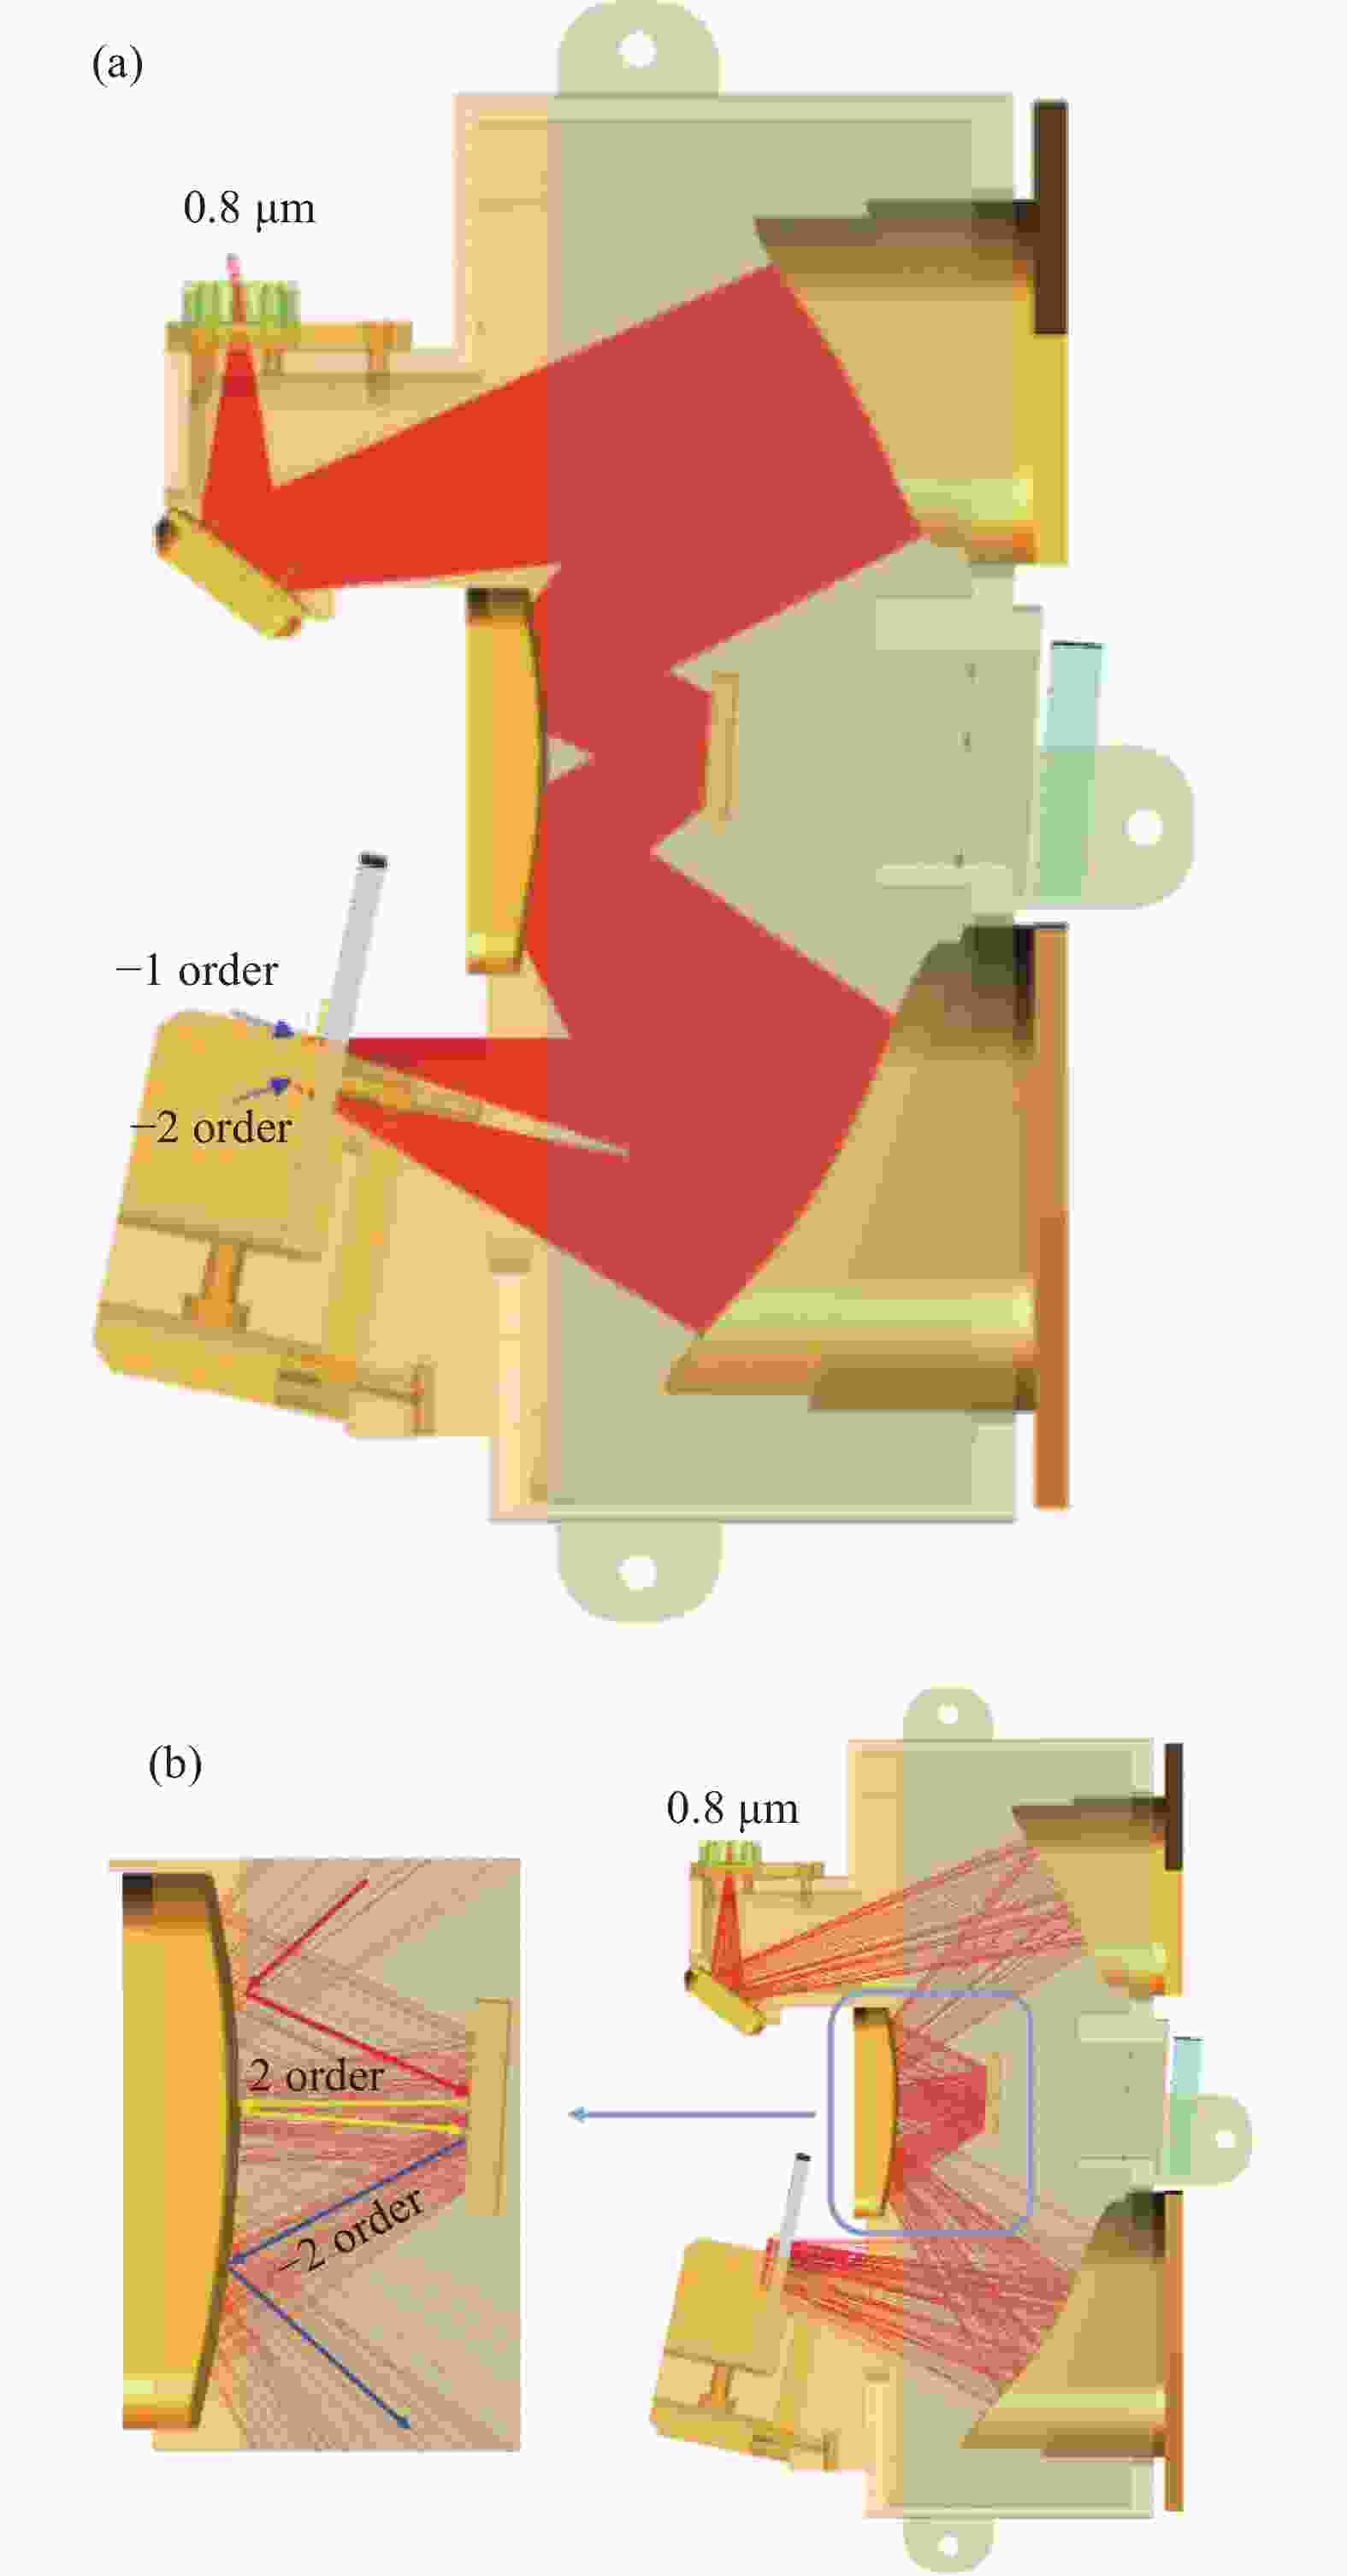
图 6 (a) 0.8 μm信号光传播路径;(b) 0.8 μm杂散光传播路径
Figure 6. (a) Signal light propagation path at 0.8 μm; (b) Stray light propagation path at 0.8 μm
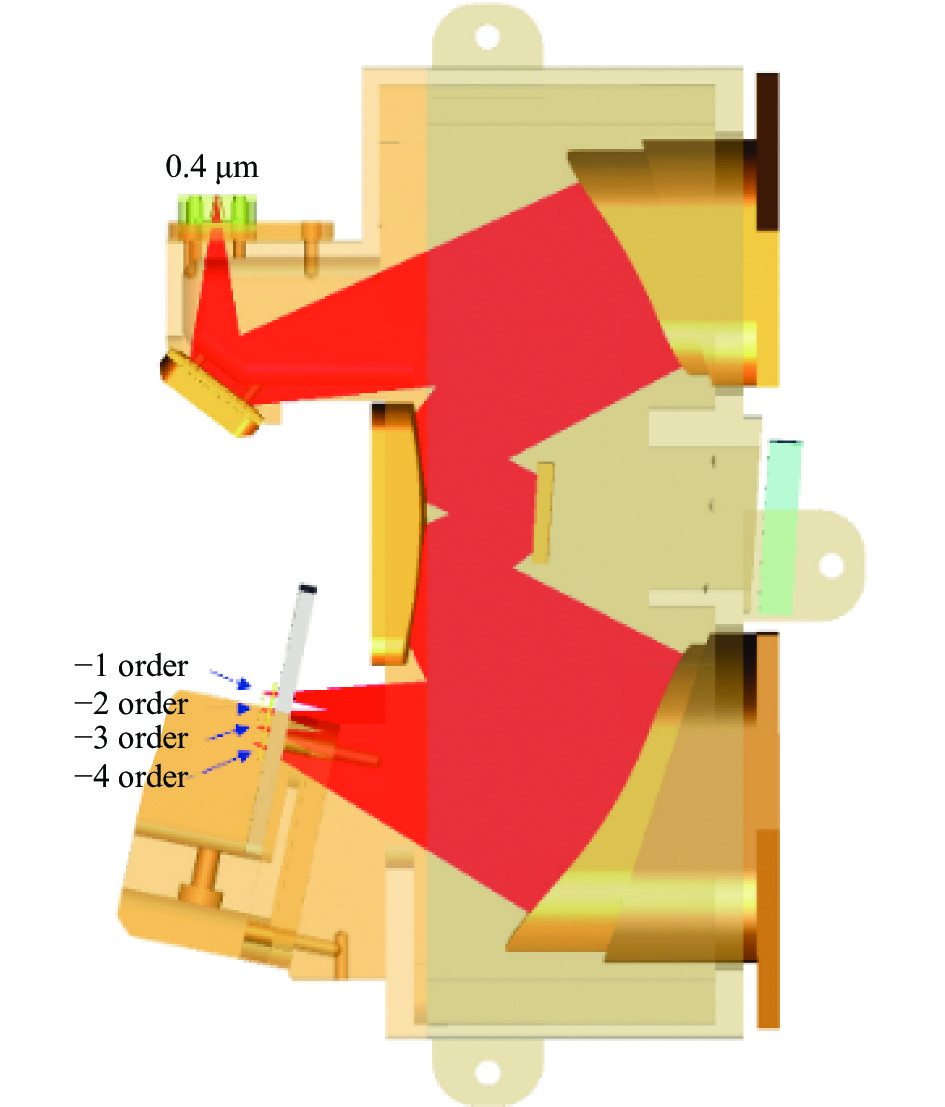
在大于1.0 μm波段选择1.6 μm波长,通过光线追迹得知0.4 μm的−4级次光,0.533 μm的−3级次光 ,0.8 μm 的−2级次光都会入射到1.6 μm的光谱通道。给出0.4 μm波长光线追迹图来示意多级次衍射光谱互相串扰的光线路径,如图7所示。对于0.4 μm波长,0.4 μm的−2级次光与0.8 μm的光谱通道重合,0.4 μm的−3级次光与1.2 μm的光谱通道重合,0.4 μm的−4级次光与1.6 μm的光谱通道重合。由此可知,长波段杂散光是由于短波长的多级次衍射光谱造成的。
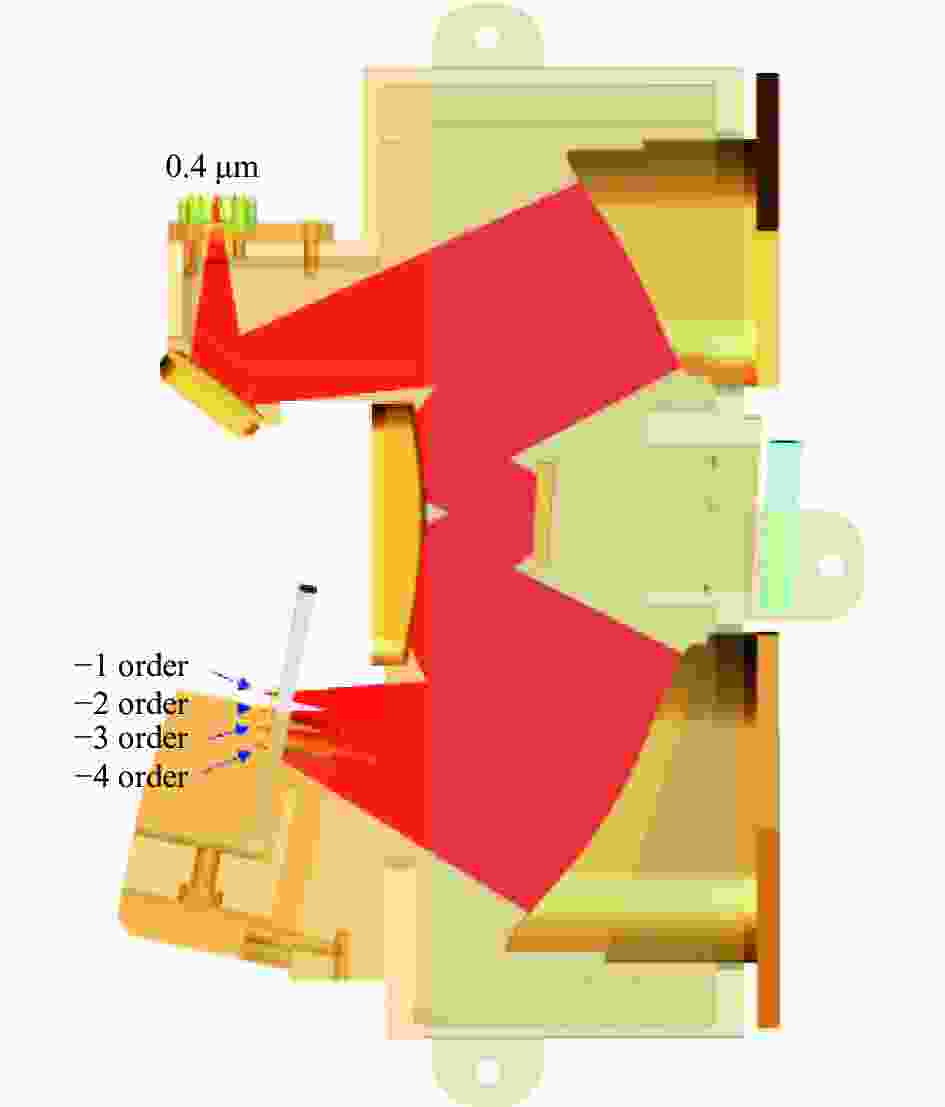
图 7 0.4 μm光线追迹图
Figure 7. Ray tracing at 0.4 μm
以上分析表明,宽波段光谱成像系统存在较为严重的多级次杂散光,因此需要对多级次衍射光谱采取抑制措施,降低系统杂散光系数。
-
基于上述仿真分析得到的结果,在不改变原有光学结构的基础上,提出利用滤光片来抑制多级次衍射杂散光的方法。滤光片可以让杂散光被反射和吸收,而让信号光通过,滤除非信号光。
-
分区域滤光片被分为I、II、III三个区域,如图8所示,区域I为0.8
$ \;\text{μm}\mathrm{后} $ 截止滤光片,区域II为0.6$ \;\text{μm} $ 前截止滤光片,区域III为0.95$ \;\text{μm} $ 前截止滤光片,杂散光仿真时通带透过率大于96%,带外截止为OD4。在设计每个区域滤光片宽度时,要考虑几个临界点: a点的目的是阻止0.4$ \;\text{μm} $ 的二级光谱通过,并且让0.6$ \;\text{μm} $ 之前的光都通过;c点的目的是阻止0.6$ \;\text{μm} $ 的二级光谱通过,并且让0.95$ \;\text{μm} $ 之前的光都通过;e点需要考虑0.4$ \;\text{μm} $ 波长,要让0.4$ \;\text{μm} $ 的光通过; f点需要考虑1.7$ \;\text{μm} $ 波长,要让1.7$ \;\text{μm} $ 的光通过;考虑加工公差, b点与a点重叠的宽度以及d点与c点重叠的宽度取0.5 mm。选取能够抑制高级次反射的短波通膜系为初始结构[13],利用Optilayer薄膜设计软件优化得到区域I滤光片;选取长波通截止滤光片膜系为初始结构,结合高反射带带宽展宽理论[14],设计得到区域II和区域III滤光片,如图9所示。三种滤光片设计透射率大于99%,截止深度大于OD4。分区域滤光片抑制高级次反射、确保截止带带宽和截止深度满足实际指标需求,会导致滤光片膜层分布极不规整、膜层总厚度较厚。在薄膜沉积时,往往需要采用晶振耦合光学监控膜厚控制策略来解决不规整膜层的制备问题。监控方式的切换会引入较大的系统误差。此外,膜层总厚度较厚会引入较大的随机误差累积。系统误差和随机误差累积相结合将严重影响滤光片通带透射率。结合以往带通滤光片制备经验、设备沉积误差以及optilayer软件误差分析结果,预估实际制备滤光片的通带透射率大于96%,截止带透过率小于0.01%,满足OD4的带外截止。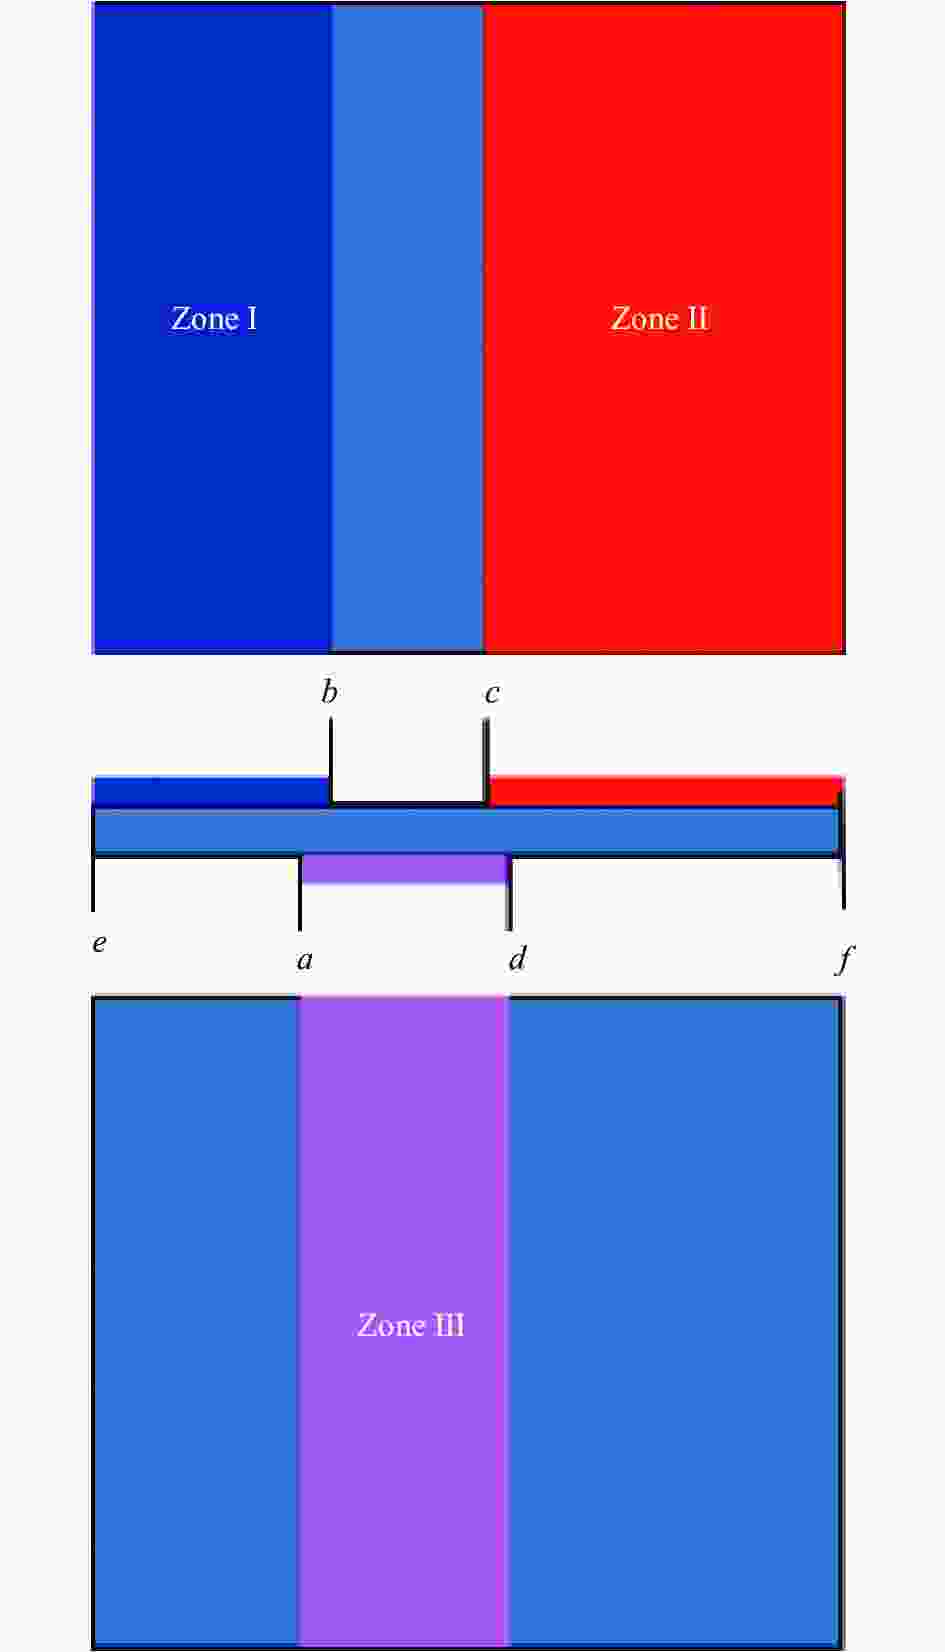
图 8 分区域滤光片
Figure 8. Sub-area filter
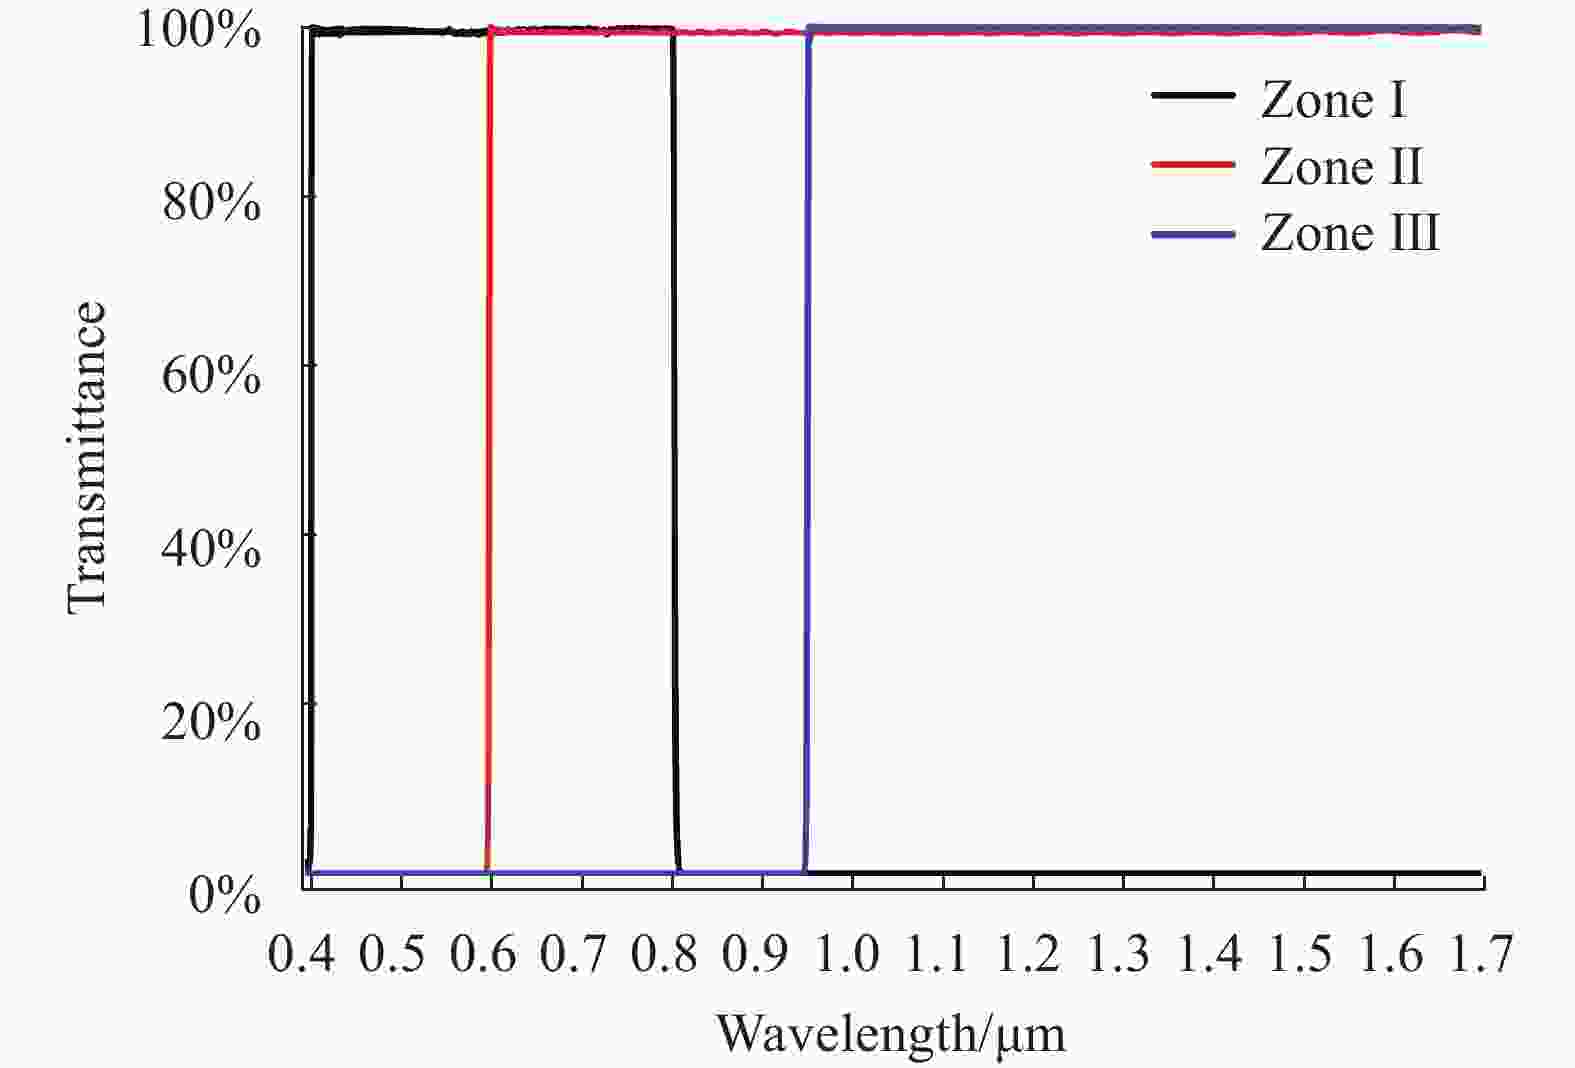
图 9 分区域滤光片光谱图
Figure 9. Spectrogram of the sub-area filter
基于光线追迹完成后探测器像面辐照度值,计算得到系统杂散光系数。加入分区域滤光片前后系统杂散光系数如图10所示。
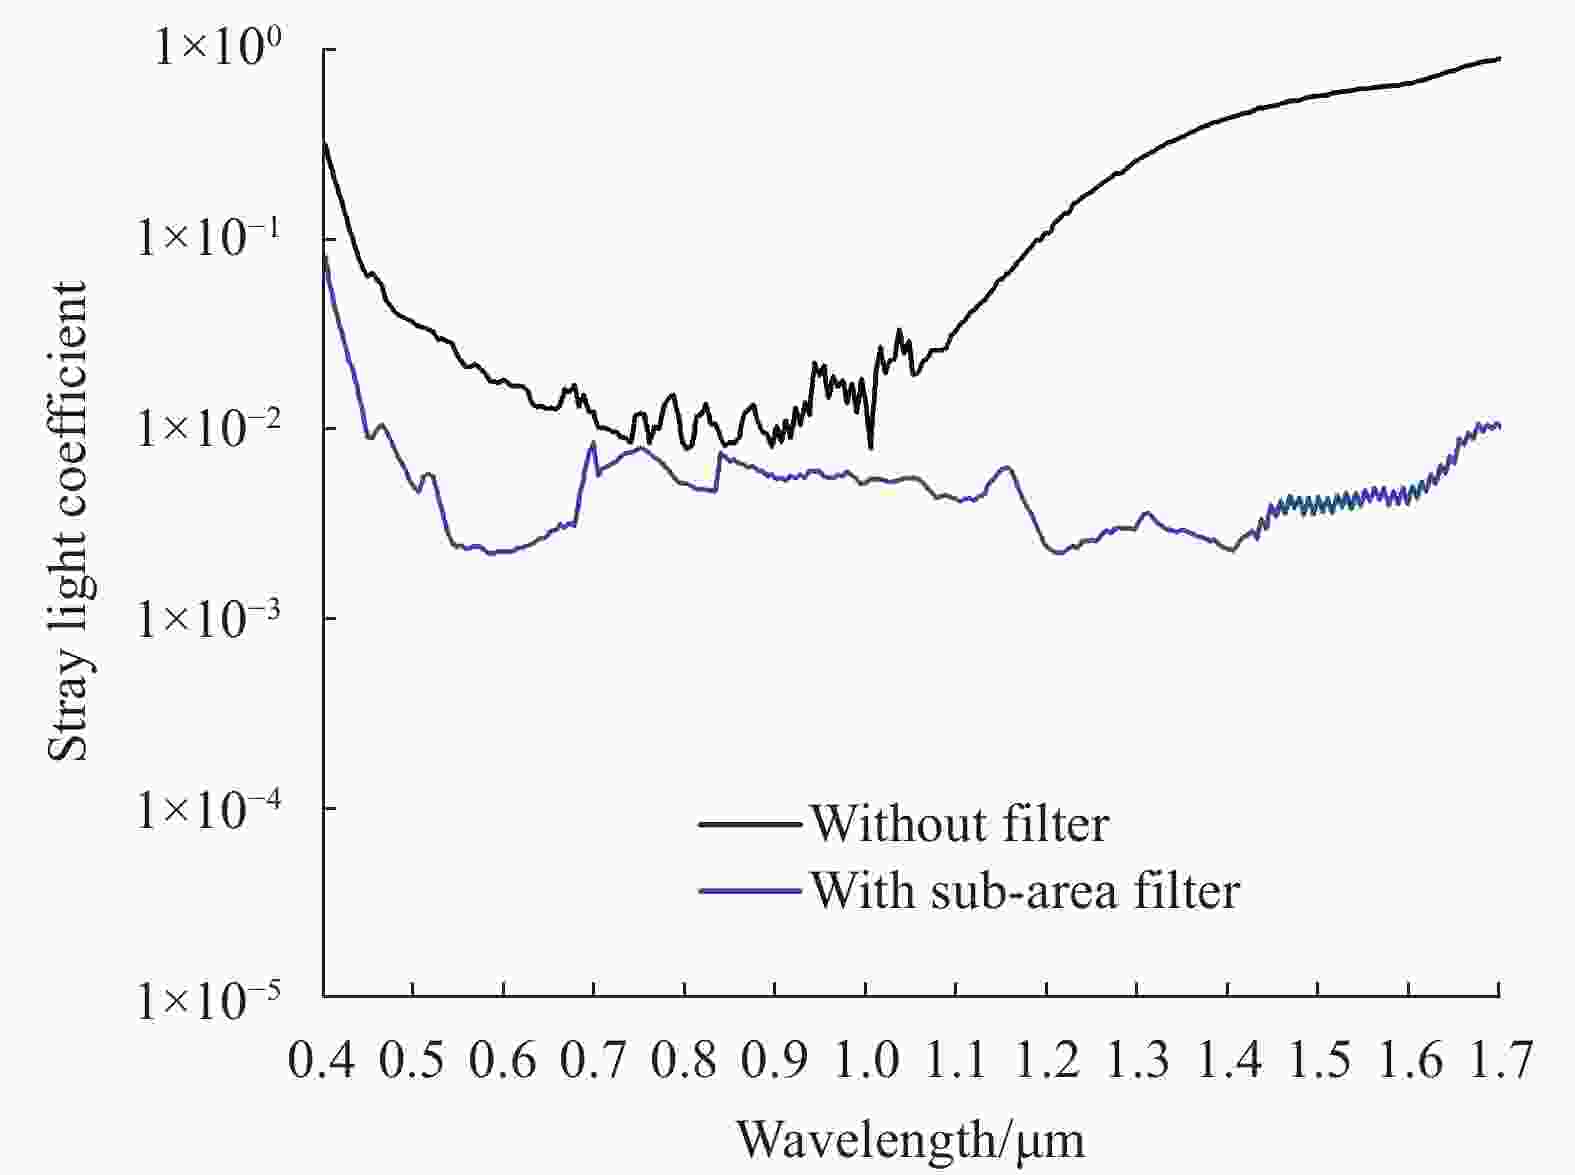
图 10 抑制前后系统杂散光系数
Figure 10. System stray light coefficient before and after suppression
从图10中可以看出,加入分区域滤光片后,杂散光系数明显降低, 长波杂散光得到了较好的抑制,最大杂散光系数为0.011,但在短波波段,杂散光还是较大,杂散光系数最大为0.0826。 因此,利用分区域滤光片只能抑制系统长波波段的杂散光,对于短波波段的杂散光没有进行有效的抑制,无法满足宽波段成像系统抑制多级次衍射杂散光的要求。
-
线性渐变滤光片是指光谱特性随滤光片位置线性变化,具有接近连续的光谱通道。利用该滤光片窄带通和中心波长渐变的特点,可通过在探测器前放置线性渐变带通滤光片来抑制系统杂散光[15]。如图11所示。滤光片材质为蓝宝石,杂散光仿真时通带透过率大于96%,带外截止为OD4。根据图12所示的Zemax软件中滤光片前表面光斑足迹图,可以确定滤光片上不同位置的通带起始波长和截止波长。滤光片上各个位置的起始波长和截止波长值如表4所示。选取能够抑制高级次反射的短波通膜系[13],叠加长波通、短波通截止滤光片结构,优化得到1.76
$ \;\text{μm} $ 带通滤光片,随后线性变化中心波长得到不同位置带通滤光片光谱,如图13所示,线性色散系数为0.12$ \;\text{μm} $ /mm。所有位置设计透射率均大于99%,结合范滨提出的渐变滤光片弧形掩膜版修正方法[16],可以按既定色散系数梯度制备薄膜,实现通带的渐变。线性渐变带通滤光片和分区域滤光片的制备过程类似,线性渐变带通滤光片也将面临膜层沉积系统误差和随机误差累积对光谱效率带来的负面影响。除此之外,由于空间位置不同而产生的膜厚均匀性差异以及高低折射率材料对弧形掩膜版的敏感度差异也会使滤光片通带效率发生变化。结合以往线性渐变滤光片制备经验、设备沉积误差和Optilayer软件误差分析结果,预估线性渐变滤光片的实际制备通带透射率大于96%,截止带透过率小于0.01%,满足OD4的带外截止。
图 11 线性渐变带通滤光片
Figure 11. Linear variable bandpass filter

图 12 滤光片前表面光斑足迹图
Figure 12. Footprint diagram on the front surface of the filter
表 4 滤光片上不同位置通带起始波长和截止波长
Table 4. The onset and cutoff wavelengths of the passband at different positions on the filter
Location/mm Onset wavelength/nm Cutoff wavelength/nm 4.741 430 520 4.461 500 610 3.780 560 700 3.139 630 790 2.497 700 880 1.854 770 970 1.210 840 1060 0.485 900 1140 –0.162 970 1230 –1.133 1040 1320 –1.783 1110 1410 –2.434 1180 1500 –3.128 1260 1590 –3.703 1320 1670 –4.362 1390 1760 –5.068 1470 1 850 –5.348 1500 1 890 –5.668 1540 1 930 
图 13 线性渐变滤光片光谱图
Figure 13. Spectrogram of the linear variable bandpass filter
基于光线追迹完成后探测器像面辐照度值,可以计算得到系统杂散光系数。加入线性渐变带通滤光片前后系统杂散光系数如图14所示。

图 14 抑制前后系统杂散光系数
Figure 14. System stray light coefficient before and after suppression
从图14中可以看出,加入线性渐变带通滤光片后,杂散光不仅在长波波段得到了抑制,在短波波段也得到了较好的抑制,杂散光系数降低至10−4量级。因此,利用线性渐变带通滤光片对宽波段光谱成像系统的杂散光进行抑制的方法可以满足系统使用要求。
-
文中研究了宽波段光谱成像系统多级次衍射杂散光问题,结果表明宽波段光谱成像系统杂光类型主要包括长波长多级衍射光在光路内多次反射和衍射和短波长多级次衍射两种;而采用分区域滤光片只能对长波长波段的杂散光进行有效的抑制,短波长波段的杂散光无法得到有效的抑制,需要采用线性渐变带通滤光片对全谱段的多级次衍射杂散光都进行抑制,可实现杂散光系数能够降低至10−4量级,满足宽波段光谱成像系统使用要求。文中的工作为光栅型宽波段光谱成像系统设计提供了理论依据,可用于高性能宽波段光谱成像系统。
Stray light analysis and suppression of broad-band spectral imaging system
-
摘要: 宽波段光谱成像系统(0.4~1.7 μm)在食品检测、农业生产、医学分析、刑事侦查等领域有广泛需求,光栅因其具有高色散本领和高环境稳定性的特点,成为宽波段光谱成像系统主流分光元件,但采用光栅分光的光谱成像系统存在多级次衍射光谱互相串扰问题,严重影响仪器的探测能力,为了得到准确的光谱信息,需对其进行有效的抑制。文中利用Tracepro光学分析软件对宽波段光谱成像系统的多级次衍射杂散光进行仿真分析,发展了利用分区域滤光片和线性渐变带通滤光片来抑制多级衍射杂散光的方法,并分析比较了它们对多级衍射杂散光的抑制效果。仿真分析结果表明:线性渐变带通滤光片能够有效地抑制多级次衍射带来的杂散光,光谱成像系统杂散光系数降低至10−4量级,满足宽波段光谱成像系统对杂散光抑制要求。Abstract:
Objective The greatest advantage of hyperspectral imaging technology over traditional detection technology is that it can record both spatial information and "fingerprint" spectral information of the observed target, with higher spectral resolution, higher detection capability, and can effectively identify and classify the target to be measured. With the development of hyperspectral imaging technology, the technology related to its core instrument, the Imaging Spectrometer, is also becoming more and more mature. Early developed Imaging Spectrometer are limited by the performance of spectroscopic devices, the band coverage is usually narrow. In order to achieve higher spectral coverage capabilities, multiple Imaging Spectrometer with completed stitching is usually needed, its volume and weight is large. Therefore, the study of a single broad-band spectral imaging system (0.4-1.7 μm) has important research significance. Grating has become the mainstream beam splitting element for broad-band spectral imaging systems because of its high dispersion capability and high environmental stability. The grating-based broad-band spectral imaging system suffers from the problem of crosstalk between multi-order diffraction spectra, which introduces serious stray light, which has a great impact on the performance of the optical system. Therefore, it is particularly important to carry out stray light analysis and suppression schemes for broad-band spectral imaging systems. Methods Starting from a typical Schwarzschild structured grating-type broad-band spectral imaging system (Fig.1), the stray light of the optical machine system was analysed using the Monte Carlo non-sequential ray tracing method, Tracepro software was chosen to implement the simulation analysis of the broad-band spectral imaging system (Fig.3). The system stray light was evaluated based on the simulation analysis results (Fig.5), the theoretical calculation of the system stray light was carried out (Tab.3), and the theoretical calculation matched the simulation results. Secondly, based on the stray light path of the system obtained from the simulation, the source of multi-order stray light of the broad-band spectral imaging system was analysed in depth. A scheme of adding filters is proposed to suppress multi-level diffracted stray light. Two types of filters are designed: a sub-area filter (Fig.8) and a linear gradient bandpass filter (Fig.11), respectively. Results and Discussions The stray light coefficient is significantly reduced after the addition of the sub-area filter, and the long-wave stray light is better suppressed with a maximum stray light coefficient of 0.011, but in the short-wave band, the stray light is still larger with a maximum stray light coefficient of 0.0826 (Fig.10). Therefore, the stray light in the long wavelength band can only be suppressed by using the sub-area filter, but the stray light in the short wavelength band is not effectively suppressed, which cannot meet the requirement of suppressing multi-order diffracted stray light in the broad-band imaging system. With the addition of a linearly graduated bandpass filter, stray light is not only suppressed at long wavelengths, but also at short wavelengths, and the stray light coefficient is reduced to the order of 10−4 (Fig.14). Therefore, the use of a linear gradient bandpass filter for the suppression of stray light in a broad-band spectral imaging system can meet the requirements of the system. Conclusions This paper analyzes the stray light problem of Schwarzschild structured planar grating type broad-band spectral imaging system. The analysis results show that there are two main types of stray light in broad-band spectral imaging system: one is the long wavelength multi-order diffracted light in the optical path multiple reflections and diffraction and short wavelength spectral channel overlap; the other is the short wavelength multi-order diffraction, adding linear gradient bandpass filter can effectively suppress the system multi-order diffracted stray light, which meets the requirements of broad-band spectral imaging system. The work of this paper provides a theoretical basis for the design of grating type broad-band spectral imaging system, and can be used for high-performance broad-band spectral imaging system. -
图 4 (a)光源归一化光谱曲线;(b)探测器量子效率曲线;(c)光栅各个级次的衍射效率曲线
Figure 4. (a) Normalized spectral curve; (b) Detector quantum efficiency curve; (c) Diffraction efficiency curves of grating orders
图 6 (a) 0.8 μm信号光传播路径;(b) 0.8 μm杂散光传播路径
Figure 6. (a) Signal light propagation path at 0.8 μm; (b) Stray light propagation path at 0.8 μm
图 10 抑制前后系统杂散光系数
Figure 10. System stray light coefficient before and after suppression
图 14 抑制前后系统杂散光系数
Figure 14. System stray light coefficient before and after suppression
表 1 光学系统设计参数
Table 1. Design parameters of optical system
Parameter Value Spectral range 0.4-1.7 F/# 3.2 Spectral sampling interval/nm 2.6 Magnification 1∶1 Slit W×H/mm2 12.8×0.02 Diffraction order k −1  下载: 导出CSV
表 2 探测器特性参数
Table 2. Detector characteristic parameters
Parameter Value Detector type InGaAs Number of pixels 640×512 Spectral response/μm 0.4-1.7 Detector pixel size/μm2 20×20 Quantum efficiency >80% (peak)
下载: 导出CSV
表 3 归一化光源能量下的理论信号能量、杂散光能量及杂散光系数
Table 3. Theoretical signal energy at normalized light source energy, stray light energy and stray light coefficient
Wavelength/
μm−1 order −2 order −3 order −4 order Stray light
coefficient1.0 0.1735 0.0011 - - 0.0063 1.1 0.1502 0.0041 - - 0.0266 1.2 0.1320 0.0157 0.000019 - 0.1064 1.3 0.1131 0.0383 0.0012 - 0.2588 1.4 0.0922 0.0640 0.0060 - 0.4316 1.5 0.0737 0.0862 0.0134 - 0.5747 1.6 0.0597 0.0979 0.0194 0.0008 0.6642
下载: 导出CSV
表 4 滤光片上不同位置通带起始波长和截止波长
Table 4. The onset and cutoff wavelengths of the passband at different positions on the filter
Location/mm Onset wavelength/nm Cutoff wavelength/nm 4.741 430 520 4.461 500 610 3.780 560 700 3.139 630 790 2.497 700 880 1.854 770 970 1.210 840 1060 0.485 900 1140 –0.162 970 1230 –1.133 1040 1320 –1.783 1110 1410 –2.434 1180 1500 –3.128 1260 1590 –3.703 1320 1670 –4.362 1390 1760 –5.068 1470 1 850 –5.348 1500 1 890 –5.668 1540 1 930
下载: 导出CSV
-
[1] Jödicke K, Zirkler R, Eckhard T, et al. High end quality measuring in mango drying through multi-spectral imaging systems [J]. Chem Engineering, 2020, 4(1): 8. doi: 10.3390/chemengineering4010008 [2] Qin J W, Chao K L, Kim M S, et al. Hyperspectral and multispectral imaging for evaluating food safety and quality [J]. J Food Eng, 2013, 118(2): 157-171. doi: 10.1016/j.jfoodeng.2013.04.001 [3] Arias F, Zambrano M, Broce K, et al. Hyperspectral imaging for rice cultivation: Applications, methods and challenges [J]. AIMS Agri Food, 2021, 6(1): 273-307. [4] Shen Guanghui, Cao Yaoyao, Liu Xin, et al. Identification of fusarium damaged kernels using near infrared hyperspectral imaging and characteristic bands selection [J]. Jiangsu Academy of Agricultural Sciences, 2021, 37(2): 509-516. (in Chinese) [5] Liu Zhi, Wang Hongjun, Li Qingli. Tongue tumor detection in medical hyperspectral images [J]. Sensors, 2012, 12(1): 162-174. [6] Alshammari Q A, Pala R, Barui A K, et al. The use of advanced spectral imaging to reveal nanoparticle identity in biological samples [J]. Nanoscale, 2022, 14(11): 4065-4072. doi: 10.1039/D1NR07551A [7] Zhao Xuejun, Huang Xiaochun, Wang Changliang, et al. Development of a wide range hyperspectral imager for evidence examination [J]. Spectroscopy and Spectral Analysis, 2020, 40(3): 674-678. (in Chinese) [8] 潘铭. 可见光多光谱和近红外高光谱成像技术显现潜在血迹的比较研究[D]. 北京: 中国人民公安大学, 2018. Pan Ming. Comparative study on visible multispectral imaging and near-infrared hyperspectral imaging to develop potential bloodstains[D]. Beijing: People’s Public Security University of China, 2018. (in Chinese) [9] Mouroulis P, Gorp B V, Green R O, et al. Optical design of a cubsat-compatible imaging spectrometer [C]//Proceedings of SPIE, 2014, 9222: 92220D. [10] Liu Yuxuan, Bauer A, Viard T, et al. Freeform hyperspectral imager design in a cubesat format [J]. Opt Express, 2021, 29(22): 35915-35928. doi: 10.1364/OE.439530 [11] Liu Yang, Fang Yonghua, Wu Jun, et al. Stray light analysis for a mid-infrared plane grating spectrometer system [J]. Infrared and Laser Engineering, 2015, 44(4): 1164-1171. (in Chinese) [12] Li Yangyu, Fang Yonghua, Li Dacheng, et al. Suppression of grating multiply diffracted light in planar waveguide spectrometer [J]. Infrared and Laser Engineering, 2016, 45(7): 0724001. (in Chinese) [13] 班超, 金秀, 赵帅锋, 等. 周期对称结构的抑制高级次反射短波通膜系滤光片: 中国, 202011183881.7[P]. 2021-01-15. [14] 唐晋发, 顾培夫, 刘旭, 等. 现代光学薄膜技术[M]. 杭州: 浙江大学出版社, 2006: 103-114. [15] Chen Xinhua, Li Bicen, Zhu Jiacheng, et al. Diffraction stray light analysis and elimination of VIS-IR imaging spectrometer based on multi-zone grating [J]. Acta Optica Sinica, 2021, 41(18): 1822003. (in Chinese) [16] Fan Bin, Li Gangzheng, Cheng Xinbin, et al. Production and measurement of linear variable filter [J]. Optical Instruments, 2006, 28(4): 95-103. (in Chinese) doi: 10.3969/j.issn.1005-5630.2006.04.020 -

 点击查看大图

计量
- 文章访问数: 166
- HTML全文浏览量: 50
- PDF下载量: 45
- 被引次数: 0


