


-
面对复杂多变的天气条件下提高目标精准定位与识别这一难题,利用红外探测技术与系统对目标进行精确探测、识别和追踪便凸显得尤为重要。现有对地面目标热特征及红外特征的研究大多都基于晴天条件[1-2],鲜有对阴雨天、雾天、雪天、结霜等天气条件下的研究。林群青[3]考虑雨雾与表面间的吸附、蒸发、凝结、冲刷换热等传热传质过程,将复杂的传热传质过程简化为目标表面均匀的对流换热系数,建立了雨雾条件表面的对流换热模型,评估了装甲车辆热辐射模型的可信度,研制了装甲车辆红外辐射特性计算集成软件。而在阴雨天气条件下,由于降雨与风速风向的共同作用,地面目标表面的降雨分布存在不确定性,地面背景为土壤或沥青等材料时存在着对空气中的水分及雨水的吸收与储存,而水分蒸发又会带来潜热影响,这些因素势必都会影响地面目标温度分布,从而影响目标表面热特征。
基于计算流体动力学的数值模型建立阴雨天气地面目标热模型,可以利用实测数据计算流体域温度、湿度和风速的空间及时间的分布,通过风驱雨模型计算降雨分布。风驱雨是利用降雨时刻的风速风向计算该时刻地面目标及背景表面降雨捕获率分布[4],在降雨发生的情况下,通常还伴随着风的作用,风驱雨(Wind-Driven Rain,WDR)是雨在下落过程中因受风力驱动影响而形成斜雨的一种自然现象[5]。目前风驱雨数值模型备受国内外研究人员青睐,且提出一系列数值模型[6-7]。黄生洪等人[8]提出基于欧拉多相流的方法,将离散的雨相与风相看成共同的连续相,通过质量守恒方程与动量守恒方程求解得到雨相轨迹,大大提高计算效率而被广泛使用。袁安[9]基于Open FOAM软件,利用欧拉多相流模型数值计算了一个立方体建筑物的风驱雨情况。采用目前大多数有关于风驱雨的研究仅仅集中于风驱雨的特征量(如捕获率)大小总结风驱雨的分布规律,没能给出降雨对地面目标热特征分布的影响,这就需要将风驱雨与表面耦合计算进行结合,直观地给出地面目标及背景的温度分布。
近年来相继有学者给出了湿热性耦合模型(HAM)分析。Franke等人[10]着眼于城市材料与空气温度和湿度之间的湿热关系,给出了简化模型的方法,但完全忽略了蒸发冷却过程。Kubilay等人[11]将地面街道考虑为多孔材料,提出了简化多孔材料为均匀潜通量进行简化,给出了三维湿热耦合模型,仅考虑了润湿后街道温度湿度随时间变化。Vujovi S等人[12]利用了湿热耦合模型中地面吸水、保水性、反射率对地面温度分布产生的影响。
前人已经对风驱雨模型及湿热耦合模型进行研究与验证,文中将利用两种模型,并综合考虑空气温度、相对湿度、风速风向、太阳辐射、降雨等自然环境因素,提出一种阴雨天气条件下,考虑风驱雨与湿热耦合的地面目标表面温度的计算模型,结合外场试验结果对模型方法进行验证,并计算分析阴雨天气条件下降雨强度、风向对地面目标的热特征的影响。
-
阴雨天气条件相比晴天天气条件,目标或背景的热边界上增加了由于降雨引起的一系列的传热传质方式。目标表面的热边界不仅包括太阳辐射、天空背景辐射、与空气的对流换热、自身辐射以及与地面的辐射换热,还包括了表面水分的潜热和显热换热;地面背景还包括了由于水分的径流引起的水分和热量的传输。图1为简单地面目标与地面背景在阴天及降雨天气条件下的热边界示意图。在阴雨天气条件下,风速风向、太阳辐射、降雨、浮力、空气温度和相对湿度都会影响三维空间内水分和热量的再分配,这就需要充分考虑外流场空气域内各种物理现象之间的相互作用,搭建集成计算模型。
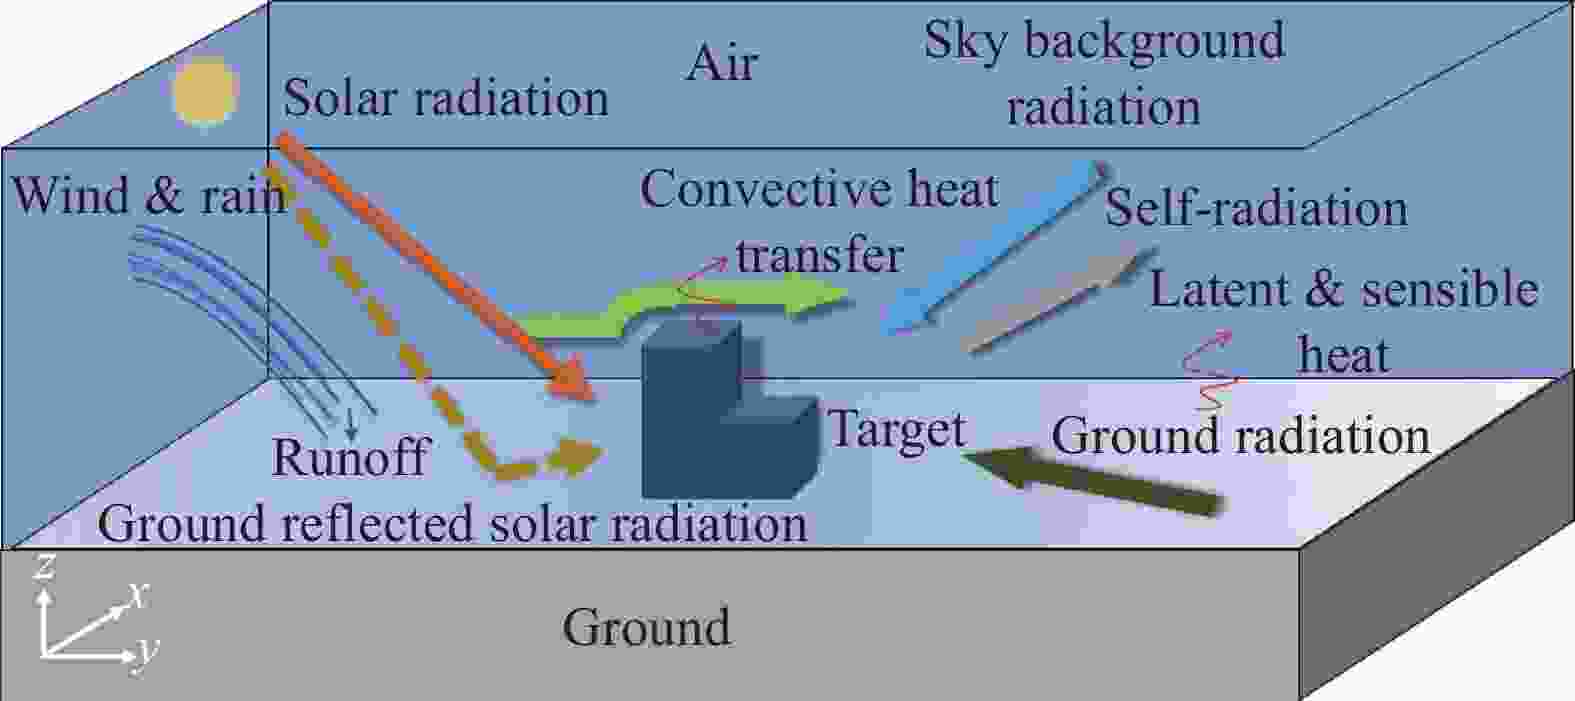
图 1 地面目标热边界示意图
Figure 1. Schematic diagram of ground target thermal boundary
图2为文中针对阴雨天气条件下地面目标热特征分析方法,所搭建的集成计算模型示意图。该模型结合了四个子模型:1)空气流动模型(CFD),该模型用于求解风速、空气温度和相对湿度以及目标表面温度和地面背景表面的含水量,解决了空气域中的湍流、对流换热、热量和水分输送;2)辐射换热模型,该模型根据短波辐射和长波辐射传递方法建模,用于计算地面目标表面与背景表面辐射换热;3)风驱雨模型(WDR),该模型是利用欧拉多项模型计算降雨分布,给出了特定风速风向下降雨目标及背景的表面降雨捕获率;4)湿热耦合模型(BE-HAM),该模型耦合用于计算地面目标和背景表面与空气中的热量和水分传输,解决了表面的对流换热、雨水和蒸发引起的显热传递。下文将分别介绍四个子模型,并提出耦合策略。

图 2 阴雨天气复杂天候搭建的集成计算模型示意图
Figure 2. Schematic diagram of integrated calculation model built in overcast and rainy weather and complex weather
-
通过求解稳态三维RANS方程,结合湍流的标准k-ε模型,计算空气域中湍流气流。除了RANS方程,为了计算空气域中的热量与水分的传输还需进一步添加热传输的能量方程和水分传输的方程[5]。当空气为干空气时,质量、动量能量方程如下:
$$ \frac{{\partial {\rho _a}}}{{\partial t}} + \nabla \cdot ({\rho _a}u) = 0 $$ (1) $$ \frac{{\partial ({\rho _a}u)}}{{\partial t}} + \nabla \cdot ({\rho _a}uu) = - \nabla {p_a} - \nabla \cdot \tau + {\rho _a}g $$ (2) $$ \frac{{\partial ({\rho _a}{h_a})}}{{\partial t}} + \frac{{\partial ({\rho _a}{K_a})}}{{\partial t}} + \nabla \cdot ({\rho _a}{h_a}u) + \nabla \cdot ({\rho _a}{K_a}u) = - \nabla \cdot (q) $$ (3) 式中:ρa为干空气密度;u为风速;pa为压力;τ为粘性应力张量;g为重力加速度;ha=cp,a(T−Tref)为比焓,其中cp,a为比热容,Tref为参考温度;Ka为比动能;q为热流。
密度、压力和温度的理想气体定律为:
$$ {\rho _{{a}}} = \frac{{{p_{{a}}}}}{{{R_{{a}}}T}} $$ (4) Ra为干燥空气的比气体常数。公式(3)中的热流根据傅里叶定律给出:
$$ q = - {\lambda _{{{e f f}}}}\nabla T = - \left({\lambda _a} + \frac{{{c_{p,a}}{\mu _t}}}{{{{\Pr }_t}}}\right)\nabla T $$ (5) 式中:λa为干燥空气的层流热导率;Prt为湍流普朗特数;μt为湍流粘度。
考虑空气中的水蒸气,空气被视为干燥空气和水蒸气的稀释混合物(下标v这里指气相中的水),气相中的水分传输方程如下:
$$ \frac{{\partial {\rho _v}}}{{\partial t}} + \nabla \cdot ({\rho _v}u) = - \nabla \cdot {g_{d,v}} $$ (6) 式中:ρv为水分密度;gd,v为扩散质量通量,由菲克定律给出:
$$ {g_{d,v}} = - {\rho _a}{D_{va,e f f}}\nabla \frac{{{\rho _v}}}{{{\rho _a}}} $$ (7) 式中:Dva,eff为干燥空气和水蒸气之间的有效扩散系数。
空气中的湿度可以根据湿度比ω进行定义:
$$ \omega = \frac{{{\rho _v}}}{{{\rho _a}}} = \frac{{{\rho _v}}}{{{R_v}T}}\frac{{{R_a}T}}{{{p_a}}} = \frac{{{R_a}}}{{{R_v}}}\frac{{\phi {p_{v,sat}}}}{{{p_a}}} $$ (8) 式中:ρv为蒸汽分压;Rv为蒸汽的比气体常数;ϕ=pv/pv,sat为相对湿度;pv,sat为饱和蒸汽压。所以湿度的质量守恒方程为:
$$ \frac{{\partial ({\rho _a}\omega )}}{{\partial t}} + \nabla \cdot ({\rho _a}\omega u) = \nabla \cdot ({\rho _a}{D_{va,e f f}}\nabla \omega ) $$ (9) -
总净辐射通量包括短波辐射通量和长波辐射通量。该模型考虑各表面之间及表面与天空之间的辐射交换。短波辐射通量和长波辐射通量是根据辐射度方法用独立的线性方程组计算得到[13],如下所示:
$$ q_{LW,k}^{out} = {\varepsilon _k}\sigma T_k^4 + {\rho _k}\sum\limits_{j = 1}^N {{F_{k - j}}q_{{{{LW}}, {{j}}}}^{out}} $$ (10) $$ q_{SW,k}^{out} = - (1 - {\alpha _k}){I_{sol}} + \partial {\alpha _k}\sum\limits_{j = 1}^N {{F_{k - j}}q_{{{S W,j}}}^{out}} $$ (11) 式中:$ q_{LW,k}^{out} $表示由于长波而离开表面k的能量;$ q_{S W,k}^{out} $表示由于短波而离开表面k的能量;εk表示表面$ k $的发射率;σ表示斯蒂芬-玻耳兹曼常数;Tk表示表面k的温度;ρk表示表面k的反射率;αk表示表面k的短波反照率,Fk−j表示表面k与表面j之间的角系数;Isol表示入射到表面k的太阳总辐射;由直射分量Idir和散射分量Idiff组成[13]:
$$\begin{aligned} {I_{sol}} = {I_{dir}} + {I_{dif f}} \\ {I_{dir}} = {I_{DN}}\cos \theta \\ {I_{DN}} = A{{\rm{e}}^{\tfrac{B}{{\sin \beta }}}} \\ {I_{dif f}} = C{I_{DN}}{F_{s s}} \end{aligned}$$ (12) 式中:IDN是入射到表面k的太阳法向辐射;θ是入射太阳光线与接收表面之间的入射角;β是太阳高度角;Fss表示表面与天空之间的角系数;A、B和C是常数,取决于一年中的多少天。太阳入射的直射分量Idir是通过光线追踪的方法进行计算,考虑了面与面之间的遮挡。
线性方程组(10)与(11)允许地面目标和天空之间无限次数的反射。天空温度是根据云层覆盖和环境温度计算的。空气被认为是一种非参与介质,即忽略了空气对辐射的吸收、散射和发射。天空温度是根据云量和环境温度Ta计算得到:
$$ {\varepsilon _c} = (1 - 0.84c)(0.527 + 0.161{{\rm{e}}^{[8.45(1 - 273/{T_a})]}}) + 0.84c $$ (13) $$ {T_{sky}}^4 = 9.365\;574 \times {10^{ - 6}}(1 - c){T_a}^6 + {T_a}^4c{\varepsilon _c} $$ (14) 式中:c是云量;εc是云的发射率。
-
利用欧拉多相(EM)模型计算风驱雨强度(WDR强度)分布是最常被用来预测降雨分布的方法。在EM模型中的雨相和风相被视为一个连续相,基于三维稳定RANS方程和封闭湍流模型计算地面目标周围的稳态流场,而大小相似的雨滴将以类似的方式与风场相互作用,可以根据每个雨滴的大小划分为不同的阶段,进而通过求解其独立的连续方程和动量方程[14]来获得雨滴轨迹。
$$ \frac{{\partial {\alpha _d}}}{{\partial t}} + \frac{{\partial {\alpha _d}\overline {{u_{d,j}}} }}{{\partial {x_j}}} = 0 $$ (15) $$ \begin{split} & \frac{{\partial {\alpha _d}\overline {{u_{d,i}}} }}{{\partial t}} +\frac{{\partial {\alpha _d}\overline {{u_{d,i}}} }}{{\partial {x_j}}} + \frac{{\partial {\alpha _d}\overline {{u'}_{d,i}{u'}_{d,j}} }}{{\partial {x_j}}} =\\ & \quad {\alpha _d}{g_i} + {\alpha _d}\frac{{3{\mu _a}}}{{{\rho _w}{d^2}}}\frac{{{C_d}{{{Re} }_R}}}{4}(\overline {{u_i}} - \overline {{u_{d,i}}} ) \end{split} $$ (16) 式中:αd是雨相d的相分数;d表示特定粒径的雨滴;ud,j表示雨相d中的雨滴速度分量;ui代表风的分量;ρw代表雨滴密度;μa是空气粘度;gi是重力加速度;Cd是阻力系数;ReR是相对雷诺数。气流湍流运动导致雨滴的湍流运动,雨滴速度与风速之间存在响应关系[14]。
$$ C_t^2 = \frac{{\overline {{u'}_{d,i}{u'}_{d,j}} }}{{\overline {{u'}_i{u'}_j} }} = \frac{1}{{1 + {{{t_p}}}/{{{t_{fl}}}}}} $$ (17) 式中:Ct为响应系数;tp表示粒子的弛豫时间;tfl表示拉格朗日流体的时间标度。与拉格朗日流体时间尺度相比,粒子越小弛豫时间越小,也就是越小的雨滴Ct的值越接近于1。
基于计算的雨滴轨迹确定特定粒径雨滴的特定捕获比ηd,根据特定捕获比和水平雨滴大小分布计算每个面的捕获率[14]。
$$ {\eta _d} = \frac{{{R_{wdr}}(d)}}{{{R_h}(d)}} = \left| {\frac{{{\alpha _d}{V_n}(d)}}{{{\alpha _{d,0}}{V_t}(d)}}} \right| $$ (18) $$ \eta = \frac{{{R_{wdr}}}}{{{R_h}}} = \sum\limits_{k = 1}^N {{\eta _{dk}}{f_{Hk}}\Delta d} $$ (19) 式中:ηd为特定捕获比;Rwdr(d)和Rh(d)分别为待测区域表面特定粒径雨相的风驱雨强度和不受干扰处的水平降雨强度;Vn为待测区域表面的雨相垂直撞击壁面的速度;Vt为雨滴的竖直末端速度。公式(19)fHk∆d为某相雨滴在水平面上占比;Rwdr和Rh与Rwdr(d)和Rh(d)代表同样的含义只是它们代表所有粒径雨相考虑水平通量分数后的累加。
-
地面背景(草地、砖石、沥青等)多为透水材料,地面目标(钢、铝等)多为不透考虑为不透水材料。在该研究中透水材料考虑为多孔介质,采用了连续介质建模方法,其中不同的相在材料中的某一点上不单独区分,而是对多孔材料的宏观行为进行建模。假设透水表面可以全部吸收降雨不会产生积水,不透水表面不能吸收任何水分[15]。透水表面的相比不透水表面增加了液体的渗透,由于多孔材料内吸收了水分热边界方程中增加水分蒸发与冷却所散失的能量。
$$ {g_{ext}} = {g_{wdr}} + {g_{conv}} $$ (20) $$ {q_{ext}} = {q_{conv}} + {q_{LW}} + {q_{SW}} + {q_{wdr}} + {q_{vap}} $$ (21) 公式(20)为边界湿通量,式中:gext为材料表面的水分通量;gwdr为材料表面雨水带来的质量通量;gconv为流入透水表面内部水蒸气交换的水分通量。公式(21)为边界热通量,式中:qext为材料表面热通量,qconv为对流换热量;qLW和qSW分别为表面净长波与短波传热量;qwdr为雨水引起的显热;qvap为透水材料孔隙中水分的蒸发与冷却。
雨水质量通量,雨水引起的显热换热量,孔隙中蒸汽的蒸发与冷却引起的潜热和显热换热量为[16]:
$$ {g_{wdr}} = {R_{wdr}}{\rho _l} $$ (22) $$ {q_{wdr}} = {c_l}{T_{wb}}{g_{wdr}} $$ (23) $$ {q_{vap}} = ({c_v}{T_s} + {L_v}){g_{conv}} $$ (24) 式中:ρl为水的密度;Twb为湿球温度;cl和cv分别为液体和水蒸气的热容;Ts为材料表面温度;Lv为汽化潜热。
-
使用Open FOAM®6.0作为CFD求解器,添加三个主要的附加组件:WDR求解器、辐射模型、湿热耦合模型,图3为模型流程图。Open FOAM是一个开源、隐式、隔离和双精度的有限体积求解器,利用求解器与计算模型一同对地面目标的热特征进行详细分析。

图 3 求解器流程图
Figure 3. Solver flowchart
在阴天有降雨的天气条件下调用WDR模型,在阴天无降雨的天气条件下不需要调用WDR模型。以阴天有降雨的计算过程为例,首先利用WDR模型计算降雨捕获率,在WDR模型中每输入一个降雨强度Rh(mm/h)与风速矢量U(m/s)便会输出一组雨滴尺寸下的降雨捕获率。文中将雨滴粒径划分了17个雨相,雨滴粒径范围涵盖了0.3~6 mm,具体的划分方法:粒径在0.3~1 mm,每0.1 mm步长划分一组;粒径在1~2 mm,每0.2 mm步长划分一组;粒径在2~6 mm,每1 mm步长划分一组,将降雨事件每10 min划分一个步长,假设10 min内的风速风向及降雨强度不发生变化,风速为10 min内的平均风速,风向为10 min开始时刻测量到的风向,降雨强度为10 min内测得的降雨强度,在WDR模型中每隔10 min步长输出一个(Rh,U10 min)计算组合的降雨捕获率。在这一步骤之后,可以通过对计算出的捕获率值进行线性插值,获得特定降雨事件的目标及背景表面上的捕获率分布,其结果用作CFD计算中空气域的边界条件。
在CFD模型中求解稳定的流场,并同时调用辐射换热模型与湿热耦合模型,需要的输入条件为空气温度(K)、空气比湿度(kg/kg)、太阳直射辐射强度(W/m2)、太阳散射辐射强度(W/m2)、风速矢量(m/s)、云量(%),利用压力关联方程的半隐式方法(SIMPLE)进行压力-速度耦合。对于控制方程的对流项和粘性项,都使用了二阶离散格式。利用辐射换热模型加载太阳辐射与热辐射,固体域与空气域的交界处利用湿热耦合模型计算温度分布,湿热耦合模型要考虑来自空气域的水分传输、热量传输还要考虑来自固体域的水分传输、热量传输,利用边界湿通量等式与边界热通量等式共同确定固体域温度分布。当所有缩放残差达到以下值时,空气子域中的迭代终止:所有速度分量、湍流项和连续性为10−5,热量和水分为10−4。当连续迭代之间绝对值的变化小于含水量0.01 kg/m3和温度0.01 K的阈值时,固体子域中的Picard迭代方案终止。最后利用计算出的热通量与湿通量,进行湿热耦合计算输出地面目标表面的温度分布特性。
-
为了验证上述集成模型在典型阴雨天气下的有效性,设计了CUBI模型目标在阴雨天气下的测温试验,利用热电偶测量不同天气下的目标典型测温点温度变化;基于目标的形状尺寸、材料、背景等建立CUBI目标的计算模型,通过对比计算温度和实测温度来验证该方法的有效性,并利用该集成模型研究典型阴雨天气条件下风速风向及降雨对表面温度产生影响。
-
试验采用不可透水材料的标准CUBI目标模型为地面目标,放置于多孔可透水的水泥地砖地面背景之上。图4(a)为试验示意图,图中标准CUBI模型高、长、宽分别为0.6、0.6、0.3 m,材料为Q235钢,表1列出了相关材料的热物性参数。试验地点为南京理工大学能动院天台(东经118°85′,北纬32°03′),试验地点无遮挡,CUBI模型附近对风速风向、降雨均无遮挡。试验时间为2022年6月28日,降雨天气。试验利用K型热电偶与Agilent 34972 A型号数据采集仪采集目标表面的典型测点温度。试验期间的气象数据采用气象站和太阳辐射观测站采集,气象站配备了叶轮式风速仪,最高可测量参考风速20 m/s及参考风向,水平降雨强度由带水平孔的翻斗式雨量计进行测量,误差精度为0.1 mm/h。

图 4 (a) CUBI模型试验图;(b) CUBI物理模型及网格划分
Figure 4. (a) CUBI model test diagram; (b) Physical model and meshing of CUBI
表 1 相关材料的热物性参数
Table 1. Physical parameters of materials
Materials Density
ρ/kg·m−3Specific heat
c/J·(kg·K)−1Thermal conductivity
λ/W·(m·K)−1Emissivity
εAlbedo
βQ235 steel 7850 540 44 0.72 0.88 Porous concrete 2200 966 1.28 0.92 0.6 -
CUBI目标计算条件根据试验情况给出,图4(b)为利用ICEM CFD软件对模型计算时使用的CUBI体模型进行的网格划分的示意图,利用第1章介绍的计算模型求解地面目标及背景的温度场分布。图5为2022年6月28日试验期间测得的气象参数数据示意图,其中测得的风速为标量数据,需结合CUBI模型的朝向与风向角度,将风速处理成矢量数据,进而输入到计算模型,风速转换公式见表2。当天9点20分至11点40分发生降雨事件,假设降雨强度每隔10 min记录一次,当天的降雨强度变化如图5(b)所示。

图 5 2022年6月28日阴天气象参数。 (a) 空气温度、比湿度;(b) 降雨强度;(c) 风速;(d) 太阳辐射
Figure 5. Meteorological parameters on June 28, 2022. (a) Air temperature, air specific humidity; (b) Precipitation intensity; (c) Wind speed; (d) Sun radiance
表 2 风速转换公式
Table 2. Wind speed conversion formula
Wind direction $ \theta $/(°) Conversion formula 0≤$ \theta $<90 $( - { { { {U} }\cos} }(\theta - 90^\circ ), -{U} \sin(\theta - 90^\circ ),0)$ 90≤$ \theta $<180 $( - { {U \cos} }(\theta - 90^\circ ),U\sin(\theta - 90^\circ ),0)$ 180≤$ \theta $<270 $(U\sin(\theta - 180^\circ ),U\cos(\theta - 180^\circ ),0)$ 270≤$ \theta $<360 $(U \cos(\theta - 270^\circ ), - U \sin(\theta - 270^\circ ),0)$ -
为了确定搭建的阴雨天地面目标集成模型计算的真实性与精确性,可以通过对比CUBI模型每个方位面上典型点的计算结果与试验测量数据之间的误差,计算平均绝对误差。图6为试验中在CUBI模型的摆放方位及在CUBI模型上选取的典型测温点,同样的模拟计算时设置了相同位置的监测点。

图 6 CUBI模型监测点设置示意图
Figure 6. Schematic diagram of CUBI model monitoring point setting
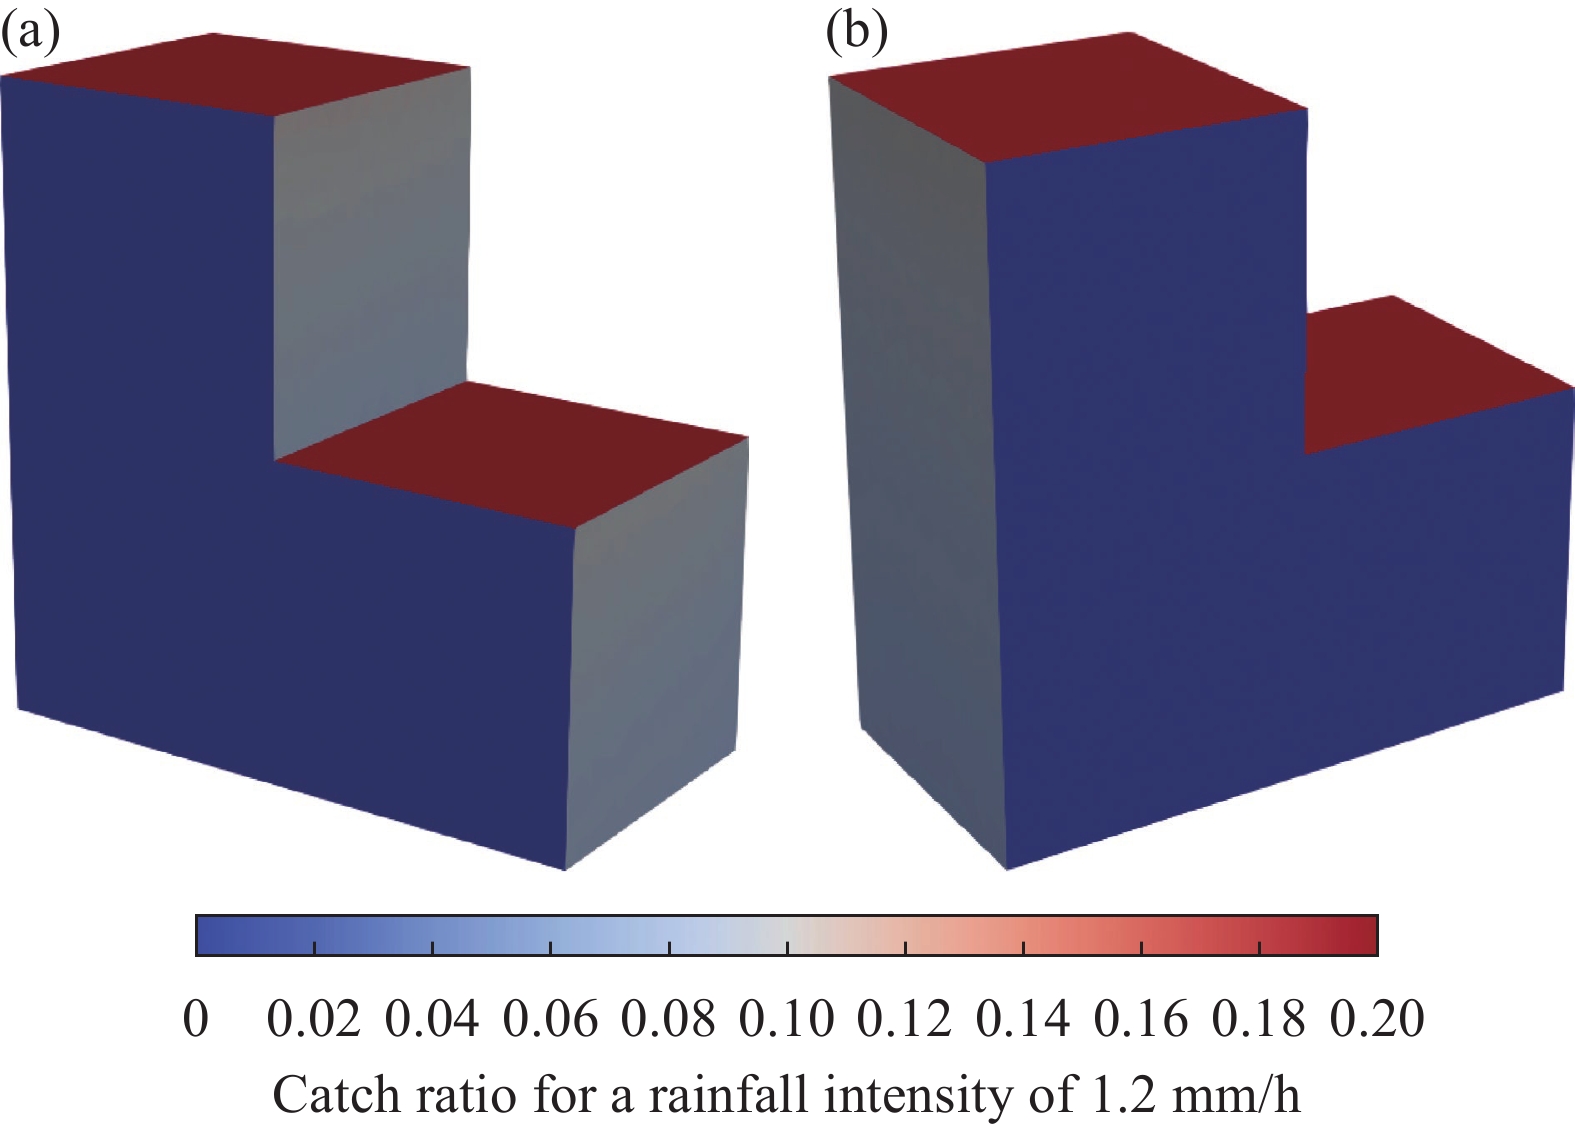
试验当天降雨出现在上午9点20分至11点40分。降雨阶段需根据风驱雨模型计算降雨强度分布,每10 min计算一组地面目标及背景的降雨捕获率分布情况。图7为西南风向下降雨时刻地物降雨捕获率分布图与试验拍摄CUBI模型降雨分布图,该时刻降雨强度为1.2 mm/h,风向风速为西南风1.5 m/s。从图7(a)可以看出,CUBI模型顶面的降雨捕获率最高,CUBI模型的立面中,迎风面降雨捕获率最高,这与图7(b)的试验拍摄结果相符,试验拍摄到的CUBI模型外部特征也可以观测到模型的东面基本没有降雨捕获。

图 7 (a) 降雨强度1.2 mm/h的CUBI模型降雨捕获率分布图;(b) 试验拍摄CUBI模型降雨分布图
Figure 7. (a) The distribution of catch ratio for CUBI model rainfall intensity of 1.2 mm/h; (b) Test photography of CUBI model rainfall distribution map
将上述气象条件与风驱雨模型的计算结果用于CUBI模型的典型阴雨天气下表面温度分布的模拟计算,图8为10点整降雨时刻CUBI模型的降雨时温度分布图,图8(a)为背风面视角下CUBI模型温度分布,图8(b)为迎风面视角下CUBI模型温度分布。可以看出,降雨过程中,受降雨影响,CUBI模型各表面温度相近最大温差小于2 K。在降雨与西南风的共同作用下,迎风面西面与南面温度相对较低,背风面北面与东面温度相对较高。

图 8 (a) 背风面视角下CUBI模型温度分布;(b) 迎风面视角下CUBI模型温度分布
Figure 8. (a) Temperature distribution of CUBI model from leeward view; (b) Temperature distribution of CUBI model from the view of windward side
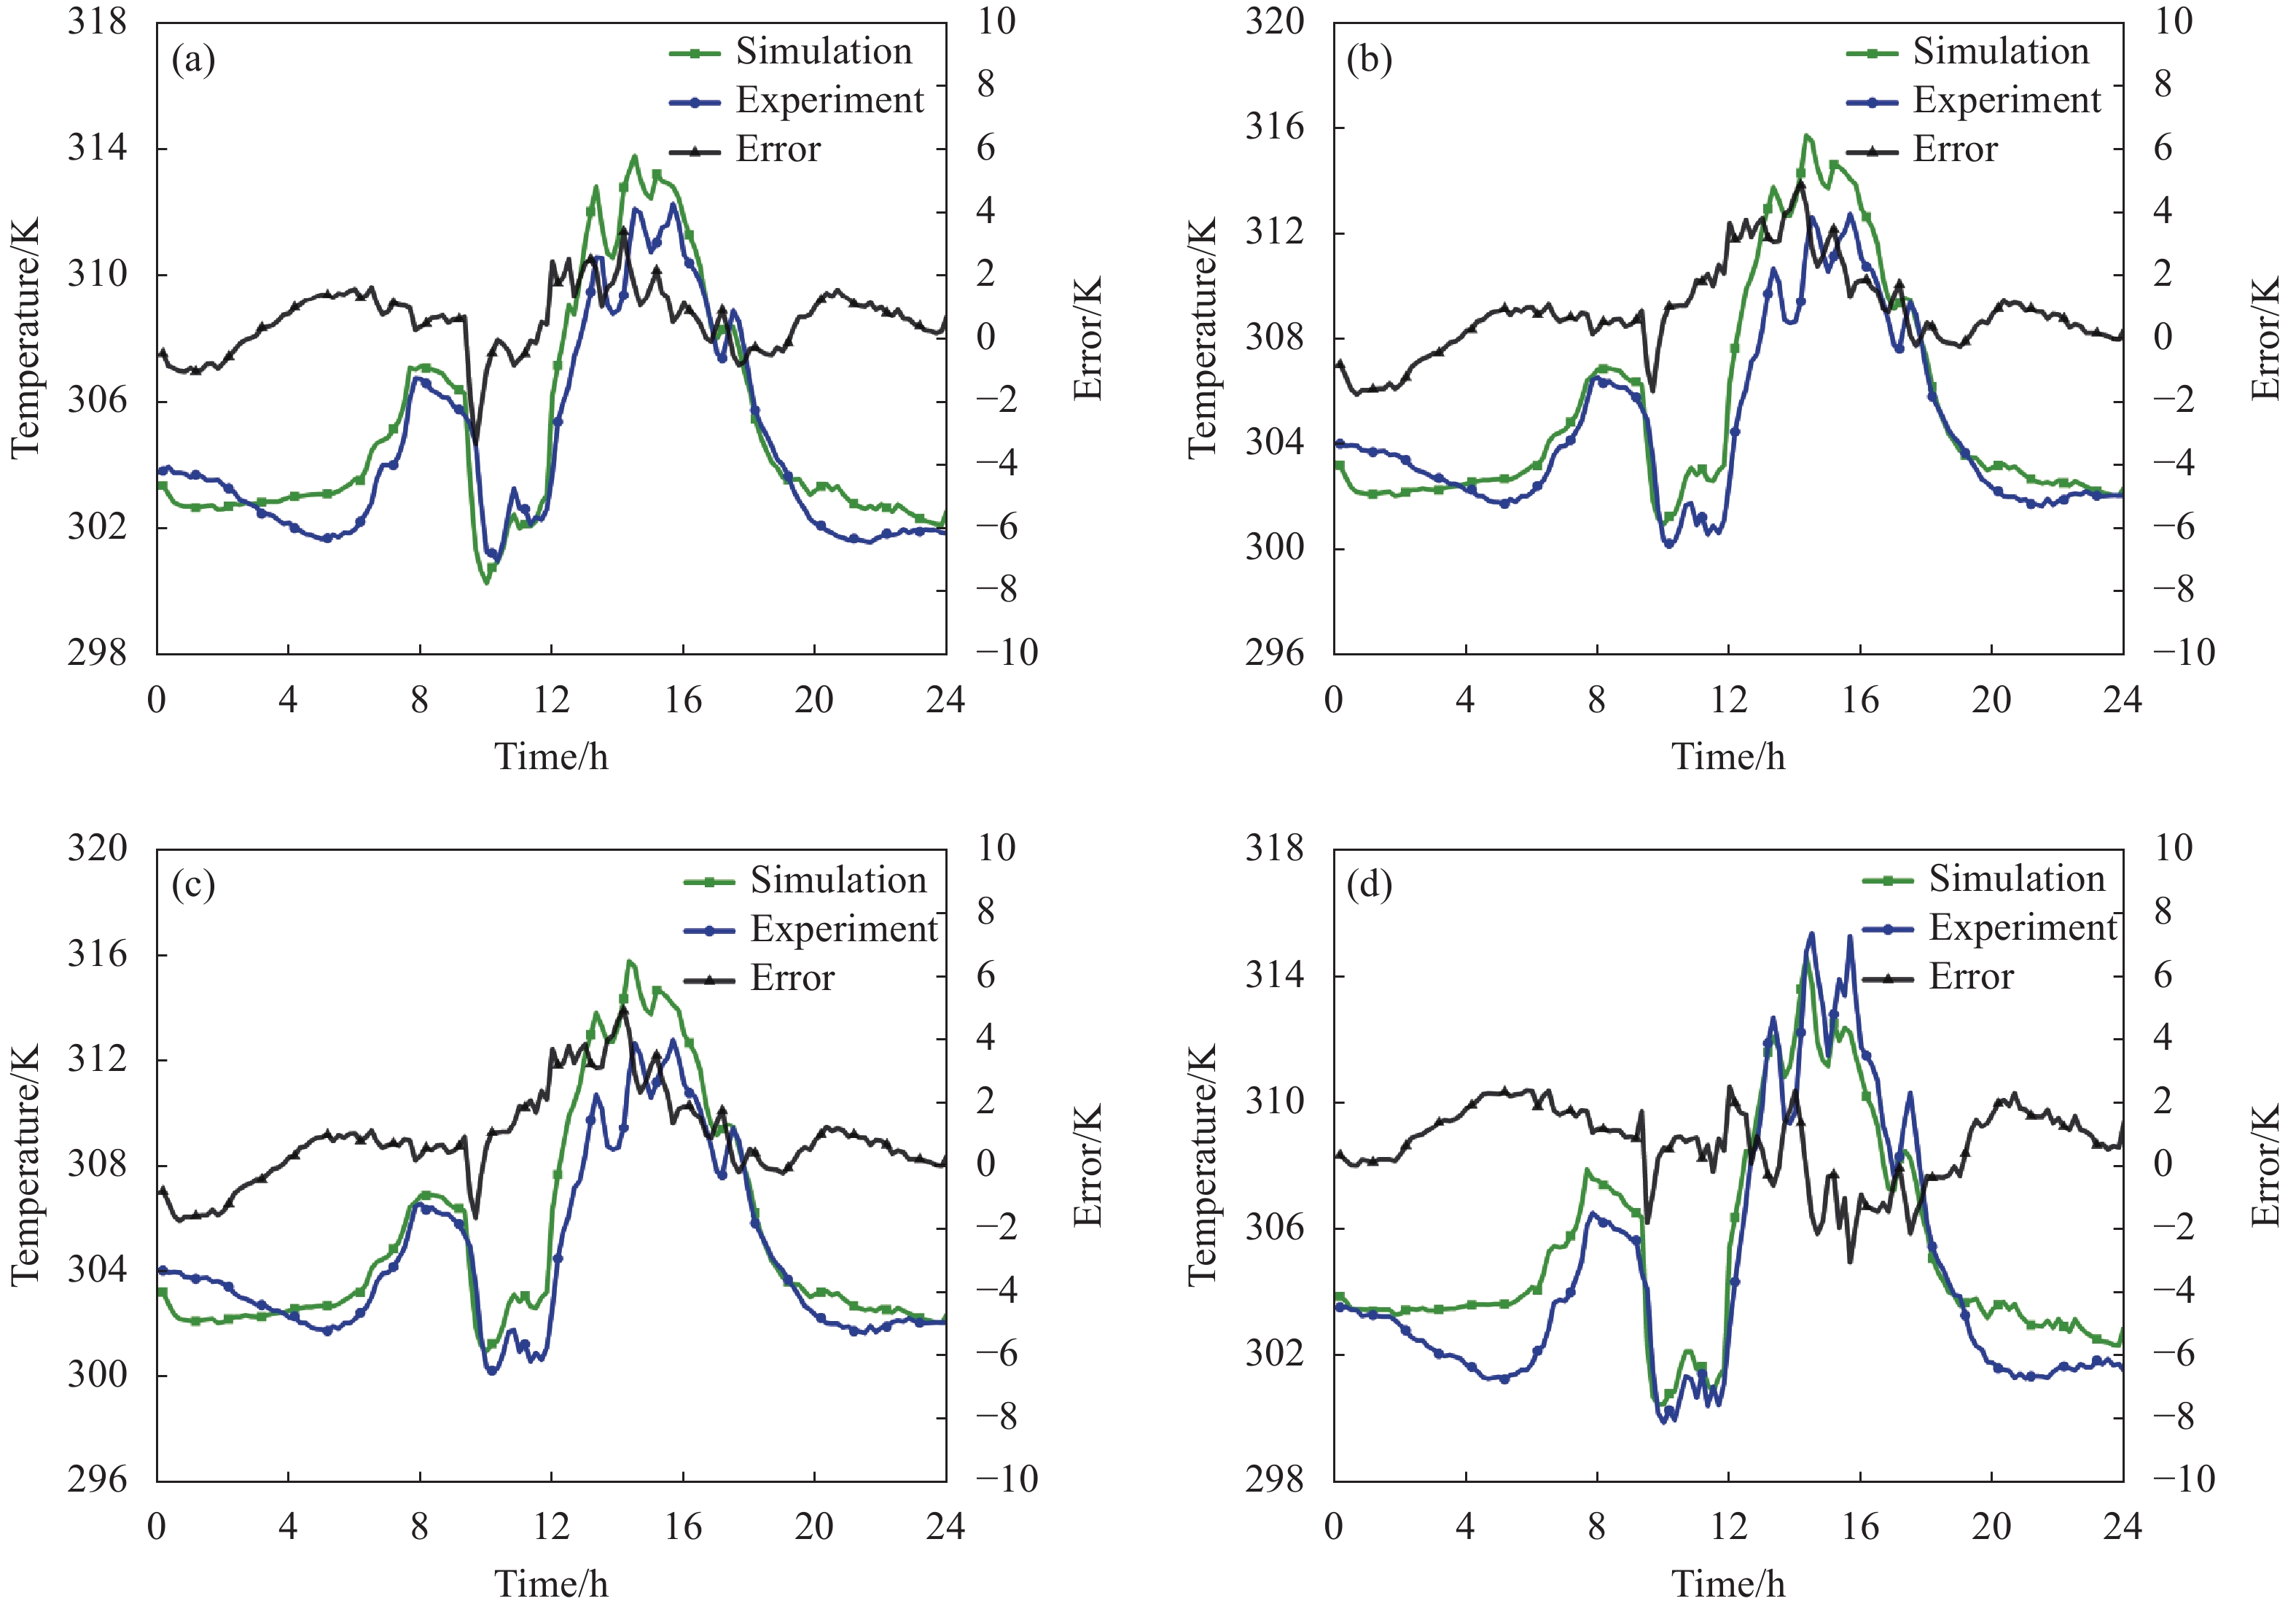
图9(a)~图9(d)分别为东、南、西、上表面在6月28日阴雨天气全天的计算与实测监测点温度变化特征和误差图。可以看出,在所选时间内各表面的计算温度值与热电偶实测温度值变化趋势趋于一致,夜间0点至5点表面温度下降;9点至12点受降雨影响各表面均出现温度骤降与全天最低温度;东面与北面因降雨阶段为背风面后半段降雨强度减小回温最为明显,表明计算结果具有参考性与可信性。其次当平均绝对误差MAE的值越小,说明模拟值越接近实测值,模型的计算精度越高,具体计算公式为:

图 9 各表面计算温度与实测温度变化特性及其误差图。(a) 东面温度对比图;(b) 南面温度对比图;(c) 西面温度对比图;(d) 上面温度对比图
Figure 9. Variation characteristics of calculated and measured temperatures on each surface and their errors. (a) Comparison diagram of east temperature; (b) Comparison diagram of south temperature; (c) Comparison diagram of west temperature; (d) Comparison diagram of up temperature
$$ MAE = \frac{{\displaystyle\sum \limits_{i = 1}^n \left| {{x_i} - {y_i}} \right|}}{n} $$ (25) 式中:n为全天的典型测温点实测温度个数;xi为模型计算值;yi为实测值。
经过计算得出温度点全天的MAE值为0.95 K,由此证明了计算结果与真实值误差较小。同时说明,文中提出的阴雨天气条件下地面目标表面温度计算模型的计算结果,在具有真实性的基础上有较高的精确性。
-
根据上文提出并验证的阴雨天气条件下,地面目标表面温度集成计算模型,计算研究降雨强度、风速风向对地面目标表面温度分布的影响。空气温度、空气比湿度、太阳辐射均采用试验实测值,分别改变降雨阶段降雨强度大小与降雨阶段风向,计算并对比分析CUBI模型表面的热特征分布。
-
改变降雨阶段的降雨强度大小至2倍、3倍,重新计算9点20分至11点40分内地面目标与背景的降雨捕获率。图10为9点20分西南风向1.5 m/s,降雨强度分别为1.2 mm/h、2.4 mm/h和3.6 mm/h地面目标顶面的降雨捕获率分布图像。从图中可以看出,随着降雨强度的增加,地面目标表面的降雨捕获率升高,且由于西南风的影响,CUBI模型上面的降雨分布趋于东北角。

图 10 降雨强度分别为1.2 mm/h、2.4 mm/h和3.6 mm/h CUBI模型顶面的降雨捕获率分布图
Figure 10. Rainfall capture rate of CUBI model top surface with rainfall intensity of 1.2 mm/h, 2.4 mm/h and 3.6 mm/h respectively
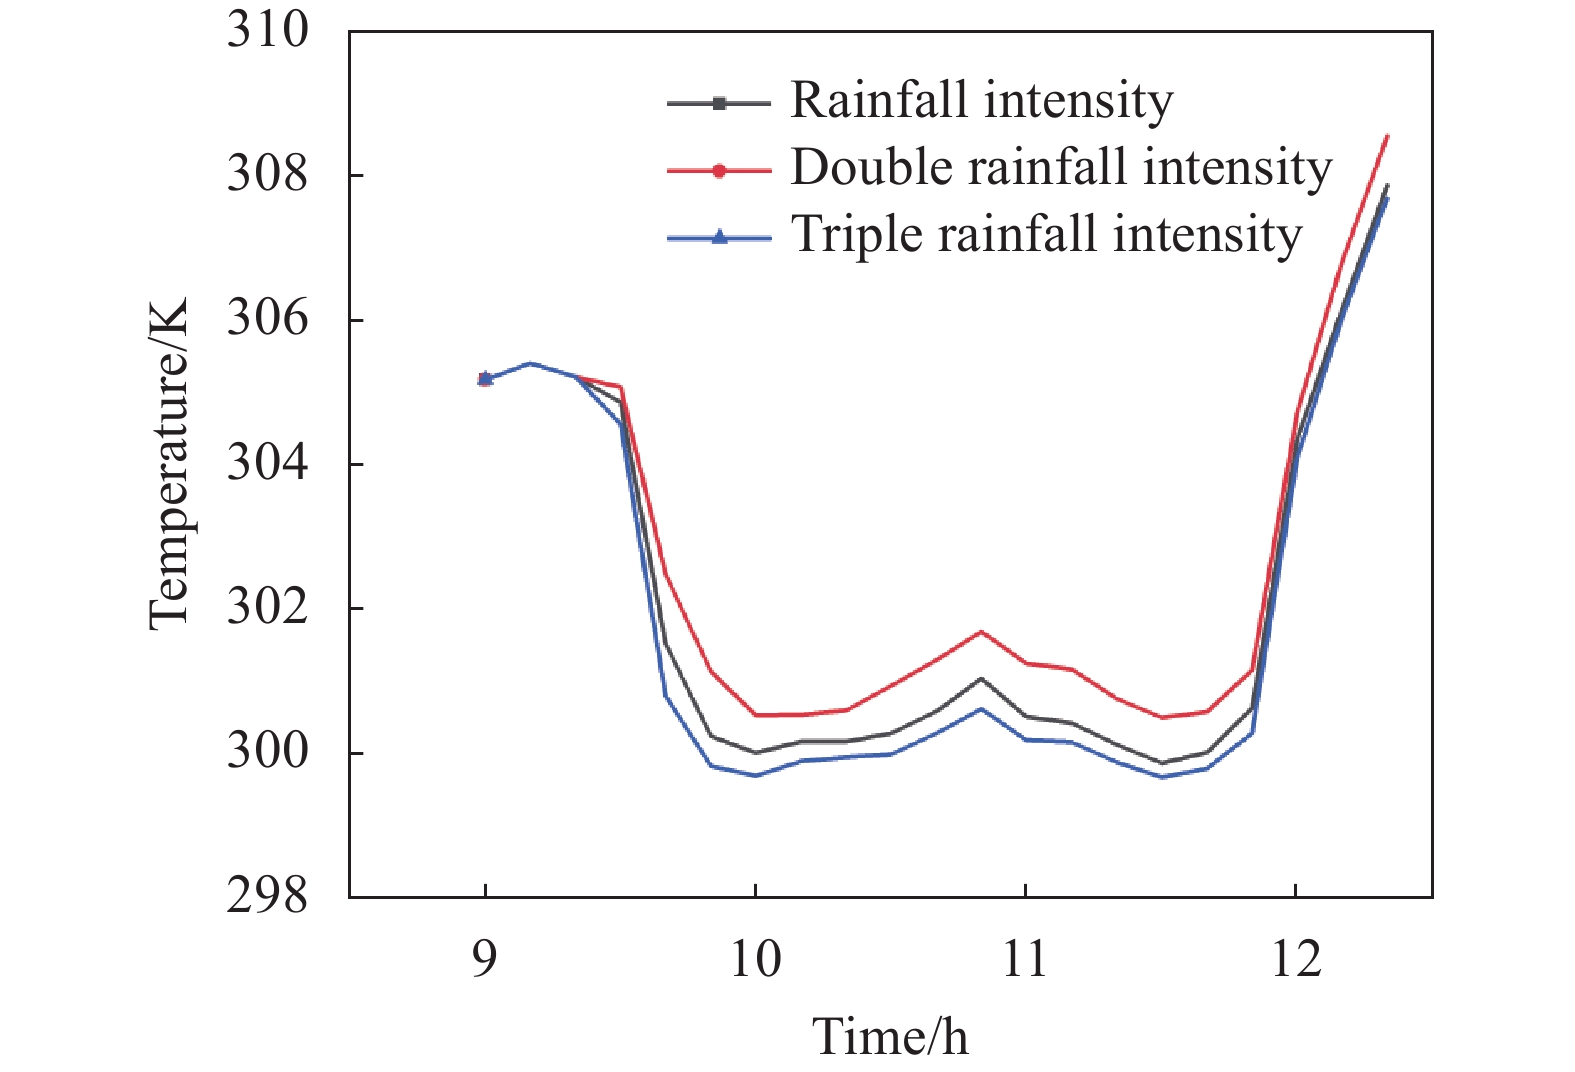
图11为9点至12点降雨阶段CUBI模型上面监测点温度对比图,从图中可以看出在不改变其他气象条件的情况下,仅加降雨强度的大小,上表面温度降低的速率越快,温度相对越低。在未改变其他气象条件与环境因素的情况下,增大降雨强度,地面目标表面由于降雨引起的显热增大了,从而加快了表面温降速率,降低了表面温度。

图 11 降雨阶段CUBI模型上面监测点温度对比图
Figure 11. Temperature comparison diagram of monitoring points on CUBI model in rainfall stage
-
不改变降雨强度与风速大小,将风向角加90°后根据表2中的风速矢量公式重新处理风速。因风向发生改变,从而影响了风驱雨地物表面的降雨捕获率分布,重新计算9点20分至11点40分内地面目标与背景的降雨捕获率。图12为9点20分风速为1.5 m/s、降雨强度为1.2 mm/h、风向分别为231°与321°目标表面降雨捕获率分布图,从图中可知由于风向不同,231°时为西南风CUBI模型立面中的主要迎风面为西面与南面、321°时主要迎风面为西面和北面,降雨捕获率分布受风速风向的影响,在CUBI模型顶面降雨捕获率最高,立面中迎风面降雨捕获率最高,背风面几乎没有降雨分布。
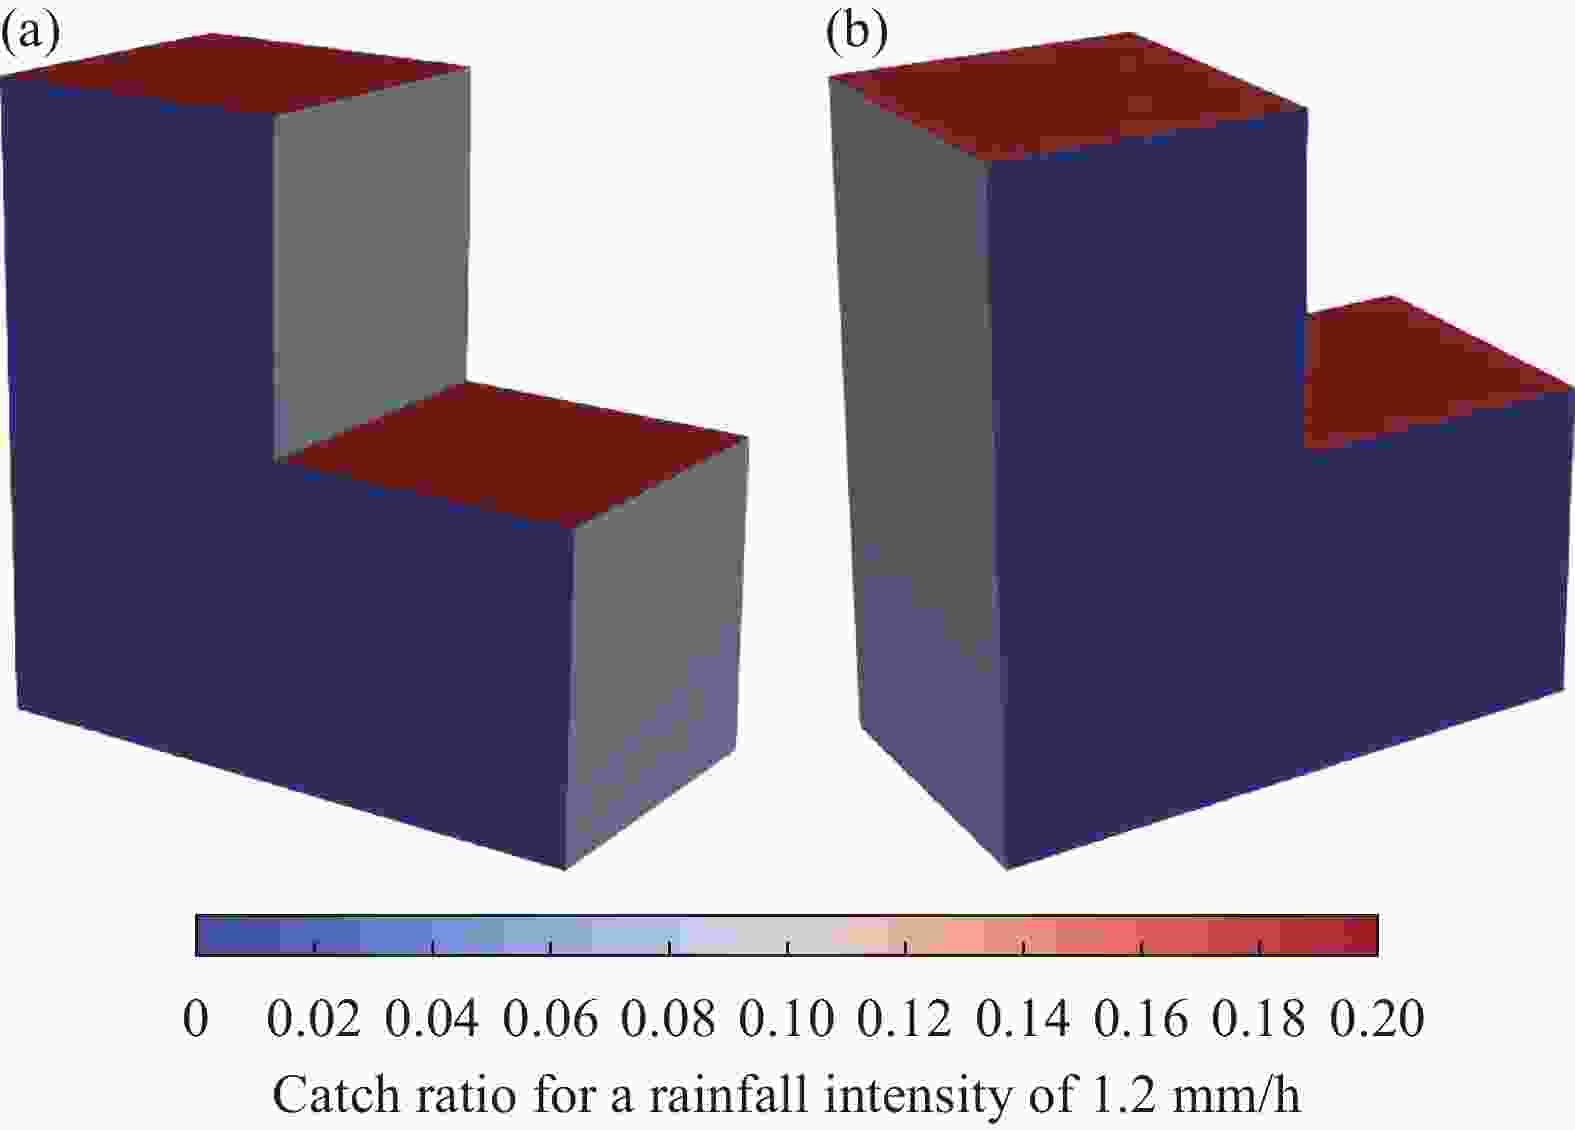
图 12 (a)西南风向下CUBI模型的降雨捕获率分布图;(b) 西北风向下CUBI模型的降雨捕获率分布图
Figure 12. (a) Rainfall capture rate distribution of CUBI model in southwest wind direction; (b) Rainfall capture rate distribution of CUBI model in northwest wind direction
图13为改变风向角前后计算得到的24 h CUBI模型各面监测点的温度变化特性图,图12(a)为西南风向下各表面温度变化,图12(b)为西北风向下各表面温度变化。可以看出,在西南风向下北面温度整体高于其他面,西北风向下南面温度整体高于其他面。图13(b) 12点~18点中可以明显看出,在西北风的风向下西面温度仍然较高,这是因为该时段受太阳直射的影响,CUBI模型西面虽然在迎风面对流换热增大,但太阳直射的辐射换热增强。
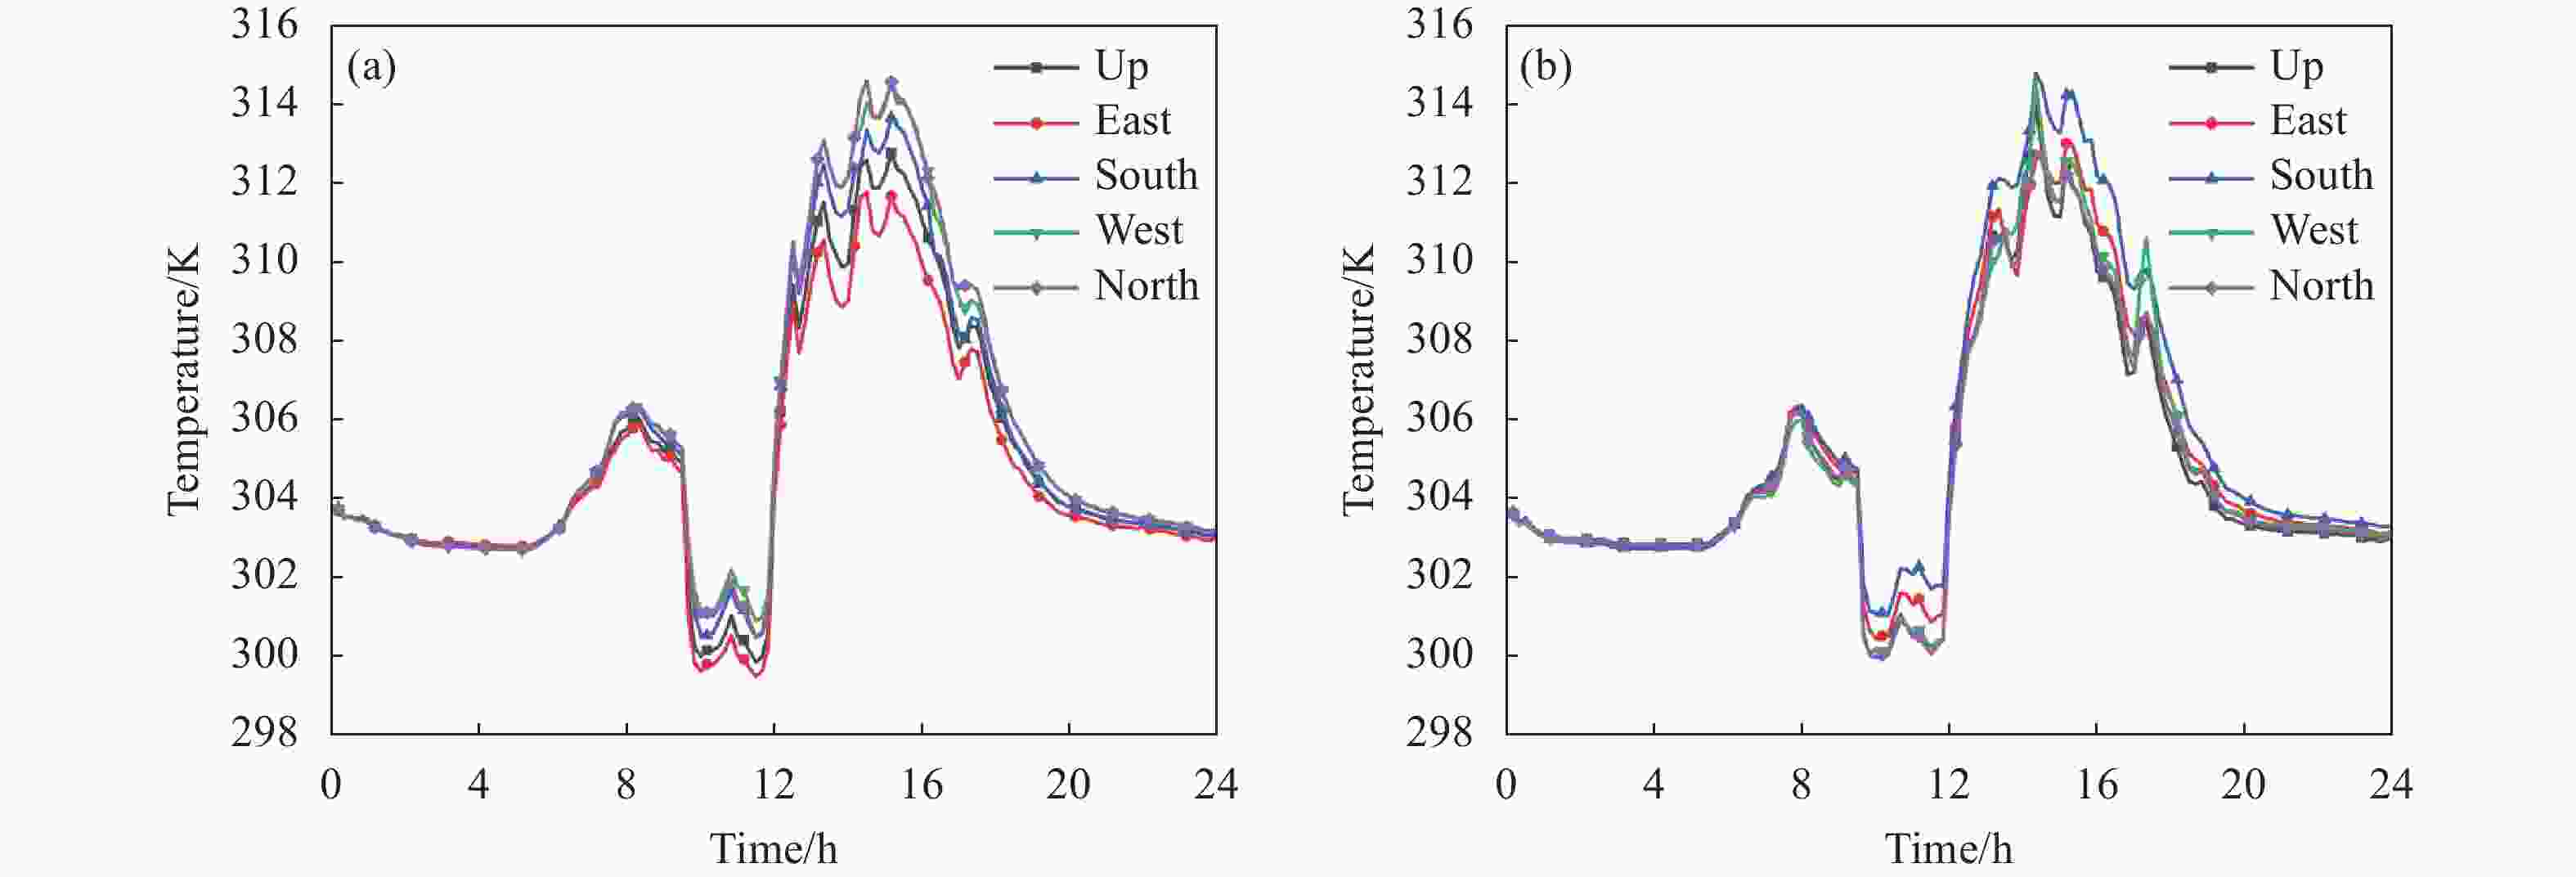
图 13 (a)西南风为主时CUBI模型24 h各表面温度特征;(b) 西北风为主时CUBI模型24 h各表面温度特征
Figure 13. (a) 24 h surface temperature characteristics of CUBI model when southwest wind is dominant; (b) 24 h surface temperature characteristics of CUBI model when northwest wind is dominant
图14为北面温度对比图,可以进一步看出风向对地面目标表面温度分布的影响。当风向由西北风转为西南风时,北面温度降低,且在夜间风速较低的时段温差并不明显;在8点~20点由于风速增大对流换热影响增大,北面因为风向的调整温度降幅明显。

图 14 西南风向、西北风向下CUBI模型的北面的温度特性及风速分布图
Figure 14. Temperature characteristics and wind speed distribution in the north of CUBI model in southwest and northwest wind directions
-
文中针对阴雨天气条件,给出了一种考虑风驱雨与湿热耦合的地面目标表面温度的计算模型,该方法采用了一个完全集成的三维数值模型来研究地面目标及背景的温度分布特性,充分考虑了水分、热量传输。该计算模型能够提供速度、温度和湿度的详细空间分布,从而可以研究地面目标在复杂天气条件下的受太阳辐射、空气湿度、风速风向等影响的温度分布特性。主要得到的结论如下:
1)基于地面目标热特征分析方法,利用阴雨天气下监测的气象数据对CUBI模型仿真计算,计算结果和CUBI模型试验的实测数据进行对比,证明了文中提出的集成阴雨天气下地面目标表面温度计算模型的可靠性与精确性;
2)利用该集成计算模型分析了在其他气象条件不变的情况下,不同降雨强度与不同风向对地面目标表面温度分布造成的影响。随着降雨强度增强地面目标表面降雨捕获率升高、温度下降。当风向发生改变时迎风面随之发生改变,迎风面的温度通常会低于背风面,但也会受其他气象条件的影响;
由此可见,文中提出的阴雨天气下地面目标表面温度计算模型在还原了真实阴雨天地面目标表面温度变化的同时,还具有较高的精确性,并进一步讨论了降雨强度及风向对CUBI模型表面降雨捕获率、温度分布造成的影响,可为地面目标在阴雨天气情况下的热特征分析提供方法支撑。文中讨论阴雨天气条件地面目标表面热特征分布时,讨论的是可透水地面,假设地面对雨水完全吸收,未考虑地面积水这一情况的影响,未来可基于模型对地面多孔模型进行改进,进而应用于任意地面背景下阴雨天气地面目标热特征的研究。另外,文中研究的地面目标较为简单计算量较小,未来可以将风驱雨模型(WDR)提炼成经验公式,简化计算模型应用至大场景的仿真计算。
Calculation model of surface temperature of ground target under the coupling effect of wind-driven rain and moisture and heat
-
摘要: 天气环境变幻莫测,阴雨天气更是不可避免,研究地面目标表面热特征可以更好地服务于热红外探测与热红外制导,提高目标定位的准确性。阴雨天气条件下地面目标表面降雨分布受降雨、风力影响;地面背景受透水材料的水分吸收及蒸发带来的潜热影响,致使地面目标表面的热特征具有不确定性。文中将空气流动模型、辐射换热模型、风驱雨模型和湿热耦合模型相结合,在开源平台Open FOAM提出了一种集成考虑风驱雨与湿热耦合的地面目标表面温度计算模型,研究阴雨天气条件下地面目标表面的热特征以及降雨强度和风向对目标表面温度特性的影响。结果表明:利用该集成计算模型计算目标表面温度的模拟值与热电偶实测值变化趋势高度一致,数值计算24 h各表面的平均绝对误差为0.95 K;存在降雨的时刻目标表面的温差较小,受降雨与风向的影响,目标的迎风面因降雨捕获率较高,温度通常低于背风面温度;降雨强度、风速风向发生改变均会影响目标表面降雨捕获率分布,从而影响表面温度特征分布。研究表明该方法具有可靠性和较好的精确性,可为阴雨天气条件下复杂地面目标的热特性分析提供方法支撑。Abstract:
Objective The weather environment is unpredictable, and rainy weather is even more inevitable. Studying the surface thermal characteristics of ground targets can better serve thermal infrared detection and guidance, improving the accuracy of target positioning. Most of the existing research on the thermal and infrared characteristics of ground targets is based on sunny conditions, while few studies have been conducted on the surface temperature characteristics of ground targets under cloudy and rainy conditions. The distribution of rainfall on the surface of ground targets under overcast and rainy weather conditions is affected by rainfall and wind force; The ground background is affected by the latent heat caused by moisture absorption and evaporation of permeable materials, resulting in uncertainty in the thermal characteristics of the ground target surface. Therefore, this paper proposes a calculation model for surface temperature of ground targets that integrates wind-driven rain and moisture heat coupling, and studies the thermal characteristics of surface targets under overcast and rainy weather conditions, as well as the effects of rainfall intensity and wind direction on surface temperature characteristics of targets. Methods In Open FOAM, an open source platform, combining air flow model, radiation heat transfer model, wind-driven rain model, and moisture heat coupling model, a ground target surface temperature calculation model integrating wind-driven rain and moisture heat coupling is established (Fig.2), and the call and coupling process is given (Fig.3). The reliability and accuracy of the integrated model were verified using CUBI model experiments. The calculated temperature curve was similar to the temperature variation trend of the characteristic points on the surface of the CUBI model in the experiment (Fig.9), and the average absolute error was 0.95 K. The calculation model is used to study the thermal characteristics of the surface of a ground target under overcast and rainy weather conditions, as well as the effects of rainfall intensity and wind direction on the temperature characteristics of the target surface (Fig.11, Fig.13). Results and Discussions The simulated value of the target surface temperature calculated by the integrated calculation model has a highly consistent trend with the measured value of the thermocouple, and the average absolute error of each surface during the 24-hour numerical calculation is 0.95 K; At the time of the rainfall, the temperature difference on the target surface is small, and due to the impact of rainfall and wind direction, the temperature on the windward side of the target is usually lower than the temperature on the leeward side due to the high rainfall capture rate; Changes in rainfall intensity, wind speed, and direction will affect the distribution of rainfall capture rate on the target surface (Fig.10, Fig.12), thereby affecting the distribution of surface temperature characteristics. Conclusions In this study, a calculation model of surface temperature of ground targets considering the coupling of wind-driven rain and moisture heat is presented for overcast and rainy weather conditions. This method uses a fully integrated three-dimensional numerical model to study the temperature distribution characteristics of ground targets and backgrounds, fully considering water and heat transfer. The calculation model can provide detailed spatial distributions of velocity, temperature, and humidity, which can be used to study the temperature distribution characteristics of ground targets affected by solar radiation, air humidity, wind speed, and wind direction under complex weather conditions. The model has reliability and good accuracy, and can provide methodological support for the thermal characteristics analysis of complex ground targets under cloudy and rainy weather conditions. -
Key words:
- rain /
- ground target /
- wind direction /
- rainfall intensity /
- thermal characteristic
-
图 2 阴雨天气复杂天候搭建的集成计算模型示意图
Figure 2. Schematic diagram of integrated calculation model built in overcast and rainy weather and complex weather
图 4 (a) CUBI模型试验图;(b) CUBI物理模型及网格划分
Figure 4. (a) CUBI model test diagram; (b) Physical model and meshing of CUBI
图 5 2022年6月28日阴天气象参数。 (a) 空气温度、比湿度;(b) 降雨强度;(c) 风速;(d) 太阳辐射
Figure 5. Meteorological parameters on June 28, 2022. (a) Air temperature, air specific humidity; (b) Precipitation intensity; (c) Wind speed; (d) Sun radiance
图 7 (a) 降雨强度1.2 mm/h的CUBI模型降雨捕获率分布图;(b) 试验拍摄CUBI模型降雨分布图
Figure 7. (a) The distribution of catch ratio for CUBI model rainfall intensity of 1.2 mm/h; (b) Test photography of CUBI model rainfall distribution map
图 8 (a) 背风面视角下CUBI模型温度分布;(b) 迎风面视角下CUBI模型温度分布
Figure 8. (a) Temperature distribution of CUBI model from leeward view; (b) Temperature distribution of CUBI model from the view of windward side
图 9 各表面计算温度与实测温度变化特性及其误差图。(a) 东面温度对比图;(b) 南面温度对比图;(c) 西面温度对比图;(d) 上面温度对比图
Figure 9. Variation characteristics of calculated and measured temperatures on each surface and their errors. (a) Comparison diagram of east temperature; (b) Comparison diagram of south temperature; (c) Comparison diagram of west temperature; (d) Comparison diagram of up temperature
图 10 降雨强度分别为1.2 mm/h、2.4 mm/h和3.6 mm/h CUBI模型顶面的降雨捕获率分布图
Figure 10. Rainfall capture rate of CUBI model top surface with rainfall intensity of 1.2 mm/h, 2.4 mm/h and 3.6 mm/h respectively
图 11 降雨阶段CUBI模型上面监测点温度对比图
Figure 11. Temperature comparison diagram of monitoring points on CUBI model in rainfall stage
图 12 (a)西南风向下CUBI模型的降雨捕获率分布图;(b) 西北风向下CUBI模型的降雨捕获率分布图
Figure 12. (a) Rainfall capture rate distribution of CUBI model in southwest wind direction; (b) Rainfall capture rate distribution of CUBI model in northwest wind direction
图 13 (a)西南风为主时CUBI模型24 h各表面温度特征;(b) 西北风为主时CUBI模型24 h各表面温度特征
Figure 13. (a) 24 h surface temperature characteristics of CUBI model when southwest wind is dominant; (b) 24 h surface temperature characteristics of CUBI model when northwest wind is dominant
图 14 西南风向、西北风向下CUBI模型的北面的温度特性及风速分布图
Figure 14. Temperature characteristics and wind speed distribution in the north of CUBI model in southwest and northwest wind directions
表 1 相关材料的热物性参数
Table 1. Physical parameters of materials
Materials Density
ρ/kg·m−3Specific heat
c/J·(kg·K)−1Thermal conductivity
λ/W·(m·K)−1Emissivity
εAlbedo
βQ235 steel 7850 540 44 0.72 0.88 Porous concrete 2200 966 1.28 0.92 0.6  下载: 导出CSV
表 2 风速转换公式
Table 2. Wind speed conversion formula
Wind direction $ \theta $/(°) Conversion formula 0≤$ \theta $<90 $( - { { { {U} }\cos} }(\theta - 90^\circ ), -{U} \sin(\theta - 90^\circ ),0)$ 90≤$ \theta $<180 $( - { {U \cos} }(\theta - 90^\circ ),U\sin(\theta - 90^\circ ),0)$ 180≤$ \theta $<270 $(U\sin(\theta - 180^\circ ),U\cos(\theta - 180^\circ ),0)$ 270≤$ \theta $<360 $(U \cos(\theta - 270^\circ ), - U \sin(\theta - 270^\circ ),0)$
下载: 导出CSV
-
[1] Sui Juncheng, Ren Dengfeng, Han Yuge. Inversion and model validation method of missing parameters in infrared modeling of ground targets [J]. Infrared and Laser Engineering, 2022, 51(10): 20220033. (in Chinese) doi: 10.3788/IRLA20220033 [2] Chen Jincheng, Han Yuge. Simplified analysis method of the surface temperature of complex structure camouflage screen with large surface [J]. Infrared and Laser Engineering, 2018, 47(3): 0304002. (in Chinese) doi: 10.3788/IRLA201847.0304002 [3] Lin Qunqing. Research on the effects of droplets and particles on thermal radiative characteristics of vehicles and credibility evaluation method for thermal radiation model[D]. Nanjing: Nanjing University of Science and Technology, 2018. (in Chinese) [4] Souri F, Ge H, Stathopoulos T. Wind-driven rain on buildings: Accuracy of the ISO semi-empirical model [J]. Journal of Wind Engineering and Industrial Aerodynamics, 2021, 212(13): 104606. [5] Kubilay A, Derome D, Blocken B, et al. Numerical simulations of wind-driven rain on an array of low-rise cubic buildings and validation by field measurements [J]. Building and Environ-ment, 2014, 81: 283-295. doi: 10.1016/j.buildenv.2014.07.008 [6] Chen Chao, Zhang Huibo, Qian Tianda. Semi-empirical model method analysis of wind-driven rain intensity on building walls [J]. Building Energy Efficiency, 2021, 49(10): 95-102. [7] Blocken B, Carmeliet J. Overview of three state-of-the-art wind-driven rain assessment models and comparison based on model theory [J]. Building & Environment, 2010, 45(3): 691-703. [8] Huang S H, Li Q S. Numerical simulations of wind-driven rain on building envelopes based on Eulerian multiphase model [J]. Journal of Wind Engineering and Industrial Aerodynamics, 2010, 98(12): 843-857. doi: 10.1016/j.jweia.2010.08.003 [9] Yuan An. Numerical calculation and analysis of wind driving rain based on euler multiphase flow model [J]. Scientific and Technological Innovation, 2022(5): 70-73. (in Chinese) [10] Franke J, Hellsten A, Schlunzen K H, et al. The COST 732 best practice guideline for CFD simulation of flows in the urban environment: a summary [J]. Int J of Environment and Pollution, 2011, 44(1-4): 419-427. doi: 10.1504/IJEP.2011.038443 [11] Kubilay A, Derome D, Carmeliet J. Coupled numerical simulations of cooling potential due to evaporation in a street canyon and an urban public square [J]. Journal of Physics Conference Series, 2019, 1343: 012016. doi: 10.1088/1742-6596/1343/1/012016 [12] Vujovic Svetlana, Haddad Bechara, Karaky Hamzé, et al. Urban heat island: causes, consequences, and mitigation measures with emphasis on reflective and permeable pavements [J]. Civil Eng, 2021, 2(2): 459-484. doi: 10.3390/civileng2020026 [13] Kubilay A, Derome D, Carmeliet J. Coupling of physical phenomena in urban microclimate: A model integrating air flow, wind-driven rain, radiation and transport in building materials [J]. Urban Climate, 2018, 24: 398-418. [14] Kubilay A, Derome D, Blocken B, et al. CFD simulation and validation of wind-driven rain on a building facade with an Eulerian multiphase model [J]. Building & Environment, 2013, 61(61): 69-81. [15] Defraeye T, Blocken B, Carmeliet J. An adjusted temperature wall function for turbulent forced convective heat transfer for bluff bodies in the atmospheric boundary layer [J]. Building & Environment, 2011, 46(11): 2130-2141. [16] Blocken B J E, Roels S, Carmeliet J E. A combined CFD–HAM approach for wind-driven rain on building facades [J]. Journal of Wind Engineering and Industrial Aerodynamics, 2007, 95(7): 585-607. doi: 10.1016/j.jweia.2006.12.001 -

 点击查看大图

计量
- 文章访问数: 116
- HTML全文浏览量: 19
- PDF下载量: 51
- 被引次数: 0

