


-
数字条纹投影技术由于其富有灵活性以及高精度等优点已广泛应用于生物医学监测、工业质量控制、计算机视觉、虚拟现实和文化遗产保护等多个领域[1-3]。由于投影仪在对8位正弦条纹投影时,投影速度会受到最大帧率的限制,并且商用投影仪存在非线性γ效应。为了避免非线性误差影响,需要对投影仪进行非线性校正。此外,数字条纹投影技术通过时间集成产生灰度图像,这意味着投影仪和相机之间需要精确同步才能保证测量结果具有较高准确度。为了克服这些问题,研究人员提出了二值离焦技术来改善投影效率、投影仪非线性误差和同步问题。2位的二值图像提升了投影效率,最高可以达到103帧/s。同时,二值图像的非连续性避免了投影仪非线性误差对测量结果的影响。利用二值离焦技术[4]使二值图案模拟正弦模式进行测量实现了测量速度的突破,也不需要非线性校准和严格的同步。然而,二值离焦技术不能实现与数字条纹投影技术相同的测量能力,体现在:1)受到高频谐波的影响,测量精度较低;2)投影仪必须准确离焦才可能得到高质量的测量,测量深度范围较小[5]。
为了解决上述问题,二值离焦技术的优化方法已经被广泛的研究,可以进一步分为一维(One Dimensional, 1D)优化方法和二维(Two Dimensional, 2D)优化方法。1D优化方法主要包括脉宽调制技术[6]、正脉宽调制技术[7]和最佳脉宽调制技术[8];2D优化方法主要包括区域调制技术[9]和抖动技术[10]。其中抖动技术可以减少高次谐波的影响,在二值离焦技术中具有良好的表现。常用的抖动算法有随机抖动、有序抖动和误差扩散抖动等。有序抖动将一个抖动模式的阈值二维模板与原图像上各像素灰度值进行比较,如果大于阈值,则将像素设置为1,否则为0,常见的方法有Bayer抖动算法[11]。误差扩散抖动将量化误差残差分配到未被处理的相邻像素,每个像素的输出值与自身灰度值以及周围像素导致的量化误差有关,常见的方法主要包括Floyd-Steinberg抖动[12]、Sierra抖动[13]等。抖动算法处理后的二值图案经离焦投影后可以得到高质量的正弦条纹。然而,如果测量深度范围较大,以上优化方法得到的测量结果仍受到明显影响。
为解决这一问题,研究人员提出了相位误差补偿算法[14],如希尔伯特三步和双三步相位轮廓测量[15],利用数学拟合模型来补偿相位误差以提高测量精度。此外,还提出了离焦度控制方法[16]和多频相位合并方法[17],两种方法都扩展了测量深度范围。其中,前者量化离焦度,优化并调整系统参数;后者确定频率最佳组合,合并多个二值条纹相位图。但离焦投影技术测量范围受限仍然是目前的技术挑战。
离焦投影技术的离焦程度与投影平面到焦平面的距离相关:随着深度的增加,图像对比度和信噪比逐渐降低。这导致图像质量下降,难以提取有效相位信息,从而限制了离焦投影技术的测量深度范围。通过分析发现对于不同频率的抖动条纹图像,经离焦投影后都存在一个对离焦量变化不敏感的区域。在该区域内,相位误差波动量极小,图像质量较为稳定,该区域称为离焦平缓区域。基于这个发现,文中提出了多频相位选择方法以克服离焦投影技术测量深度范围受限的问题。该方法主要步骤包括:1)通过分析不同离焦度下的相位误差分布来确定条纹的最佳离焦平缓区域;2)评估条纹最佳离焦平缓区域,确定不同离焦程度下的最佳频率模式;3)选择每个条纹频率下的最优抖动模式,用于大深度范围三维重建。所提出方法通过选择多频抖动条纹和测定不同离焦程度下的最佳频率,可以实现测量物体深度范围的扩展。
-
相移法以其操作简单、高效率、高精度等优点广泛应用于光学测量领域[18]。通常,标准N步相移算法的第n幅正弦条纹的光强分布表示为:
$$ {I}_{{n}}(x,y)={I}{{'}}(x,y)+{I}{''}(x,y)\mathrm{cos}\left[\phi (x,y)+2\pi n/N\right] $$ (1) 式中:n=1,2,3···, N,(x, y)为图像像素位置;I′(x, y)为背景光强;I″ (x, y)为调制强度;φ(x, y)为包含被测物体深度信息的折叠相位。φ(x, y)求解公式可表示为:
$$ \varphi (x,y) = \arctan \left[\frac{{\displaystyle\sum\nolimits_{n = 1}^N {{I_n}(x,y){{\sin(2n}}\pi /N )} }}{{\displaystyle\sum\nolimits_{n = 1}^N {{I_n}(x,y){{\cos(2n}}\pi /N{\text{)}}} }}\right] $$ (2) 由公式(2)得到的相位值范围为[−π,π],跳变为2π。这里采用四步相移法,可以消除检测器偶次谐波。其连续、完整的相位值ϕ(x, y)可表示为:
$$ \phi (x,y) = 2\pi k(x,y) + \varphi (x,y) $$ (3) 式中:k(x, y)为(x, y)处的条纹级次。这里采用最佳三频率相位展开算法[19],对得到的折叠相位进行展开。
-
在常用的图像抖动算法中,Bayer抖动算法和误差扩散抖动算法由于其简单、快速及高精度的特点而得到了广泛的应用[20]。
Bayer抖动算法将原始图像与一个被称为抖动模式的二维矩阵内核中对应阈值进行比较,完成原始图像每个像素的量化。当矩阵大小是2N(N是一个整数)时,通过应用低通滤波器,可以更有效地抑制抖动模式的噪声,得到更接近原始图像的图案。Bayer抖动模式可以使用以下方程式来生成:
$$ {M_{n + 1}} = \left[ {\begin{array}{*{20}{c}} {\begin{array}{*{20}{c}} {4{M_n}}&{4{M_n} + 2{U_n}} \end{array}} \\ {\begin{array}{*{20}{c}} {4{M_n} + 3{U_n}}&{4{M_n} + {U_n}} \end{array}} \end{array}} \right] $$ (4) 式中:Mn均为2n×2n的方阵;Un的所有元素都是1。这里使用N=4的Bayer模式。
误差扩散抖动技术与Bayer抖动技术相比更加复杂,它按特定的顺序对原始图像每个像素进行量化,并将量化误差传播到相邻未处理像素点上。其原理可表示为:
$$ I'(i,j) = I(i,j) + \sum\limits_{m,n \in S} {h(m,n) \times e(i - m,j - n)} $$ (5) 式中:I′ (i, j)表示原图像在(i, j)像素位置加上周围像素带来的量化误差后的灰度值;h(m, n)表示抖动算法误差扩散的核函数;(m, n)表示核函数中的位置坐标;I(i, j)表示原图像(i, j)位置像素灰度值;е(i, j)表示量化误差,通过核函数传递到相邻像素。文中使用一种应用非常广泛的Floyd-Steinberg抖动算法,其误差扩散核函数可表示为:
$$ h(m,n) = \frac{1}{{16}}\left[ {\begin{array}{*{20}{c}} {\begin{array}{*{20}{c}} * \\ * \\ 3 \end{array}}&{\begin{array}{*{20}{c}} * \\ X \\ 5 \end{array}}&{\begin{array}{*{20}{c}} * \\ 7 \\ 1 \end{array}} \end{array}} \right] $$ (6) 式中:矩阵内外相乘后得到的数字表示对应位置误差扩散的比例;X表示当前处理的像素;符号“*”表示已扫描过的像素。
-
投影镜头在离焦状态下,可视为一个低通高斯滤波器。高斯函数的调制及其傅里叶变换形式如下:
$$ G(x,y)=\frac{1}{2\pi {\sigma }^{2}}{{\rm{e}}}^{-\tfrac{{x}^{2}+{y}^{2}}{2{\sigma }^{2}}}\stackrel{}{\rightleftharpoons }G(\omega )={{\rm{e}}}^{-\tfrac{{\sigma }^{2}{\omega }^{2}}{2}} $$ (7) 式中:σ为离焦核,与投影仪镜头的离焦程度有关。
如图1所示,当投影仪镜头光轴与焦平面垂直时,离焦核σ与投影平面和焦平面的间距u之间存在线性关系,可表示为:
$$ \sigma = kR(u) = k\left[ {\left| {D\left( {\frac{u}{{{u_f}}} - 1} \right)} \right| + \frac{{ru}}{v}} \right] $$ (8) 式中:k为系数;R(u)为投影平面上模糊点的半径;r为数字微镜器件(Digital Micromirror Devices, DMD)单元的给定像素的半径;D为投影仪镜头的半径;u为投影平面与焦平面的距离;v为投影仪镜头与DMD之间的距离。如图2所示,当投影平面与焦平面的距离u越大,离焦核σ越大,投影仪的离焦程度随之增强。

图 1 投影仪的离焦程度与深度u的关系
Figure 1. Relationship between the defocus effect of the projector and the depth u
基于上述离焦模型,可以发现随着深度u的增加,图像的对比度和信噪比均会下降。在达到某一个临界点后,图像的相位信息趋于不可靠状态,导致了系统可测量深度范围的限制。为解决这一问题,文中提出了多频相位选择方法来扩展离焦技术的可测量深度范围。

图 2 离焦核σ与深度u的关系(u1<u2<u3<uf<u4< u5<u6)
Figure 2. Defocus kernel curve as a function of depth u (u1<u2<u3<uf<u4<u5<u6)
-
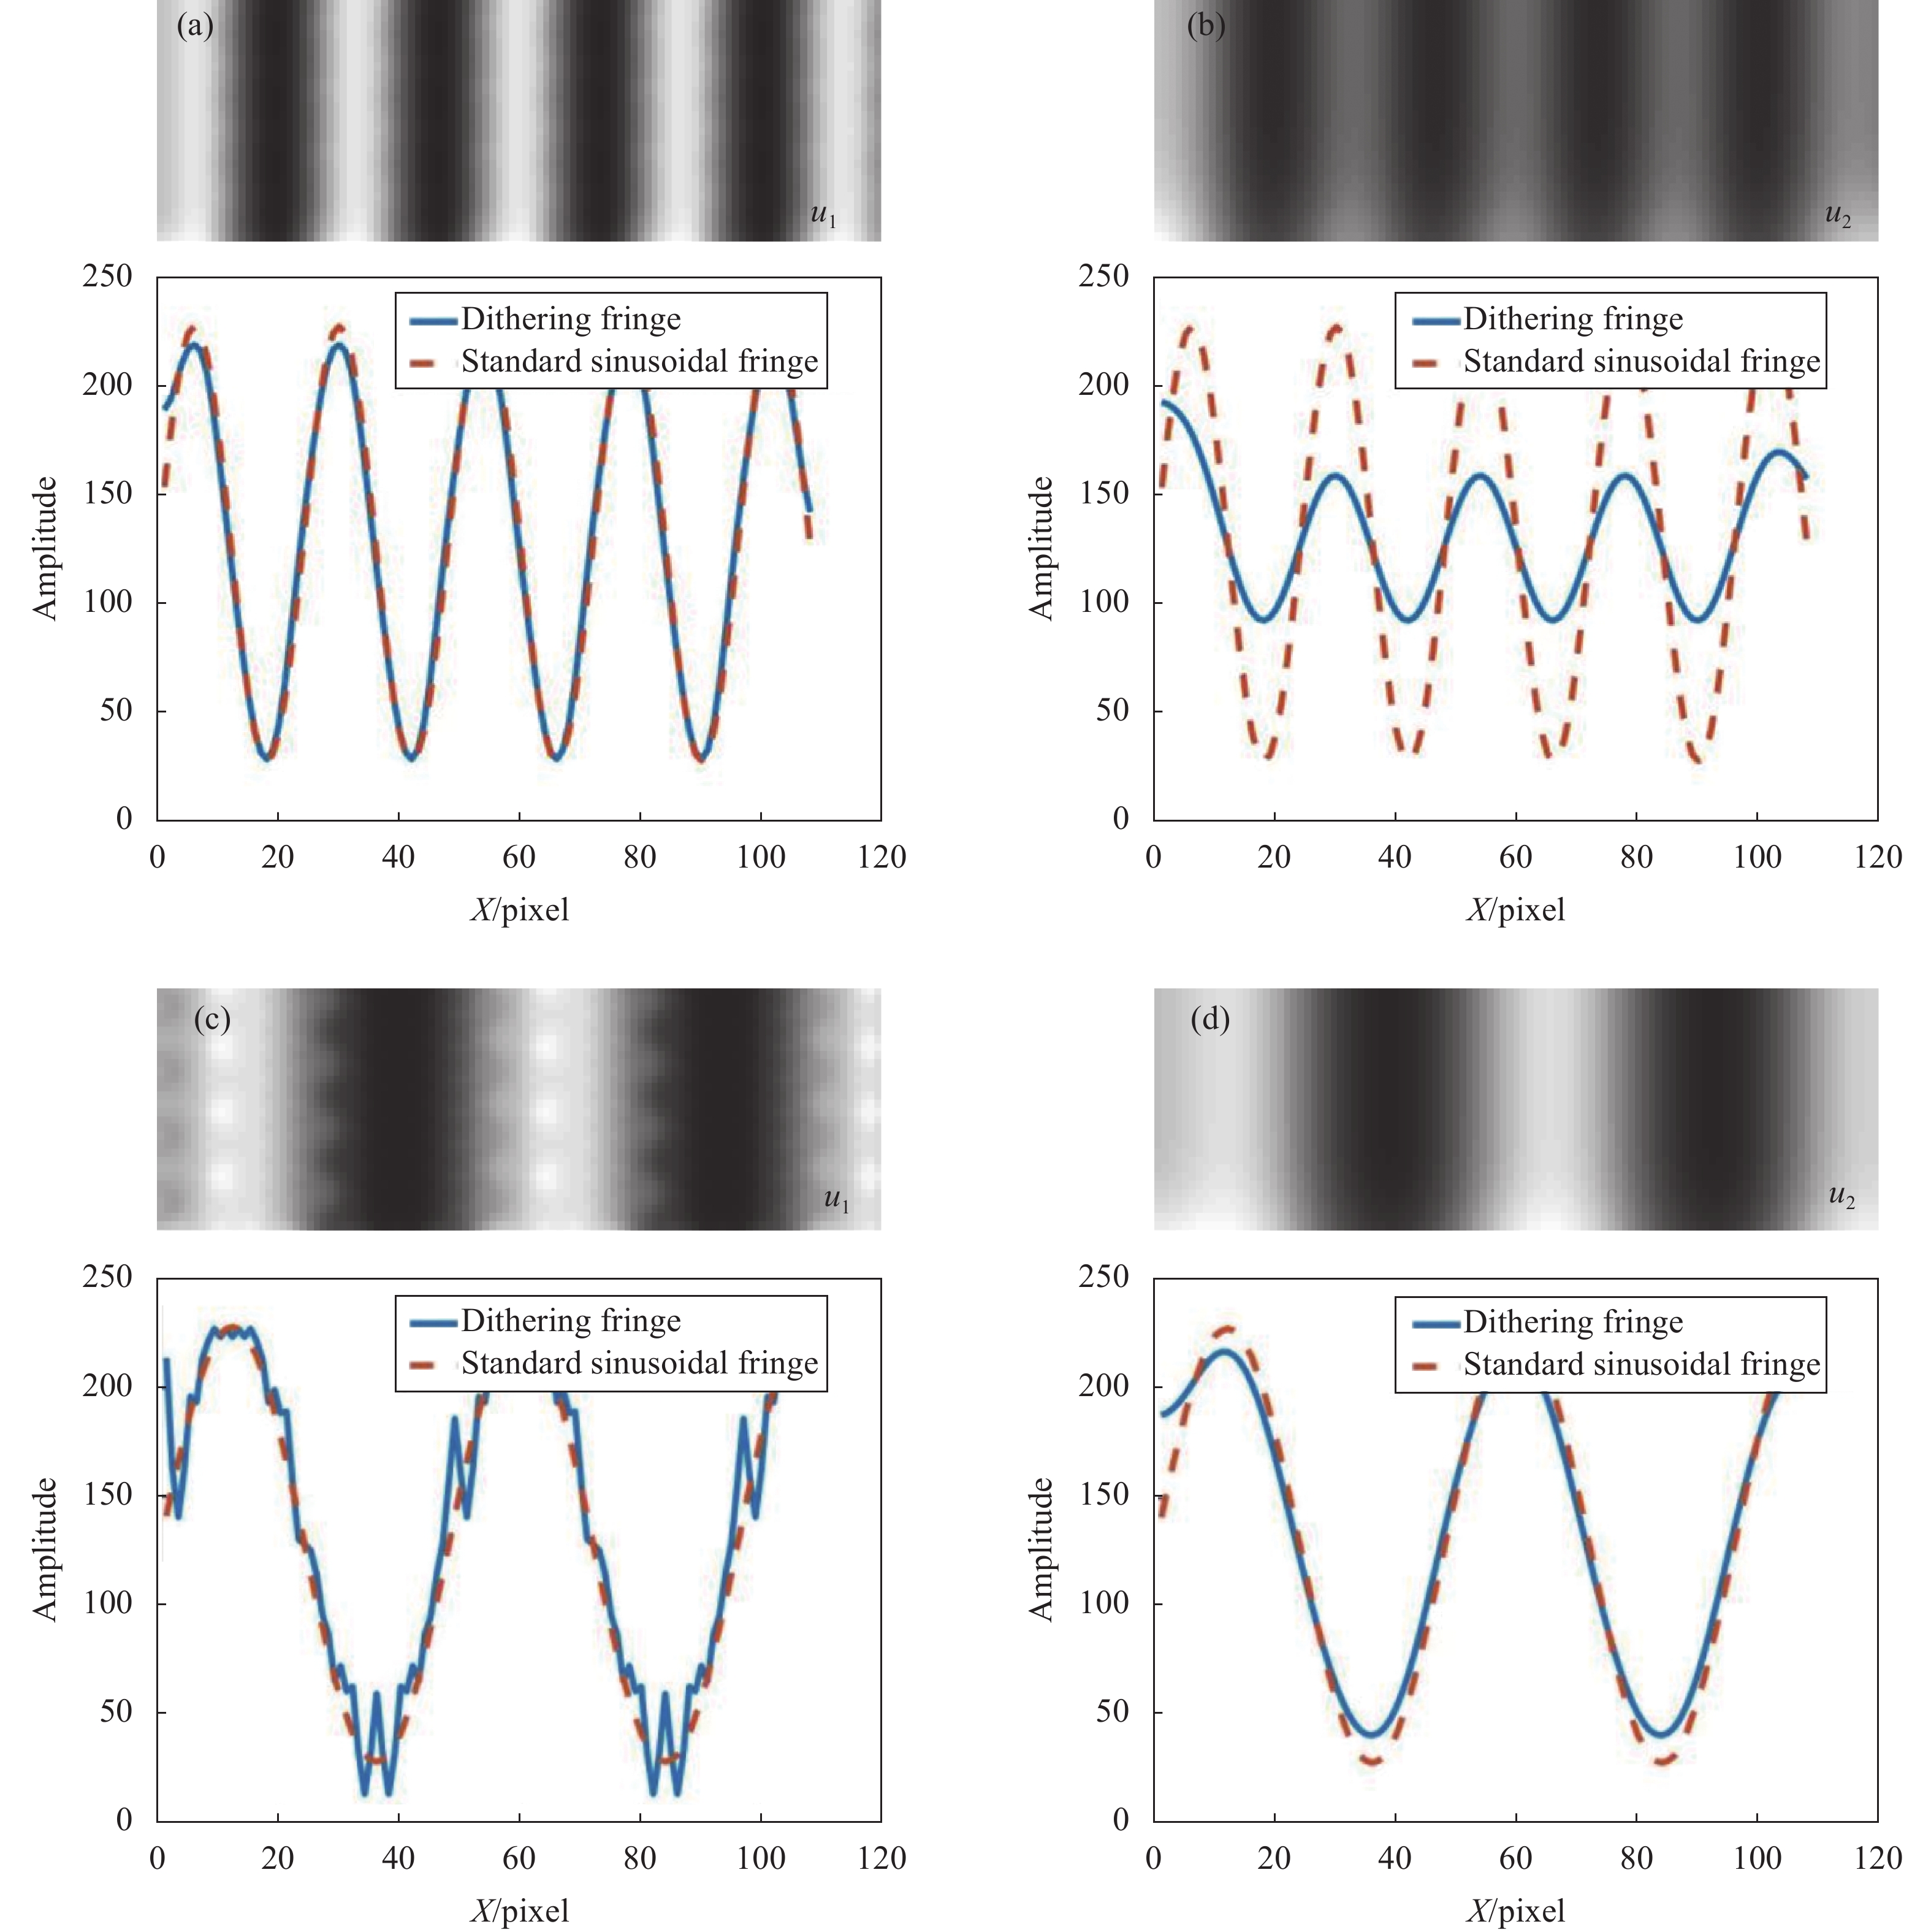
对于单频抖动条纹图案,随着离焦程度从轻度离焦过渡到中度离焦,再过渡到过度离焦,图像对比度和信噪比会逐渐下降。如图3所示,T1和T2分别代表单个周期像素为24和48的抖动条纹;u1和u2代表两种不同的深度范围,并且u1<u2。通过对比周期T1、T2下抖动条纹图案的垂直截面方向的灰度值变化,可以看到:图3(a)中,周期为T1的条纹在深度u1处,灰度值变化曲线与正弦条纹类似,且图像质量较好,处于中度离焦的状态;在深度u2处,如图3(b)所示,虽然灰度值变化曲线仍具有正弦性,对应图案信噪比过低,处于过度离焦状态。图3(c)中,周期为T2的条纹在深度u1处,虽然图像质量较好,但灰度值变化曲线正弦性较差,峰值处灰度值变化较为剧烈,处于轻度离焦的状态;在深度u2处,如图3(d)所示,灰度值变化曲线呈现较好的正弦性,图像质量较好,处于中度离焦的状态。这表明不同频率抖动条纹图案的离焦程度随深度变化的节点不完全一致,通过判断不同频率条纹的节点位置,可以确定各频率条纹的离焦平缓区域。文中可以利用这个特点,结合多个频率不同的条纹,实现离焦投影技术测量深度范围的扩展。

图 3 不同深度情况下,抖动条纹图像及条纹截面图(u1< u2):(a) T1=24 pixel,中度离焦;(b) T1=24 pixel,过度离焦;(c) T2=48 pixel,轻微离焦;(d) T2=48 pixel,中度离焦
Figure 3. Under the different depth of dither fringes pattern and pattern cross section diagram (u1<u2): (a) T1=24 pixel, moderate defocus; (b) T1=24 pixel, excessive defocus; (c) T2=48 pixel, slight defocus; (d) T2=48 pixel, moderate defocus
-
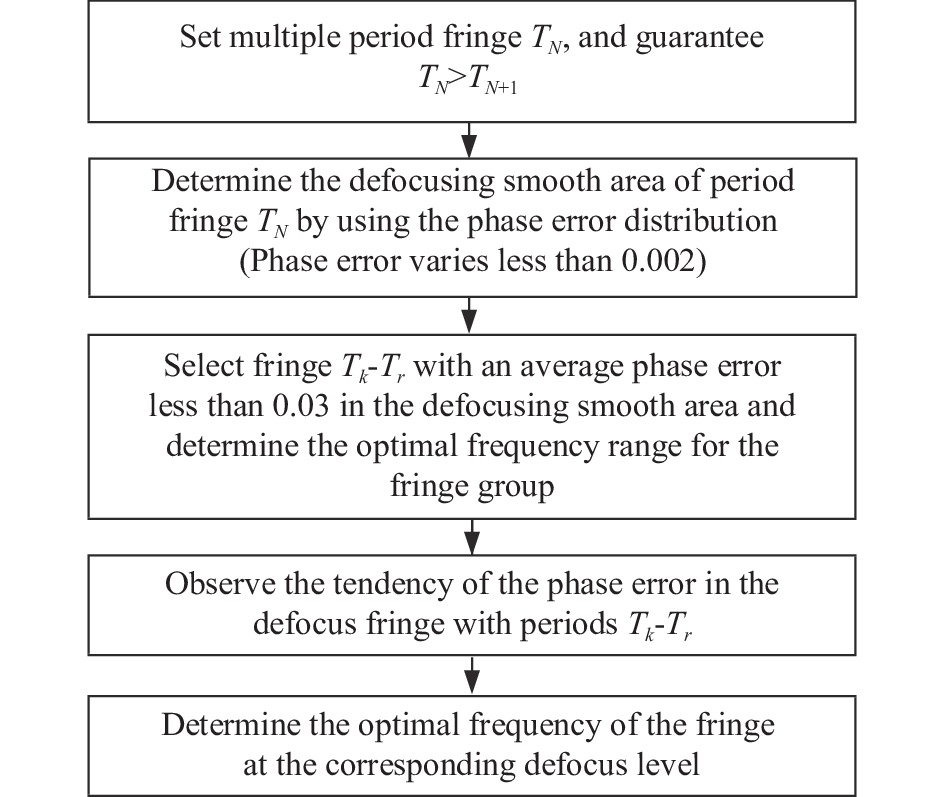
文中设计了一种抖动条纹的最佳频率模式测定算法,具体测量流程如图4所示。

图 4 确定最佳频率模式流程图
Figure 4. Flowchart of the optimal frequency mode determination
首先,采用四步相移算法生成N组频率从高到低变化的抖动条纹图案,最大周期设为Tn。其次,为模拟不同深度范围内的离焦效应,使用具有不同离焦核的高斯滤波器生成抖动条纹图案。以计算得到的相位均方根误差作为评价标准,当相位误差波动量小于0.002时,认为相位均方根误差较为稳定,则判断其对应区域为离焦平缓区域。然后,设置最大误差阈值为0.03,在离焦平缓区域中选择平均相位误差小于0.03的条纹模式作为最佳选择频率范围。这一步可以保证筛选得到相位误差始终保持低位平稳的高质量条纹图案。最后,观察最佳选择频率范围内的离焦条纹误差变化情况,从而确定测量位置应投影的最佳频率条纹。
为了验证所提方法的有效性,进行了仿真实验。仿真条纹使用的周期范围为[12,60] pixel、步进为2的条纹图案。高斯滤波器大小fs设计为[1,51] pixel、步进为2,滤波器的标准差为fs /6,表示从轻度离焦到过度离焦的不同离焦程度。首先采用四步相移算法计算出折叠相位,再采用最佳三频率相位展开算法得到展开相位。通过与理想正弦波产生的理想相位值进行比较,得到相位均方根误差分布。
图5是Bayer抖动条纹在[12,60] pixel区间内的筛选结果。如图5(a)是周期为[50,60] pixel范围内的抖动条纹图案在滤波器大小为[0,50] pixel下的相位误差分布。根据频率选择原则,滤波器大小为[20,40] pixel的变化区间内,频率在[52,60] pixel的抖动条纹相位误差波动量小于0.002,得到图5(b)所示结果。Bayer抖动条纹最佳频率模式如图5(c)所示。由图可知,在高斯滤波器大小为[21,39] pixel的区间范围内,条纹周期范围为[56,60] pixel的Bayer抖动图像具有优越的测量能力。

图 5 Bayer抖动条纹最佳频率模式的仿真结果:(a) 不同条纹频率下,相位误差与滤波尺寸的关系;(b) 最佳选择频率范围及其离焦平缓区域;(c) Bayer抖动条纹的最佳频率模式
Figure 5. Simulation results of the optimal frequency mode of Bayer-dithered pattern: (a) Under the different frequency fringe of phase error as a function of filter size; (b) The optimal frequency range and its defocusing smooth area; (c) The optimal frequency mode of Bayer-dithered pattern
Floyd-Steinberg抖动条纹也依照此方法进行分析,如图6(c)所示,在高斯滤波器大小为[15,41] pixel的区间范围内,条纹周期范围为[42,60] pixel的Floyd-Steinberg抖动图像具有优越的测量能力。图像具有优越的测量能力。
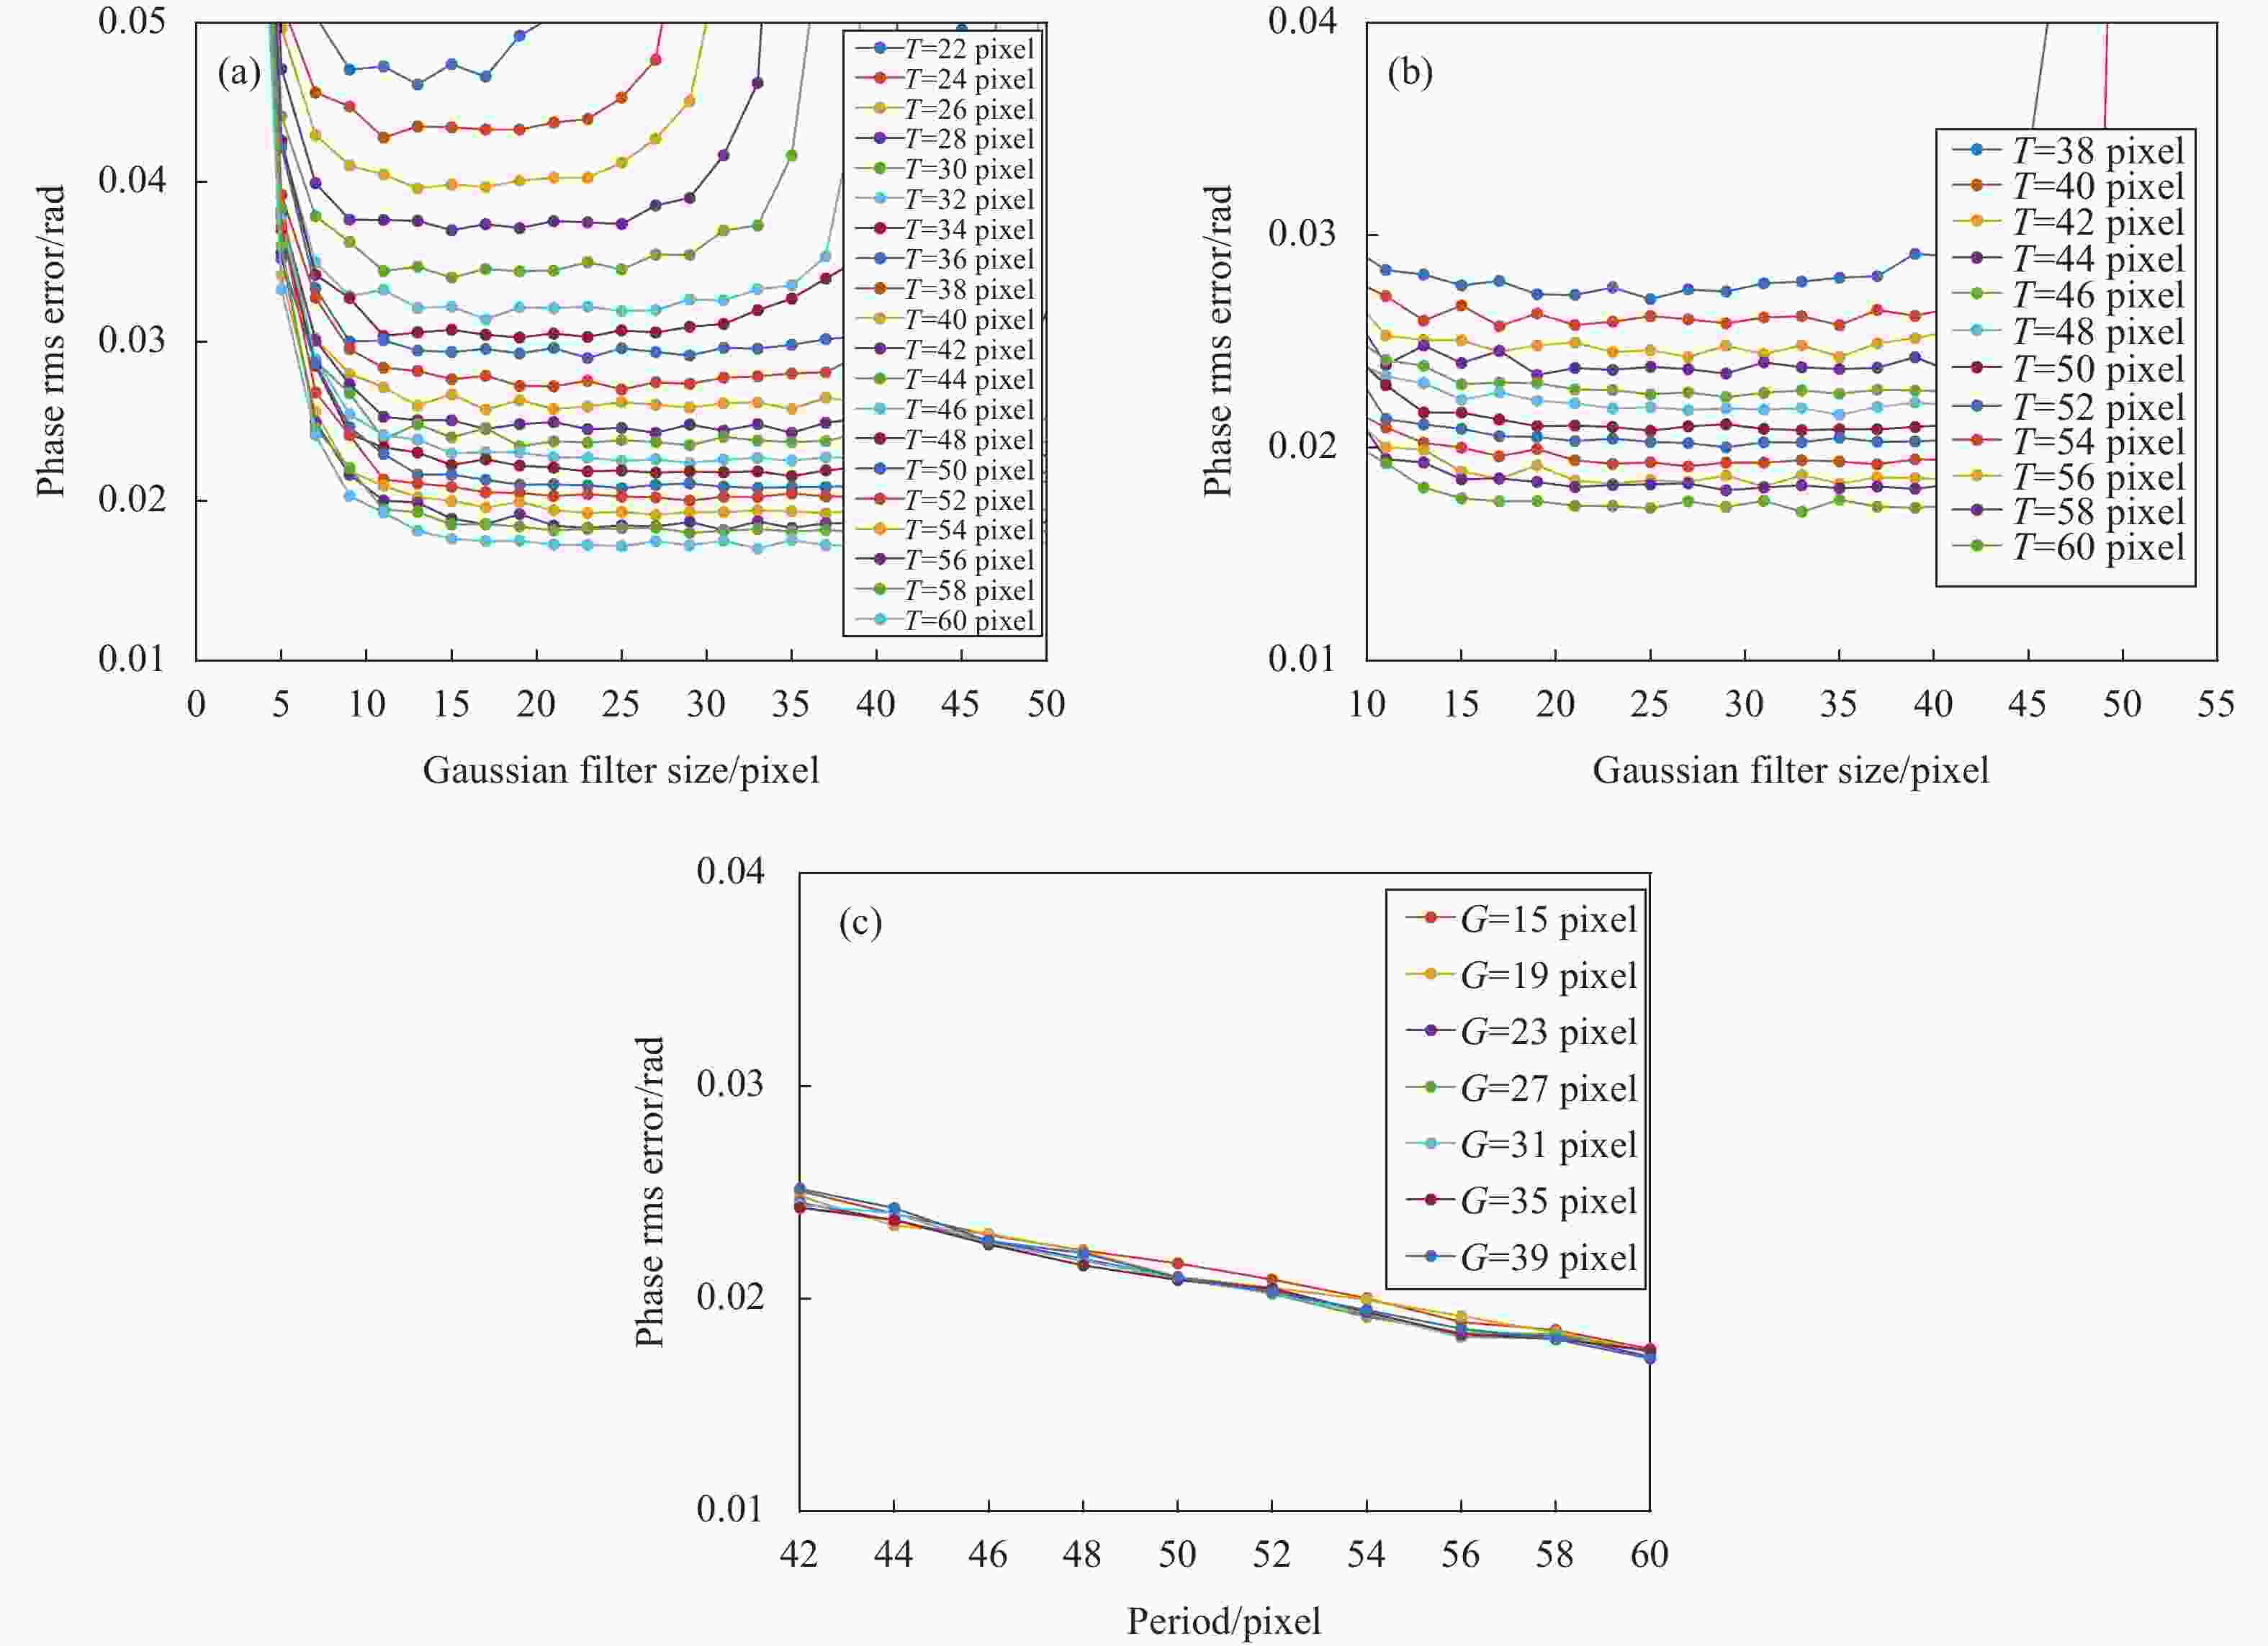
图 6 Floyd-Steinberg抖动条纹最佳频率模式的仿真结果:(a) 不同条纹频率下,相位误差与滤波尺寸的关系;(b) 最佳选择频率范围及其离焦平缓区域;(c) Floyd-Steinberg抖动条纹的最佳频率模式
Figure 6. Simulation results of the optimal frequency mode of Floyd-Steinberg dithering pattern: (a) Under the different frequency fringe of phase error as a function of filter size; (b) The optimal frequency range and its defocusing smooth area; (c) The optimal frequency mode of Floyd-Steinberg-dithered pattern
Bayer抖动算法与Floyd-Steinberg抖动算法,本质上都是一种基于区域的抖动算法。抖动图像的质量除了受抖动算法影响外,还受到扫描路径是影响。为了获得尽可能高质量正弦结构的二值图案,在最佳频率模式的选择结果的基础上,使用了8种不同的扫描顺序,选择出每个条纹频率下的最优抖动模式,如表1所示,其中,B表示Bayer抖动算法,F表示Floyd-Steinberg抖动算法。后续实验将参照表1的结果对抖动图像进行调制。
表 1 最佳频率的最优抖动模式
Table 1. Optimal dither mode for optimal frequency
T/pixel 42 48 54 60 Dithering method F F B B Order 


-
所提多频相位选择方法将在离焦条纹投影三维形貌测量系统中进行验证。系统包括DLP投影仪(DLP LightCrafter™ Pro4500)和数字CMOS相机(XIMEA xiQ MQ042 CG-CM)。相机镜头为标准定焦镜头(AZURE-1620 ML5M),焦距为16 mm。相机分辨率为2 048 pixel×2 048 pixel,投影仪分辨率为1280 pixel×800 pixel。测量系统的硬件设置如图7所示。

图 7 实验系统硬件设置图
Figure 7. The hardware setup of the experimental system
仿真实验表明,周期范围在[42,60] pixel的条纹可以有效地扩展深度范围。为了验证这一点,利用白板在相对大的深度范围内评估相位误差。将原深度设置为投影焦平面,白板放置在深度为10~50 cm的测量范围内,每个位置间的测量范围内,每个位置间隔为2.5 cm。测量的17个位置包括了从轻微离焦的到过度离焦的深度。将同周期正弦条纹12步相移算法计算的结果作为参考相位与抖动条纹测量结果进行比较可以得到相位误差。实验结果表明,周期范围在[42,60] pixel的条纹图像在距离投影仪焦平面[20,42.5] cm范围内能取得较好的测量效果,与仿真结果相符。
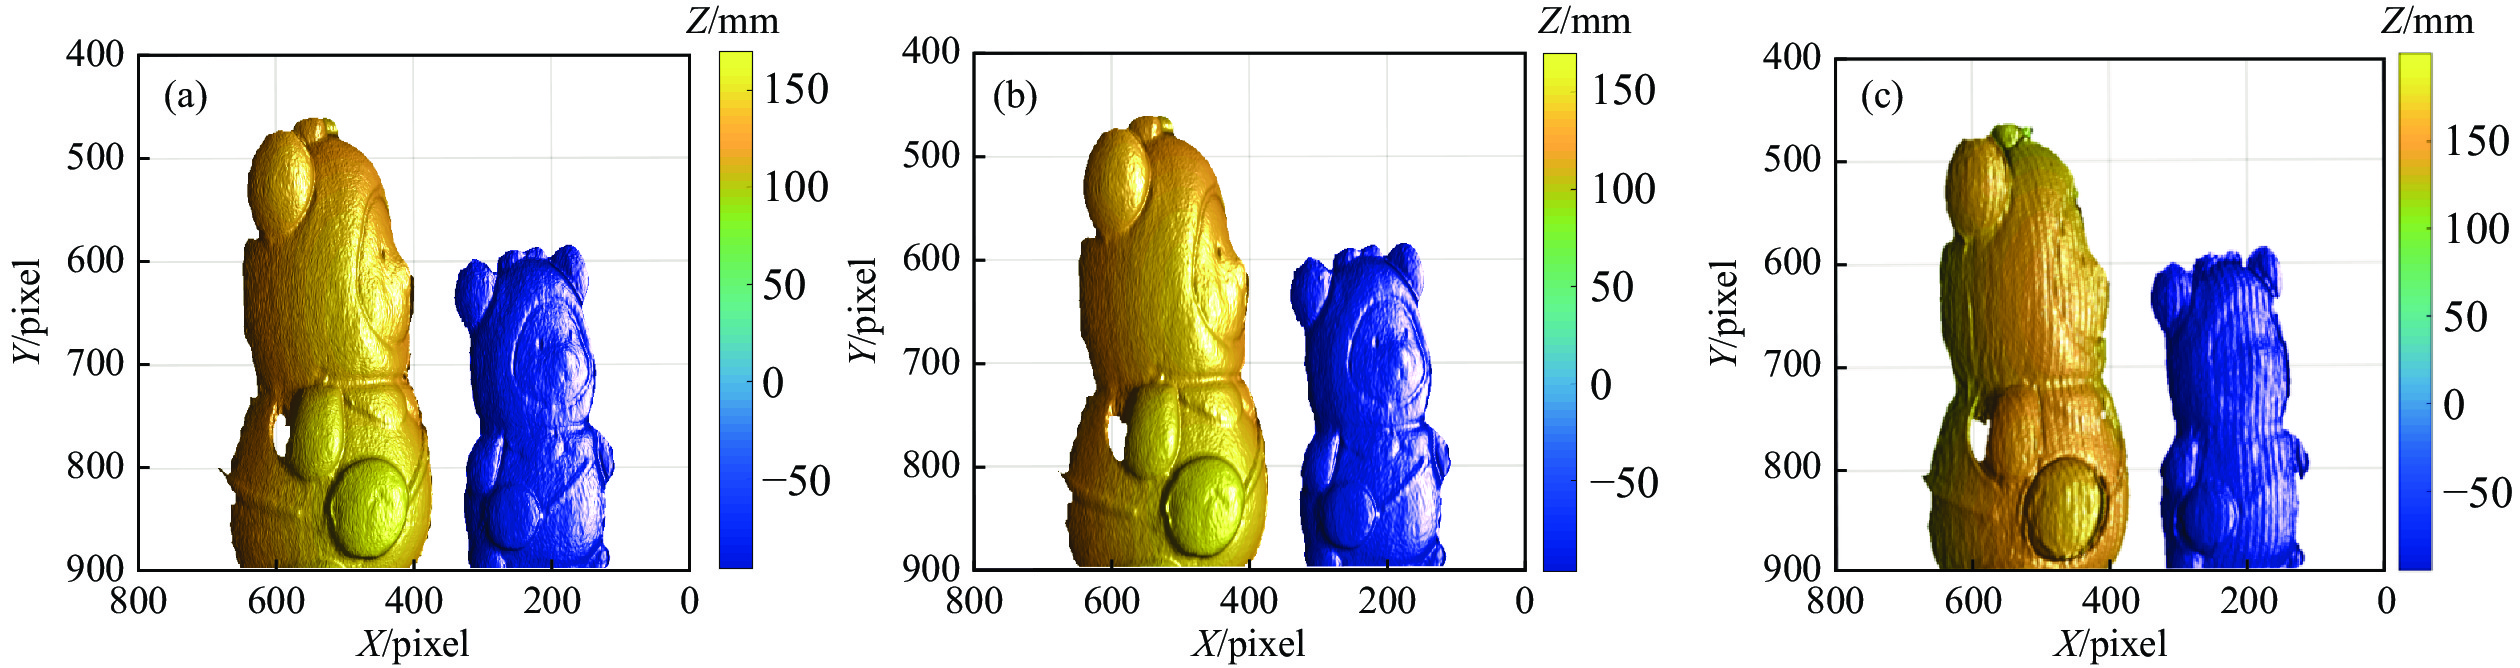
为了获得比较直观的可视化结果,以验证所提出方法的有效性。文中对大深度范围内的复杂物体进行了测量实验,将第一个小熊雕塑放置在距离焦平面20 cm的深度,第二个小熊雕塑放置在距焦平面42.5 cm的深度位置,如图8(a)所示。实验中,选择周期为42 pixel的Floyd-Steinberg抖动条纹、周期为60 pixel的Bayer抖动条纹以及对应的标准正弦条纹。图8(b)为拍摄到的其中一幅四步相移图像,图8(c)为利用四步相移法求解的折叠相位,最终获得的被测物体三维重建结果如图9所示。

图 8 多频相位选择方法测量物体:(a) 被测物体;(b) 一幅四步相移图像;(c) 被测物体的折叠相位
Figure 8. Measurement of objects with multi-frequency phase selection approach: (a) Object to be measured; (b) One of four-step phase-shifting fringe pattern; (c) Unwrapped phase of the measured object

图 9 大深度范围的物体的三维重建结果:(a) T=42 pixel,Floyd-Steinberg抖动条纹;(b) T=60 pixel,Bayer抖动条纹;(c) T=60 pixel,标准正弦条纹
Figure 9. Three-dimensional reconstruction results for the object in a large depth range: (a) T=42 pixel, Floyd-Steinberg dithering pattern; (b) T=60 pixel, Bayer dithering pattern; (c) T=60 pixel, standard sinusoidal fringe
文中所提方法测量的小熊雕塑如图9(a)、(b)所示,采用标准正弦条纹测量的结果如图9(c)所示。由图可见,采用四步相移算法的标准正弦条纹的测量恢复结果较差,形状大致可见,但小熊的面部和衣领信息模糊,成像效果不佳。文中所提方法选择的抖动条纹恢复的小熊雕像面部和衣领细节清晰可见,且物体表面光滑,成像效果较好。由此可以看出,文中提出的方法在恢复物体的细节方面具有良好的表现,证明了该方法的有效性。
同时,利用深度已知的标准台阶进一步验证并评价了方法精度,先后将台阶放置在距焦平面20 cm和42.5 cm深度的两个位置,利用周期为42 pixel的Floyd-Steinberg抖动条纹、周期为60 pixel的Bayer抖动条纹分别重建台阶三维形貌。表2为应用所提方法重建标准台阶中间三层台阶平面的测量结果,其中B、C、D依次代表一层台阶平面。实验结果表明,利用所提方法测量相邻台阶间的距离,其测量精度与现有正弦条纹测量方法[1]相当。该方法能够直接重建大深度物体的三维形状,具有较高的精度。
表 2 标准台阶平面的测量结果(单位:mm)
Table 2. Measurement results of standard step plane (Unit: mm)
Depth place Plane difference Actual depth Measured depth Absolute error T=42 pixel
Floyd-SteinbergT=60 pixel
BayerT=42 pixel
Floyd-SteinbergT=60 pixel
Bayer20 cm B-C 18.422 18.397 18.455 0.025 0.033 C-D 13.258 13.228 13.291 0.030 0.033 42.5 cm B-C 18.422 18.453 18.395 0.031 0.027 C-D 13.258 13.226 13.229 0.032 0.029 -
文中提出了一种基于抖动算法的多频相位选择方法。该方法通过对比多个离焦程度下图像展开相位的误差分布与相应频率选择范围,确定不同离焦程度下条纹频率的最优选择, 有效扩展了离焦投影技术的测量深度,解决了大深度范围的物体测量问题。实验结果表明,对于深度为22.5 cm被测物体,所恢复的三维形貌轮廓清晰、细节完整且表面较为光滑,具有良好的表现。同时,根据文中的对比实验可知,对被测物体投射同样数量的条纹图像,通过分析物体三维形貌结果,发现文中提出的多频相位选择方法选择的抖动条纹所恢复的物体表面没有明显水波纹,说明所提方法有效地减小了商用投影仪非线性效应对三维成像结果的影响。最后,对非连续台阶进行了测量,文中所提方法测量的最大绝对误差为0.033 mm,与现有正弦条纹方法[1]相比测量精度一致。实验结果表明,该方法对大深度物体的细节恢复效果良好,在扩展测量范围的同时保证了测量精度。由于实验场地限制,影响系统标定的范围,目前该方法只完成了小体积物体测量,将在后续的研究中解决大体积物体三维测量的难题。同时,该方法仅有效地抑制了投影仪的非线性效应,未考虑相机非线性效应带来的干扰,未来有待进一步改进。
Depth range enhancement of three-dimensional profiling measurement technology based on dithering algorithms
-
摘要: 数字条纹投影技术由于其非接触、测量精度高等特点在生物医学监测、虚拟现实以及计算机视觉等领域中应用越来越广泛。但其仍存在一定局限性,例如测量深度范围受限和投影仪存在非线性误差。二值离焦技术很好地克服了条纹投影三维测量中的非线性问题,但二值图像的高次谐波分量会造成测量误差。文中提出一种基于抖动算法的多频相位选择方法,该方法利用离焦抖动技术减少二值图像的高次谐波,避免投影仪非线性误差的影响;同时采用不同抖动算法及扫描方向调制得到二值图像,通过对比周期为12~60 pixel范围内的条纹图像在25个离焦程度下的展开相位误差分布,筛选出相应图像频率的离焦选择范围,最终确定不同离焦程度下条纹频率的最优选择。对于深度为22.5 cm被测物体进行了实验,正确恢复了大深度物体的三维形貌。实验结果表明:文中所提出的方法能有效地扩展测量深度范围,从而实现大深度范围被测物体的三维形貌测量。Abstract:
Objective With the rapid development of modern information technology, optical three-dimensional (3D) profiling measurement technology has gradually matured. Among numerous optical 3D profiling measurement technologies, due to its non-contact and high-accuracy measurement, digital fringe projection(DFP) technology is increasingly applied in the fields such as biomedical monitoring, virtual reality, and computer vision, and has broad prospects for development due to its non-contact and high measurement accuracy. However, this technology still faces some technical challenges: 1) Due to the limited depth of field of the system equipment (such as cameras and projectors), only the 3D shape of objects within a limited depth of field can be reconstructed; 2) Nonlinearity problems caused by the γ-effect of commercial projectors may affect measurement accuracy. To overcome these problems, this paper proposes a method to extend the measurement depth range, which can achieve high-accuracy measurement of multiple objects at different depths or objects with a large depth range. Methods The paper proposes a novel method for measuring the 3D shape of objects with a large depth range. Firstly, defocus technique is used to measure the dithering pattern in a simulated sinusoidal mode, avoiding the influence of projector non-linear errors on 3D measurement of fringe projection and increasing the measurement speed. Then, by analyzing the relationship between the degree of defocusing of the fringe and the depth (Fig.1-2), this paper analyses the relationship between fringe defocus and depth and finds that the defocus degree of fringes at different frequencies is inconsistent with the depth variation nodes. Based on this, a multi-frequency phase selection method is proposed in this paper. The optimal frequency mode determination algorithm (Fig.4) is used to select the bayer dithering algorithm and the floyd-steinberg dithering algorithm to generate dithering patterns. After comparing the phase error distribution of the fringe images within the range of 12-60 pixel in period at 25 defocus levels, the defocusing selection range of the corresponding fringe frequency is screened to determine the optimal selection of fringe frequency at different defocusing degrees. Then, in order to obtain a binary pattern with the highest quality sinusoidal structure, 8 different scanning orders are used based on the selection results of the optimal frequency mode which is to select the optimal dithering mode for the current frequency (Tab.1). Finally, the method uses the selected dithering fringe pattern within the optimal frequency range to obtain the 3D shape of the object. The proposed method can extend the measurement range of object depth by selecting multi-frequency dithering fringe and determining the optimal frequency at different defocus degrees. Results and Discussions This paper presents qualitative and quantitative comparison experiments between the standard sinusoidal fringe and the proposed method. In the qualitative experiment, both methods are used to reconstruct the 3D shape of an object with a depth of 22.5 cm (Fig. 9). The measurement results of the proposed method are better than those of the standard sinusoidal fringe method with complete shape, clear details and without ripple phenomenon. Moreover, in the quantitative experiment, the maximum absolute error of the proposed method is 0.033 mm (Tab.2), which is comparable to the measurement accuracy of traditional DFP technology. Therefore, the proposed method not only ensures measurement accuracy but also extends the measurement depth range, and effectively solves the problem of measuring the 3D shape of objects with a large depth in the DPF field. Conclusions This paper proposes a MFPS method based on dithering algorithms to solve the limited measurement depth range and nonlinearity problem of the existing DFP technology. By using defocusing dithering techniques, the impact of projector nonlinearity error is overcome. Moreover, the MFPS method is used to generate dithering fringe patterns for measurement, which extends the measurement depth range. Experimental results demonstrate that the proposed method effectively extends the measurement depth range and achieve 3D shape measurements of objects in a large depth range. -
Key words:
- three-dimensional measurement /
- fringe projection /
- defocusing /
- dithering /
- phase shift
-
图 1 投影仪的离焦程度与深度u的关系
Figure 1. Relationship between the defocus effect of the projector and the depth u
图 2 离焦核σ与深度u的关系(u1<u2<u3<uf<u4< u5<u6)
Figure 2. Defocus kernel curve as a function of depth u (u1<u2<u3<uf<u4<u5<u6)
图 3 不同深度情况下,抖动条纹图像及条纹截面图(u1< u2):(a) T1=24 pixel,中度离焦;(b) T1=24 pixel,过度离焦;(c) T2=48 pixel,轻微离焦;(d) T2=48 pixel,中度离焦
Figure 3. Under the different depth of dither fringes pattern and pattern cross section diagram (u1<u2): (a) T1=24 pixel, moderate defocus; (b) T1=24 pixel, excessive defocus; (c) T2=48 pixel, slight defocus; (d) T2=48 pixel, moderate defocus
图 5 Bayer抖动条纹最佳频率模式的仿真结果:(a) 不同条纹频率下,相位误差与滤波尺寸的关系;(b) 最佳选择频率范围及其离焦平缓区域;(c) Bayer抖动条纹的最佳频率模式
Figure 5. Simulation results of the optimal frequency mode of Bayer-dithered pattern: (a) Under the different frequency fringe of phase error as a function of filter size; (b) The optimal frequency range and its defocusing smooth area; (c) The optimal frequency mode of Bayer-dithered pattern
图 6 Floyd-Steinberg抖动条纹最佳频率模式的仿真结果:(a) 不同条纹频率下,相位误差与滤波尺寸的关系;(b) 最佳选择频率范围及其离焦平缓区域;(c) Floyd-Steinberg抖动条纹的最佳频率模式
Figure 6. Simulation results of the optimal frequency mode of Floyd-Steinberg dithering pattern: (a) Under the different frequency fringe of phase error as a function of filter size; (b) The optimal frequency range and its defocusing smooth area; (c) The optimal frequency mode of Floyd-Steinberg-dithered pattern
图 8 多频相位选择方法测量物体:(a) 被测物体;(b) 一幅四步相移图像;(c) 被测物体的折叠相位
Figure 8. Measurement of objects with multi-frequency phase selection approach: (a) Object to be measured; (b) One of four-step phase-shifting fringe pattern; (c) Unwrapped phase of the measured object
图 9 大深度范围的物体的三维重建结果:(a) T=42 pixel,Floyd-Steinberg抖动条纹;(b) T=60 pixel,Bayer抖动条纹;(c) T=60 pixel,标准正弦条纹
Figure 9. Three-dimensional reconstruction results for the object in a large depth range: (a) T=42 pixel, Floyd-Steinberg dithering pattern; (b) T=60 pixel, Bayer dithering pattern; (c) T=60 pixel, standard sinusoidal fringe
表 1 最佳频率的最优抖动模式
Table 1. Optimal dither mode for optimal frequency
T/pixel 42 48 54 60 Dithering method F F B B Order  下载: 导出CSV
表 2 标准台阶平面的测量结果(单位:mm)
Table 2. Measurement results of standard step plane (Unit: mm)
Depth place Plane difference Actual depth Measured depth Absolute error T=42 pixel
Floyd-SteinbergT=60 pixel
BayerT=42 pixel
Floyd-SteinbergT=60 pixel
Bayer20 cm B-C 18.422 18.397 18.455 0.025 0.033 C-D 13.258 13.228 13.291 0.030 0.033 42.5 cm B-C 18.422 18.453 18.395 0.031 0.027 C-D 13.258 13.226 13.229 0.032 0.029
下载: 导出CSV
-
[1] 张昂, 孙亚琴, 高楠, 等. 三灰度编码相位展开方法条纹投影轮廓术[J]. 光学精密工程, 2022, 30(5): 518-526. doi: 10.37188/OPE.20223005.0518 Zhang Ang, Sun Yaqin, Gao Nan, et al. Fringe projection profilometry by ternary-gray encoded phase unwrapping method [J]. Optics and Precision Engineering, 2022, 30(5): 518-526. (in Chinese) doi: 10.37188/OPE.20223005.0518 [2] 张宗华, 于瑾, 高楠, 等. 高反光表面三维形貌测量技术[J]. 红外与激光工程, 2020, 49(3): 0303006-0303006-13. doi: 10.3788/IRLA202049.0303006 Zhang Zonghua, Yu Jin, Gao Nan, et al. Three-dimensional shape measurement techniques of shiny surfaces [J]. Infrared and Laser Engineering, 2020, 49(3): 0303006. (in Chinese) doi: 10.3788/IRLA202049.0303006 [3] 王永红, 张倩, 胡寅, 等. 显微条纹投影小视场三维表面成像技术综述[J]. 中国光学, 2021, 14(3): 447–457. doi: 10.37188/CO.2020-0199 Wang Yonghong, Zhang Qian, Hu Yin, et al. 3D small-field surface imaging based on microscopic fringe projection profilometry: A review [J]. Chinese Optics, 2021, 14(3): 447-457. (in Chinese) doi: 10.37188/CO.2020-0199 [4] 曹智睿. 基于相移条纹投影的动态3 D测量误差补偿技术[J]. 中国光学, 2023, 16(01): 184-192. (in Chinese) doi: 10.37188/CO.EN.2022-0004 Cao Zhirui. Dynamic 3D measurement error compensation technology based onphase-shifting and fringe projection [J]. Chinese Optics, 2023, 16(1): 184-192. (in Chinese) doi: 10.37188/CO.EN.2022-0004 [5] 雷经发, 陈志强, 张淼等. 双频投影条纹相位展开方法的改进[J]. 光学精密工程, 2021, 29(06): 1337-1345. doi: 10.37188/OPE.20212906.1337 Lei Jingfa, Chen Zhiqiang, Zhang Miao, et al. Improvement of phase unwrapping method for dual-frequency projection fringe [J]. Optics and Precision Engineering, 2021, 29(6): 1337-1345. (in Chinese) doi: 10.37188/OPE.20212906.1337 [6] 付莉娜, 杨静雯, 李雁玲, 等. 二值条纹离焦投影技术综述[J]. 激光与光电子学进展, 2022, 59(14): 1415011-1415011-15. doi: 10.3788/LOP202259.1415011 Fu Lina, Yang Jingwen, Li Yanling, et al. Binary fringe defocused projection technology: A Review [J]. Laser and Optoelectronics Progress, 2022, 59(14): 1415011. (in Chinese) doi: 10.3788/LOP202259.1415011 [7] Zuo C, Chen Q, Feng S, et al. Optimized pulse width modulation pattern strategy for three-dimensional profilometry with projector defocusing [J]. Applied Optics, 2012, 51(19): 4477-4490. doi: 10.1364/AO.51.004477 [8] Wang Y, Zhang S. Superfast multifrequency phase-shifting technique with optimal pulse width modulation [J]. Optics Express, 2011, 19(6): 5149-5155. doi: 10.1364/OE.19.005149 [9] Xian T, Su X. Area modulation grating for sinusoidal structure illumination on phase-measuring profilometry [J]. Applied Optics, 2001, 40(8): 1201-1206. doi: 10.1364/AO.40.001201 [10] Wang Y, Zhang S. Three-dimensional shape measurement with binary dithered patterns [J]. Applied Optics, 2012, 51(27): 6631-6636. doi: 10.1364/AO.51.006631 [11] Kite T D, Evans B L, Bovik A C. Modeling and quality assessment of halftoning by error diffusion [J]. IEEE Transactions on Image Processing, 2000, 9(5): 909-922. doi: 10.1109/83.841536 [12] Floyd R W, Steinberg L. An adaptive algorithm for spatial gray-scale[C]//Proc Soc Inf Disp, 1976, 17: 75-77. [13] Ulichney R A. Digital Halftoning[M]. Cambridge: MIT Press, 1987. [14] Pan B, Qian K, Huang L, et al. Phase error analysis and compensation for nonsinusoidal waveforms in phase-shifting digital fringe projection profilometry [J]. Optics Letters, 2009, 34(4): 416-428. doi: 10.1364/OL.34.000416 [15] Zheng D, Da F, Qian K, et al. Phase error analysis and compensation for phase shifting profilometry with projector defocusing [J]. Applied Optics, 2016, 55(21): 5721-5728. doi: 10.1364/AO.55.005721 [16] Wang Y, Zhao H, Jiang H, et al. Defocusing parameter selection strategies based on PSF measurement for square-binary defocusing fringe projection profilometry [J]. Optics Express, 2018, 26(16): 20351-20367. doi: 10.1364/OE.26.020351 [17] Zhang J, Luo B, Su X, et al. Depth range enhancement of binary defocusing technique based on multi-frequency phase merging [J]. Optics Express, 2019, 27(25): 36717-36730. doi: 10.1364/OE.27.036717 [18] 左超, 张晓磊, 胡岩, 等. 3 D 真的来了吗?—三维结构光传感器漫谈[J]. 红外与激光工程, 2020, 49(3): 0303001-0303001-45. doi: 10.3788/IRLA202049.0303001 Zuo Chao, Zhang Xiaolei, Hu Yan, et al. Has 3D finally come of age?-An introduction to 3D structured-light sensor [J]. Infrared and Laser Engineering, 2020, 49(3): 0303001. (in Chinese) doi: 10.3788/IRLA202049.0303001 [19] Zhang Z, Towers C E, Towers D P. Time efficient color fringe projection system for 3D shape and color using optimum 3-frequency selection [J]. Optics Express, 2006, 14(14): 6444-6455. doi: 10.1364/OE.14.006444 [20] 孟森森. 基于抖动算法的三维形貌测量[D]. 浙江大学, 2020. Meng Sensen. Three-dimensional shape measurement based on dithering technique[D]. Hangzhou: Zhejiang University, 2020. (in Chinese) -

 点击查看大图

计量
- 文章访问数: 157
- HTML全文浏览量: 37
- PDF下载量: 67
- 被引次数: 0

