


 下载:
下载:


-
飞秒激光依靠其特有的非线性加工机制,区别于长脉冲激光的热作用机理,拥有更高的加工精度与质量,在微加工中得到了广泛的应用,包括激光焊接、激光切割和钻孔、激光打磨、激光清洗、微纳结构制备和激光增材制造等[1]。大量的应用场景发生在大气环境下,在飞秒激光经聚焦与空气发生的相互作用中,尤其是电离产生空气等离子体[2-5],会对整个加工过程产生直接影响。例如,克尔自聚焦与等离子体散焦的相互作用会导致成丝现象[6],改变光场分布[7-8],并且空气电离可以显著影响加工过程中到达材料上的激光能量[9]。那么研究飞秒激光与空气的相互作用,特别是聚焦飞秒脉冲的电离空气过程是这些应用的关键。
然而,由于激光脉冲持续时间短(百飞秒级),故电离过程的高时间分辨精细观测仍是挑战。Tzortzakis等[10]通过电导法和衍射法确定了自导超短激光脉冲在空气中产生的等离子体通道密度和衰减动力学。张杰等通过泵浦探测阴影成像技术观测到了飞秒激光在空气中产生的中空状能量分布,并通过数值模拟重现了该结果[11]。朱晓农等采用具有旋转对称的三维电离模型对紧聚焦下激光脉冲产生空气等离子体的时空特性进行模拟,得到了等离子区的折射率动态演化过程[12]。姜澜团队通过泵浦探测阴影成像平台观测到了飞秒激光与空气的非线性作用过程,得到空气等离子体的重整形过程[13]。目前关于飞秒激光在空气中的非线性电离过程缺乏高时间分辨的精细观测,对空气电离过程与单脉冲作用之间的时间关系缺少事实支撑。此外,表征飞秒激光在非线性焦点处的传播过程对深入理解大气环境下的微加工机理与工艺优化具有重要意义。
文中通过搭建的飞秒时间分辨泵浦探测阴影成像系统研究了在显微物镜聚焦下飞秒激光传输时电离产生空气等离子体的时间−空间演化特性,并通过数值求解自由电子密度动态速率方程得到了不同聚焦条件下的飞秒激光脉冲在空气中不同电离机制的发生时间、总体电离的持续时间与自由电子扩散复合的完整过程。
-
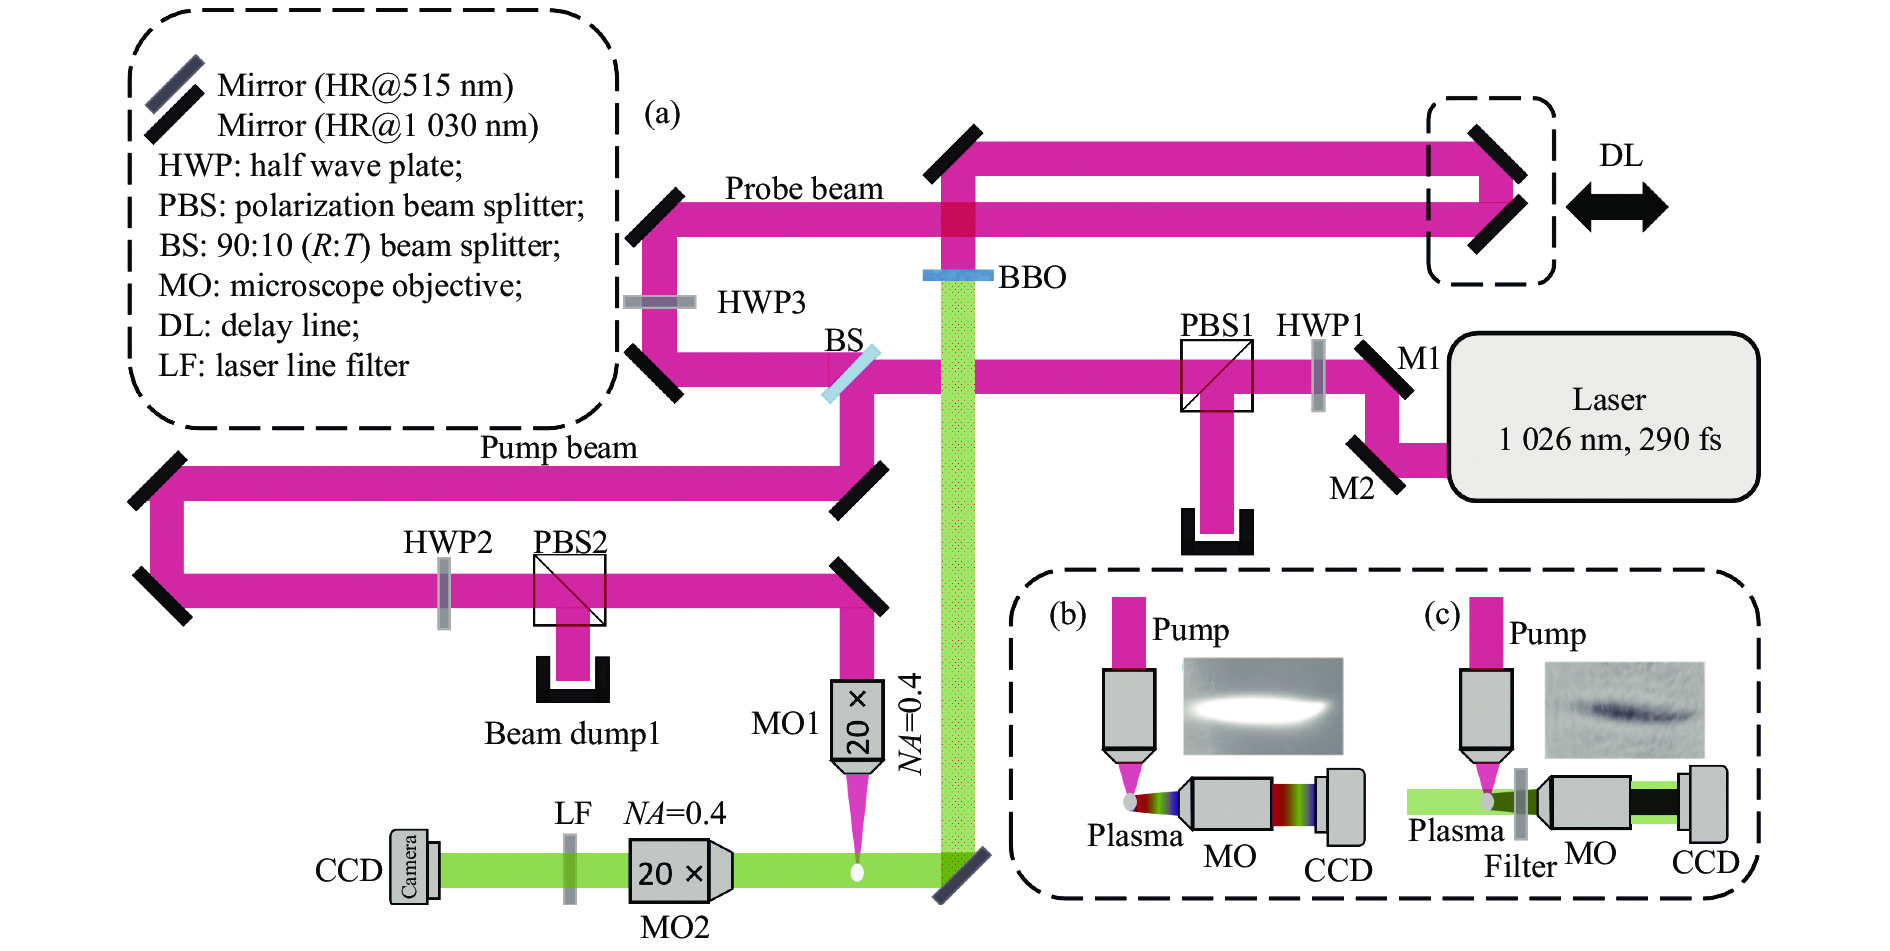
搭建的飞秒时间分辨泵浦探测阴影成像实验装置如图1所示。掺镱固体飞秒激光器(Light Conversion,PHAROS)发出中心波长为1026 nm、脉冲宽度为290 fs、单脉冲能量为200 μJ的水平线偏振激光脉冲。激光器出射的主脉冲经过第一个半波片与偏振分光棱镜进行偏振选择与功率控制,被第一个分束镜(R∶T=9∶1)分为两个子脉冲。反射光作为泵浦光,传播一段距离后经过20×显微物镜(数值孔径NA=0.4)之后聚焦在空气中,此时单脉冲能量为160 μJ。透射光经步进电机延迟线(New port,MFA-CC)产生与泵浦光的空间光程差,并经过BBO(倍频晶体)晶体倍频为绿光(513 nm)后从泵浦光焦点侧面入射,经第二个显微物镜进行放大成像后进入CCD(电荷耦合元件)。当泵浦光电离空气产生等离子体时,在探测绿光的背景下呈现为阴影。同时,在CCD之前放置带通滤光片以提高背景绿光的信噪比,通过延迟线对光程差进行调节,进而表现为拍摄的时间延时,得到高时间分辨的空气等离子体阴影图像。

图 1 飞秒时间分辨泵浦探测阴影成像实验装置。(a)泵浦探测阴影成像光路;(b)只有泵浦光时直接采集的等离子体自发光信号;(c)在探测光背景下采集的等离子体阴影信号
Figure 1. Femtosecond time-resolved pump-probe shadow imaging experimental device. (a) Optical path of the pump-probe shawdow graphy; (b) Plasma self-luminescence signal directly collected when there is only pump light; (c) Plasma shadow signal collected in the background of probe light
-
为研究飞秒激光在20×显微物镜(Microscope Objective, NA=0.4, MO1)的聚焦条件下,光脉冲在空气中传输电离的空气等离子体的演化过程,首先在没有探测光的条件下对泵浦光的聚焦焦点进行成像。可以看到,沿着光传播的焦点光斑呈现一定程度的不对称性(图2(d)),即焦后呈现了一些发散效应。这种前后不对称的形貌明显与激光电离空气等离子体对激光能量的吸收与衍射有关,在传播初期(即焦点前端)的功率密度小,电离的空气等离子体密度小,对后续部分激光脉冲的能量分布影响很小;当激光传播到焦点附近时,功率密度迅速增大,同时电离的空气等离子体密度也增大,对后续的激光能量进行了衍射发散效应,导致焦点在高重复频率下拍摄到的是近水滴状。
使用泵浦探测阴影成像方法对空气等离子体的演化过程进行研究,为了提高拍摄阴影的信噪比,在进行成像前,会在每个时刻拍摄三张静态图,分别为这一时刻的阴影图像并记为A(图2 (a));只有探测光的图像并记为B(图2 (b));仅有环境光的背景图记为C(图2 (c))。通过计算A-B-C即可得到纯净的阴影图像,消除了环境光与等离子体自发光的影响,得到高信噪比的等离子体阴影图像。当挡住探测光时,可以直接对泵浦光的焦点形貌进行成像;开放探测光时,泵浦光电离的空气等离子体会在背景中形成阴影。

图 2 100 fs时刻的等离子体阴影图像与焦点自发光成像。(a)延时为100 fs时刻的阴影图像;(b)对应的背景图;(c)仅有环境光下的背景图;(d)大气压下拍摄的飞秒激光经显微物镜聚焦后焦点自发光侧向轮廓的彩色等强度分布图
Figure 2. Plasma shadow image at 100 fs moment with focal autofluorescence imaging. (a) Shadow image with a time delay of 100 fs; (b) Corresponding background image; (c) Background image with ambient light only; (d) Color iso-intensity distribution of the lateral profile of the focal autofluorescence after focusing the microscope objective of the femtosecond laser taken at atmospheric pressure
然后对泵浦光聚焦产生的电离空气等离子体的演化过程进行拍摄。通过调节延迟线得到在不同时刻下等离子体的阴影图,如图3所示。将等离子体刚开始进入视场的位置定义为 Z = 0 μm,将只有微弱等离子体即微弱阴影定义为 0 fs时刻。从图中不同时刻的阴影变化可以得到,随着激光的传播与焦点的形成,阴影信号(即等离子体团)在不断延长,并随着激光脉冲的传播向(Z方向)移动。从0 fs时刻至59 fs时刻,阴影信号在快速增长与移动;64 fs时刻之后进入到一个缓慢演化阶段,阴影的移动速度与传播距离在缓慢减小;到135 fs时刻时整体进入一个饱和阶段,阴影信号强度停止增长。

图 3 在显微物镜20倍、NA=0.4的聚焦条件下,飞秒时间分辨的空气等离子体阴影变化图像
Figure 3. Femtosecond time-resolved air plasma shadow change image at 20 times of microscopic objective and NA=0.4
在空气中的激光电离会伴随冲击波的形成。考虑到其传播速度在km/s量级[14-16],视场中的图像分辨率为3.75 μm,那么至少需要在纳秒的时间量级才能观察到冲击波对空气等离子体空间密度分布的影响。这说明冲击波的扰动对空气等离子体的形貌与位置几乎没有影响,实验中拍摄到的阴影图像仅仅是其电离演化过程的侧面体现。
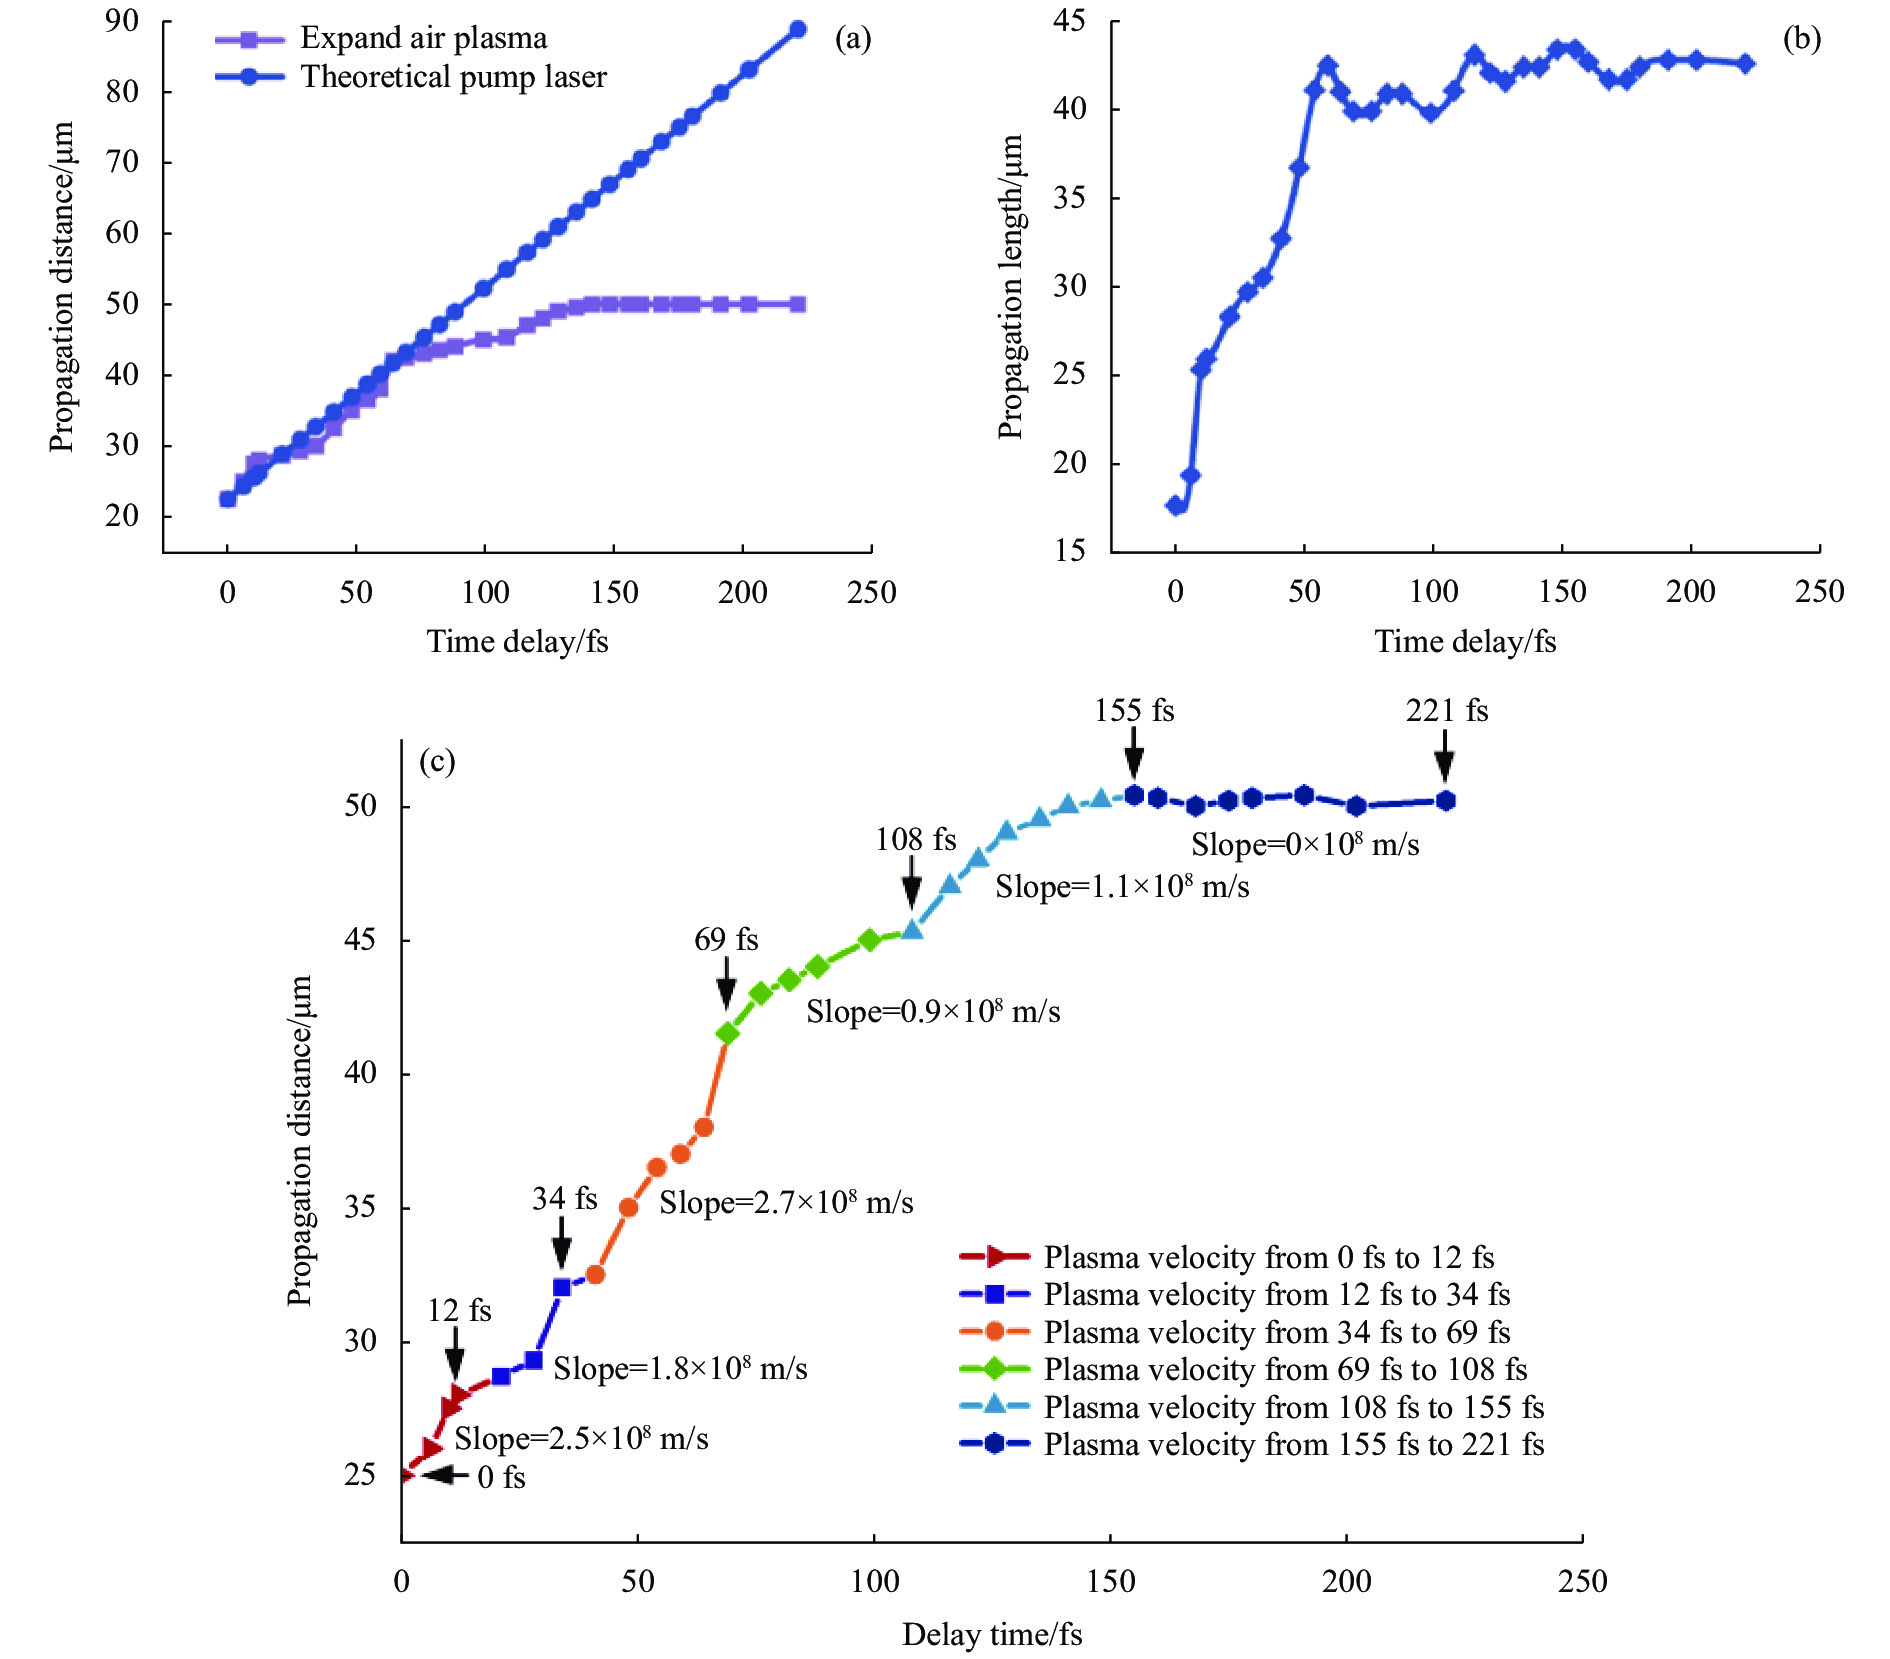
激光脉冲的传播路径上,空气被依次电离,因此看起来是空气等离子体在CCD上阴影的“传播”,实际上是激光在穿过区域时不同位置的电离过程。等离子体阴影本身在这么短的时间尺度内并没有移动。图4(a)给出了空气等离子体的扩散距离与泵浦激光传播距离的时间对比。可以看出,阴影信号快速地向激光传播的方向延伸,在155 fs时刻之后,信号趋向饱和并近乎停止增长,进入一个相对稳定的状态。根据阴影延伸的距离与时间的关系得到在等离子体延伸初期的平均传播速度约为2.9×10⁸ m/s,与激光在空气中的传播速度相同。从图4(b)中可以看出,在0~60 fs时间段内阴影长度急剧增长,而在60 fs之后虽有小部分浮动,但整体长度趋于稳定。这是由于初期随着泵浦激光的传播,空气中的等离子体不断被电离,并没有来得及复合与扩散。同时还研究了高时间分辨下泵浦激光电离空气等离子体的传播速度(即离化波前速度),如图4(c)所示,根据等离子前端的位置与时间的关系得到了不同时间段内等离子体的电离速度。总体来说,视场中阴影前端的出现速度随着时间延迟在不断减小。在0~12 fs时间段内平均速度为2.5×10⁸ m/s,而在12~34 fs与34~69 fs时间段内的电离速度分别为1.8×10⁸ m/s与2.7×108 m/s。总的来看,在0~64 fs电离初期的平均电离速度接近光速;随着电离空气等离子体逐渐饱和,在69~108 fs与108~155 fs时间段内的平均速度降为0.9×10⁸ m/s与1.1×108 m/s;当波前完全经过聚焦区域后,离化的平均速度基本降为0。

图 4 等离子体阴影的演化过程。(a)等离子体前端位置随时间的变化曲线;(b)等离子体阴影长度随时间的变化曲线;(c)空气等离子体在不同时间段的离化波前速度
Figure 4. Evolution of plasma shadowing process. (a) Curve of the position of the plasma front with time; (b) Curve of the length of the plasma shadow with time; (c) Velocity of the dissociated wave front of the air plasma at different time periods
在自由电子的阴影成像中,阴影图像的瞬时透过率可表征等离子体的瞬时密度分布[17]。由于空气等离子体的空间密度分布不均会导致对探测光的折射、反射、衍射与吸收等现象。探测光穿过等离子体区域时入射角基本为0°,故忽略折射效应;并且这里主要统计等离子体轴线上的电子密度分布,等离子体与空气边缘的衍射效应也很小。但均匀的空气分子对探测光的吸收远小于电离电子对探测光的逆韧致吸收作用,对于探测光波长为513 nm的激光来说,临界电子数密度Ncr=1.1×10²¹/cm3,而实验中的峰值电子数密度为1015/cm3量级,在电子数密度小于临界电子数密度的情况下,主要发生对探测光的吸收。那么总体看来,探测到的阴影信号的灰度分布能体现出自由电子数密度的瞬时分布,灰度值低的地方代表了更高的自由电子数密度。
瞬态电子数密度主要由探测图像的区域透过率T与Drude模型中的逆韧致辐射吸收截面$ \sigma $决定[18]:
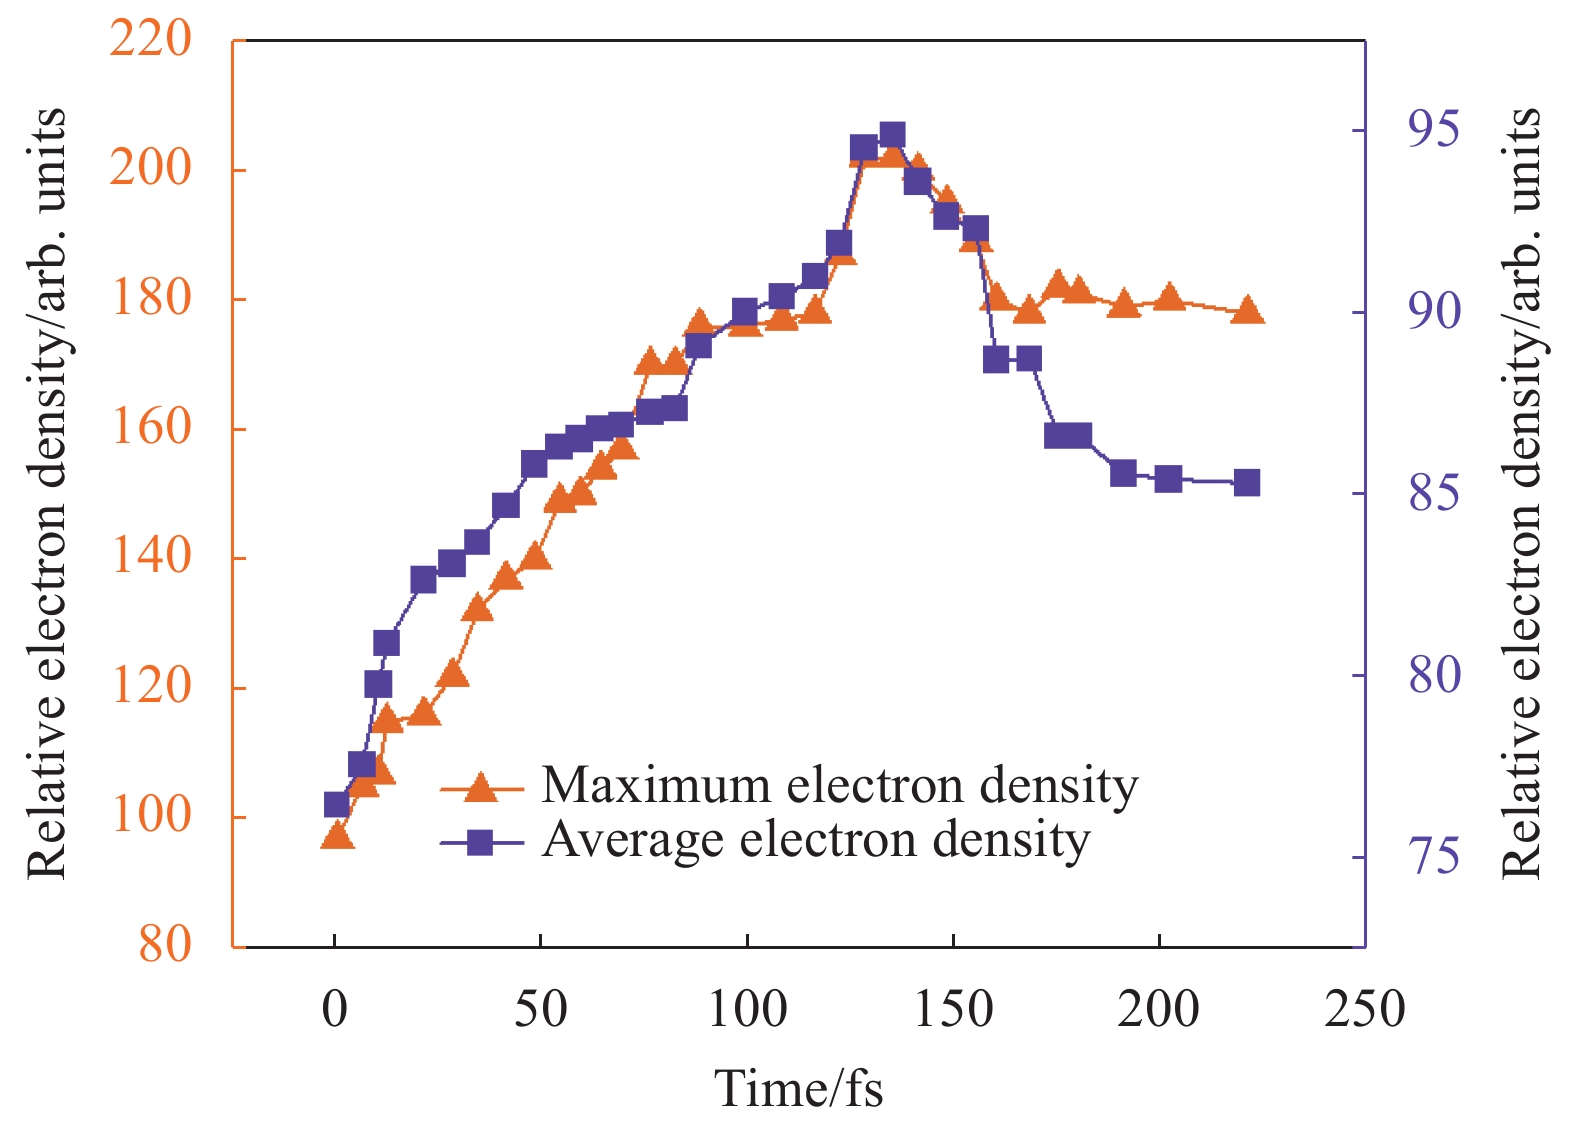
$$ ^{ } {n_e} = - \frac{{{\text{ln}}T}}{{\sigma {x_{FWHM}}}} ^{ } $$ (1) 式中:xFWHM为探测光传输方向等离子体阴影长度的半高全宽。等离子体轴线上自由电子数密度的瞬态变化如图5所示。可以看出,电子数密度经历了先上升后下降的总体过程。在100 fs时刻之前,最高电子数密度与平均电子数密度均迅速增加;在100~135 fs时间段内增长速度有所减缓;在135 fs时刻达到最大电子数密度的峰值,之后便不再增加,也间接表示电离过程已经完成。后续进入缓慢地减小阶段,这主要是离子的扩散与复合引起的。

图 5 飞秒激光诱导空气电离自由电子等离子体瞬态密度的峰值与平均值随时间的演化规律
Figure 5. Time-dependent evolution of the peak and average values of the transient electron density in a femtosecond laser-induced air ionization plasma
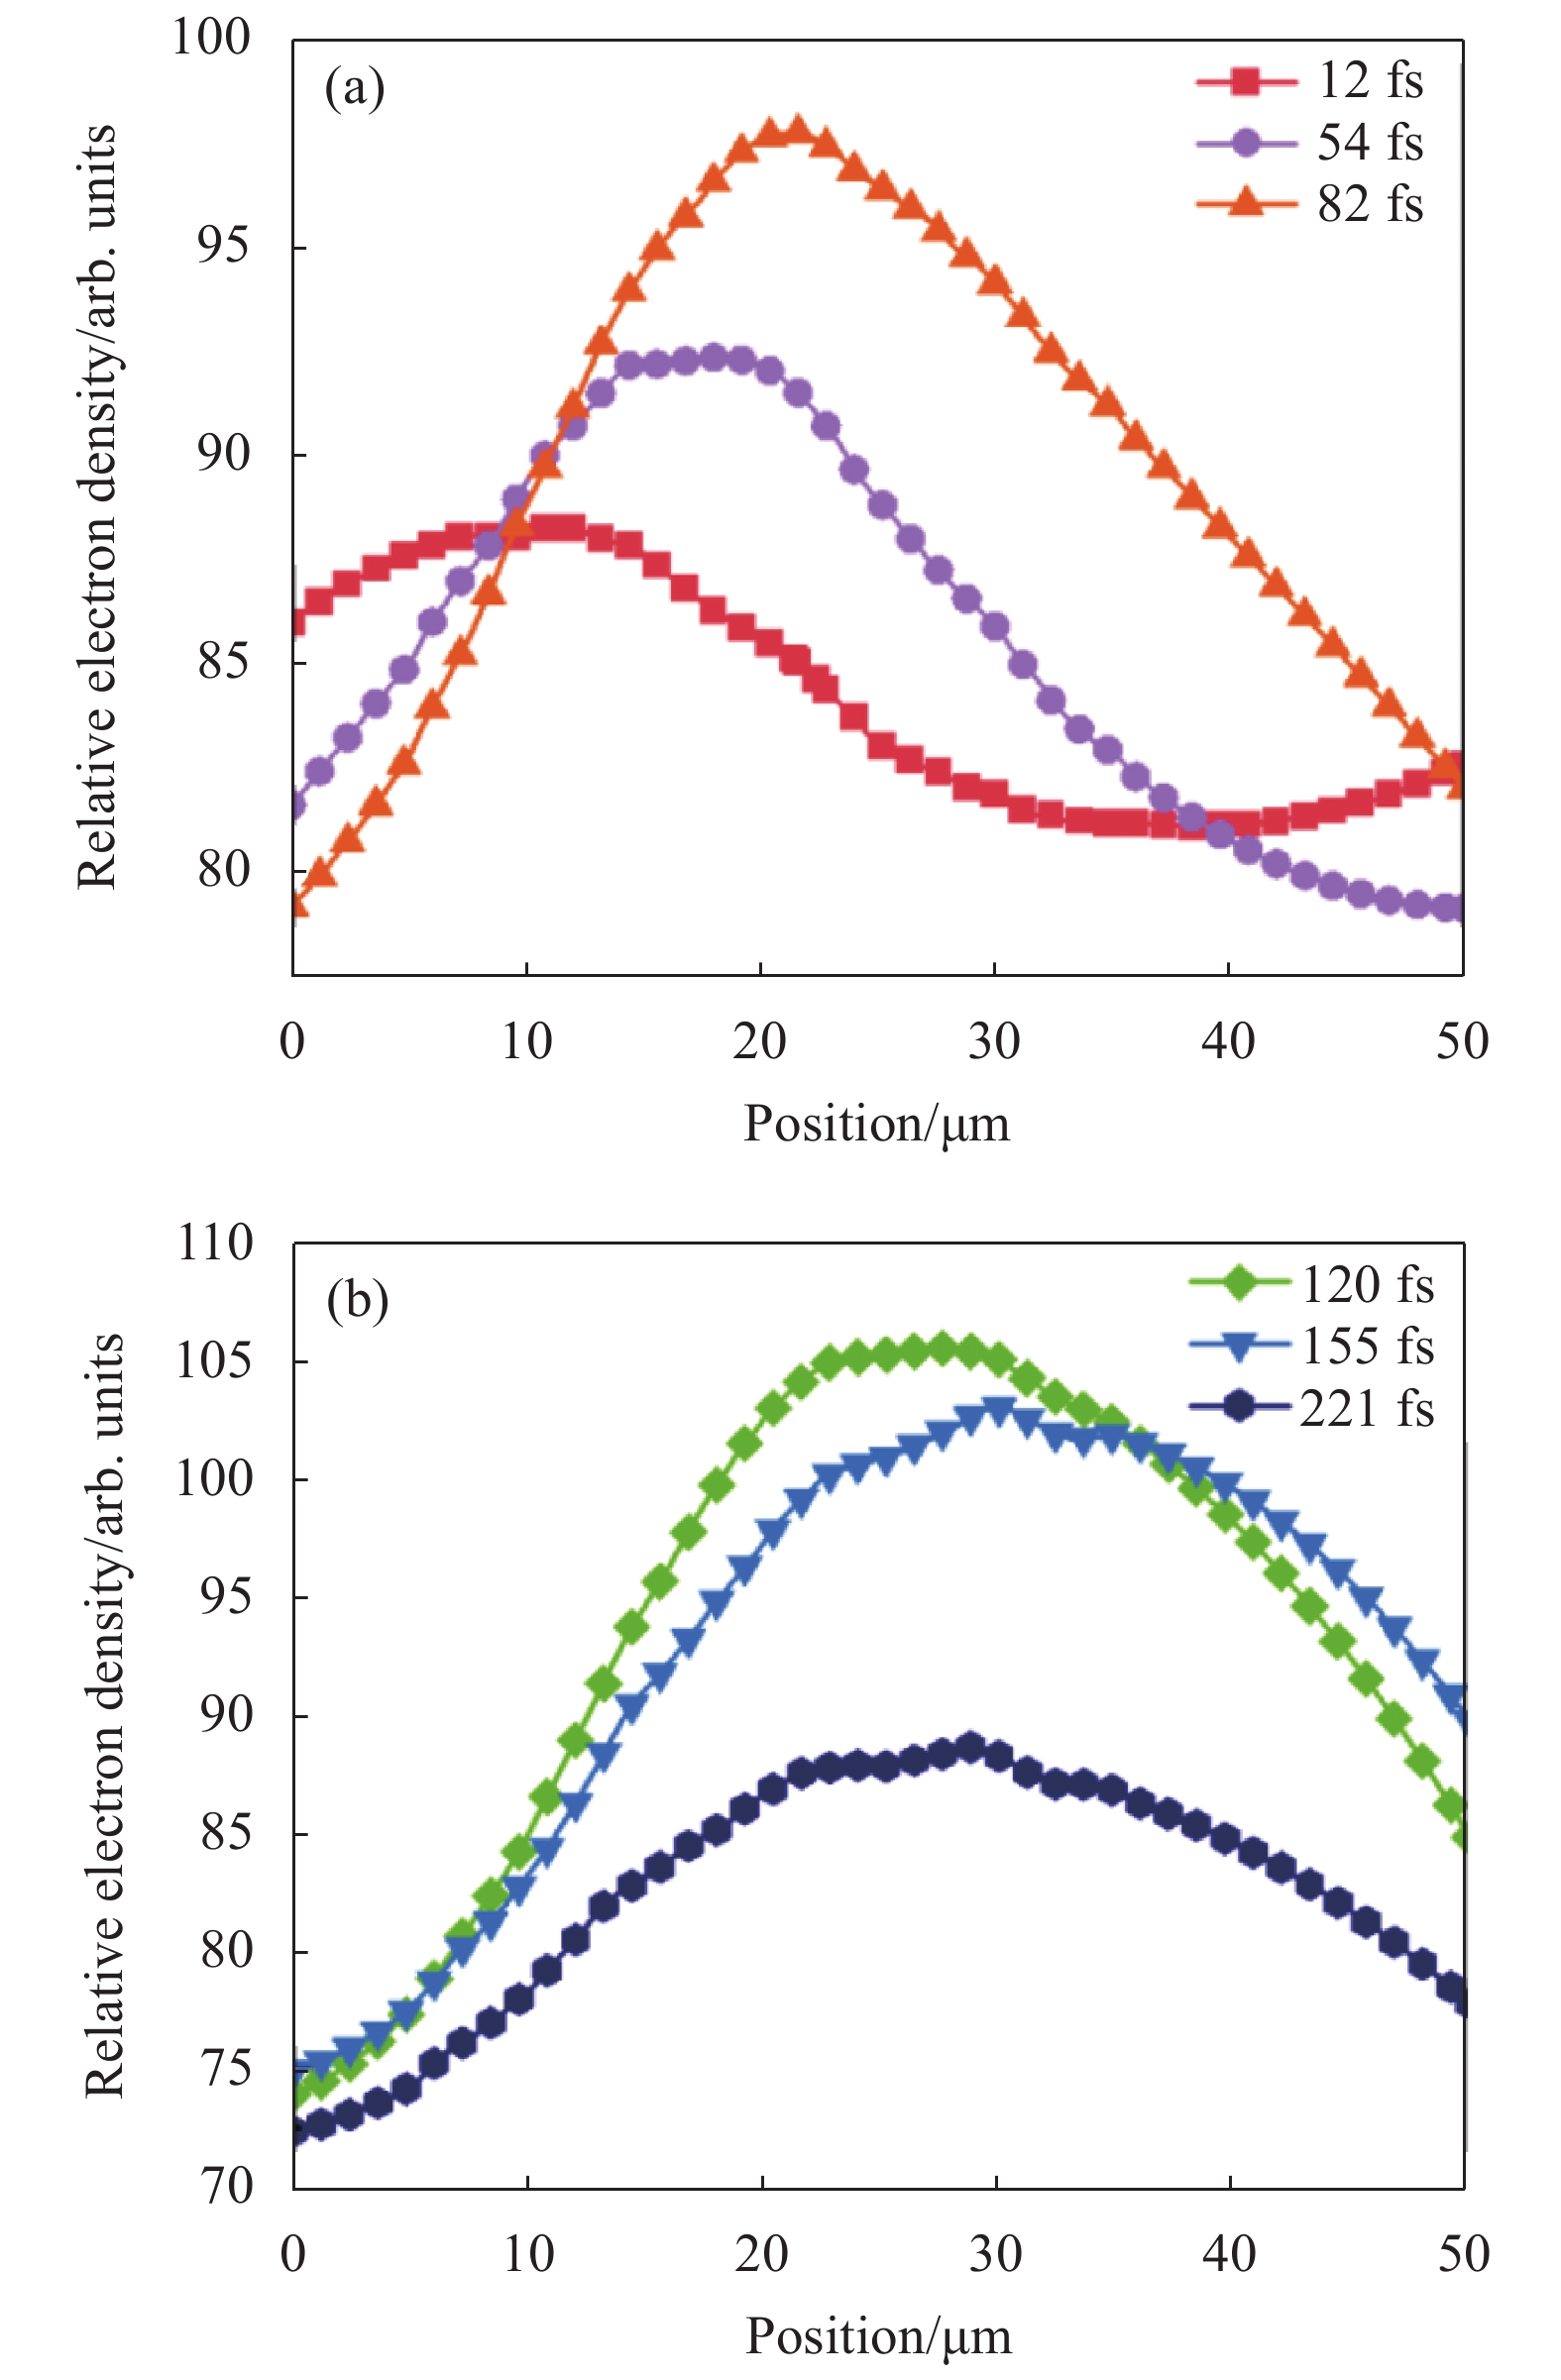
进一步地,对不同时刻的阴影图像进行灰度分析可以对应出电子密度的瞬态空间分布。在不同延时下(12 fs,54 fs,82 fs,122 fs,155 fs和221 fs)沿等离子体轴线上自由电子的瞬态空间分布如图6所示。总体来看,在所有时刻下等离子体轴线上的瞬态电子数密度随着泵浦光传输的距离先增大后减小。将曲线的最高点定义为空间中瞬态电子数密度的峰值,可以看到,随着延时的增大,瞬态电子数密度的峰值位置逐渐向泵浦光传播的方向移动,最大瞬态电子数密度的位置为28 μm处,在155 fs延时下峰值密度在31 μm处,之后随着延时的增大又返回28 μm处并趋于稳定。

图 6 不同时刻下相对电子密度在轴线上的位置分布。(a) 12、54、82 fs时刻下电子密度在轴线上的密度分布;(b) 122、155、221 fs时刻下电子密度在轴线上的密度分布
Figure 6. Distribution of relative electron density positions on the axis at different moments. (a) Density distribution of electron density on the axis at 12 fs, 54 fs, 82 fs moments; (b) Density distribution of electron density on the axis at 122 fs, 155 fs, 221 fs moments
-
基于现有微加工的激光参数对空气等离子体进行理论计算:脉冲宽度为290 fs、中心波长为1026 nm、泵浦光单脉冲能量为160 μJ、光束质量品质因数M2=1.1。用不同的聚焦性能显微物镜作为对比,在20×(NA=0.4)的聚焦条件下,聚焦的束腰半径为0.98 μm,功率密度为0.73×10¹⁷ W/cm2。
在对空气的电离模型中,采用自由电子密度变化率方程[18]:
$$ \frac{{{\rm{d}}\rho }}{{{\rm{d}}t}} = {\left( {\frac{{{\rm{d}}\rho }}{{{\rm{d}}t}}} \right)_{photo}} + {K_{casc}}\rho - {K_{diff}}\rho - {K_{rec}}{\rho ^2} $$ (2) 式中:ρ为电子数密度,是时空间的函数;等式右边第一项为光致电离,包含多光子电离与隧穿电离;Kcasc为雪崩电离几率,包含碰撞电离与级联电离;Kdiff 为电子的扩散几率;Krec为电子的复合几率。在第二项碰撞电离中,由激光的脉冲宽度与电子−原子或分子的平均碰撞时间决定,当碰撞时间小于一个激光的脉冲宽度时,雪崩电离占主导;当平均碰撞时间远大于一个激光的脉冲宽度时,雪崩电离可以忽略。对于一个标准大气压而言,分子的平均碰撞时间为300~800 fs[19]。基于激光脉宽为290 fs,此处需考虑雪崩电离,取平均碰撞时间为300 fs。第三项表示电子自由扩散的速率,此时主要考虑电子扩散出聚焦强点的速度。第四项表示自由电子与正电荷的复合损耗。
Keldysh参数γ可确定在激光电离过程中的多光子电离与隧穿电离对电离总数贡献的比例[20],即:
$$ \gamma = \frac{\omega }{e}\sqrt {\frac{{m'c{\varepsilon _0}n\Delta E}}{I}} $$ (3) 式中:ω为激光的脉冲的角频率;e为电子电荷;I为激光脉冲的峰值强度;ΔE为空气分子的电离能;m'为电子有效质量;c为空气中的光速;n为折射率;ε0为真空介电常数。中心波长为1026 nm对应的激光角频率为1.84×10¹⁵ rad·s−1,对应的单光子能量为1.21 eV;空气的等效电离能为14.709 eV。选取空气的折射率为1,在当前参数下,当γ=1时所对应的光强为2.4×10¹³ W·cm−2,此时表示在电离过程中多光子电离与隧穿电离占有同等比例。根据Keldysh理论,当γ>>1时,多光子电离在等离子体形成的过程中占主导地位,此时光强I<2.4×10¹³ W·cm−2。当γ<<1时,隧穿电离在等离子体的形成过程中贡献更多。此刻在激光的强场作用下,库仑势发生了改变,电子顺着势场变形的方向而逸散出去。
通过四阶龙格库塔方法求解自由电子密度速率方程,获得了物镜聚焦区飞秒激光电离空气产生自由电子密度随时间的演化过程。通过注入不同的单脉冲能量并给出了归一化的290 fs激光脉冲的强度的时间分布。使用激光脉冲宽度(290 fs)对图中的时间轴进行约化,0时刻代表激光强度的峰值,0时刻之前的负时间代表激光脉冲到达峰值之前的时间。分别模拟了不同单脉冲能量(160 μJ、320 μJ和640 μJ)下,在20×(NA=0.4)与40×(NA=0.6)聚焦条件的自由电子密度时间变化情况,如图7所示。

图 7 在单脉冲能量为160、320、640 μJ下,20×与40×聚焦电离的电子密度变化与归一化激光脉冲的时间关系。(a) 20×聚焦条件下电离的电子密度变化;(b) 40×聚焦条件下电离的电子密度变化
Figure 7. Electron density variation versus normalized laser pulse time for 20× versus 40× focused ionization at single pulse energies of 160 μJ, 320 μJ, and 640 μJ. (a) Electron density variation of ionization under 20× focusing conditions; (b) Electron density variation of ionization under 40× focusing conditions
基于不同的聚焦条件,数值孔径越大,焦深越小,相应的电离区域越小,泵浦光传播的发散角越大。从图中可以看出,高NA物镜对应的电离发生时间更早,隧穿电离也更早出现,同时也贡献了更多的电子数密度。在所选的激光参数和聚焦条件下,激光脉冲完全通过之前空气,已经完成电离。单脉冲能量160 μJ在20×、NA=0.4的聚焦条件下,自由电子到达饱和的时间约为0.56τ,即162 fs。同时,又详细地对160 μJ的单脉冲能量在两种聚焦条件下的自由电子密度时间演化进行计算,如图8所示。

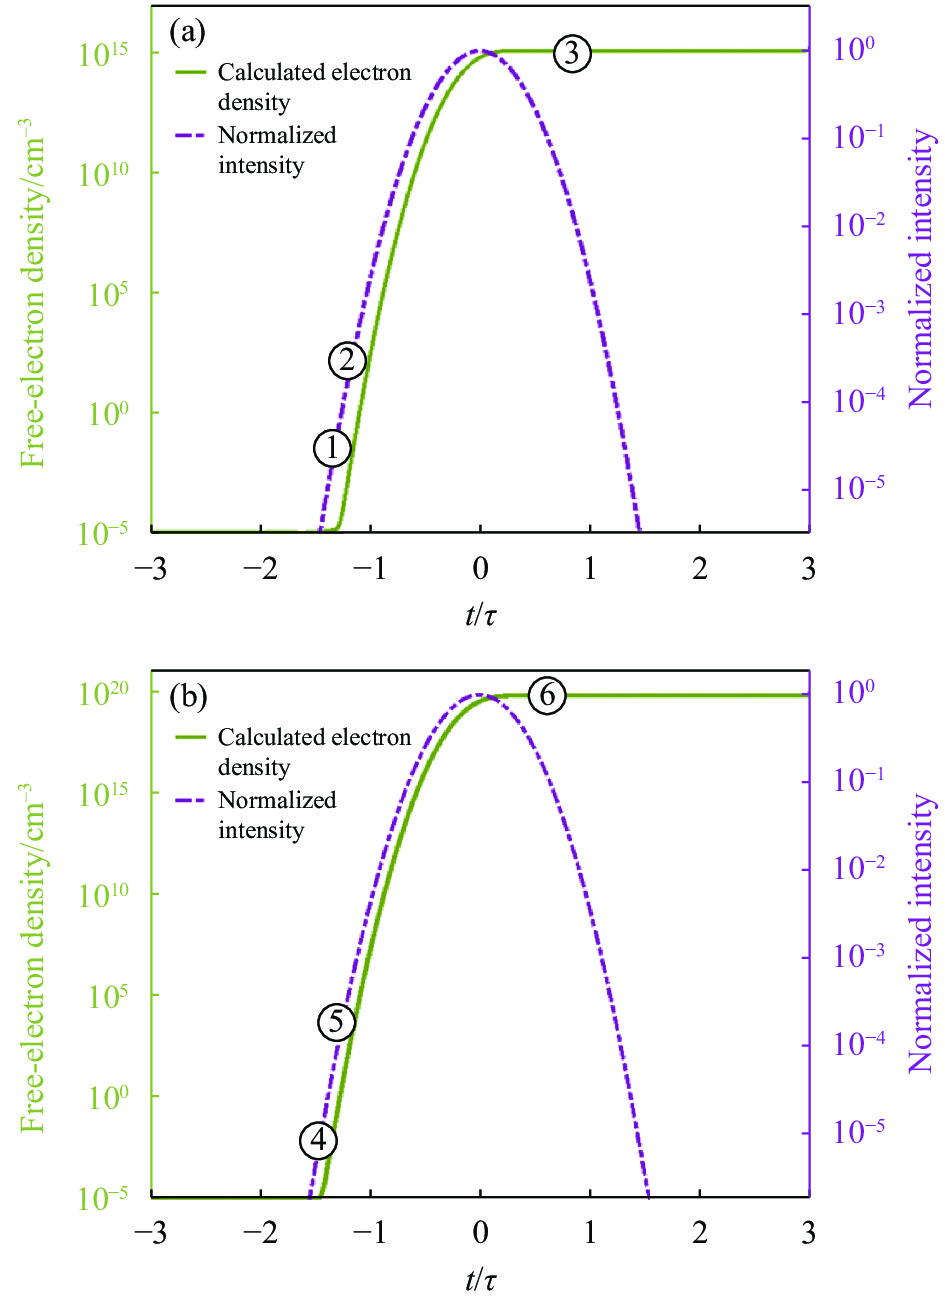
图 8 单脉冲能量为160 μJ的激光脉冲经20×与40×物镜聚焦到空气中时,在焦点中心位置产生的自由电子密度随时间的演变过程及归一化飞秒激光脉冲强度分布。(a) 20×聚焦条件下电子数密度与归一化脉冲强度的关系;(b) 40×聚焦条件下电子数密度与归一化脉冲强度的关系
Figure 8. Evolution of the free electron density at the center of the focal point with time and the normalized femtosecond laser pulse intensity distribution when a laser pulse with a single pulse energy of 160 μJ is focused into the air by 20× and 40× objective lenses. (a) Relationship between electron number density and normalized pulse intensity under 20× focusing condition; (b) Relationship between electron number density and normalized pulse intensity under 40× focusing condition
由计算结果可得:在20×(NA=0.4)的聚焦条件下,在−1.33τ时刻(点①),激光脉冲的瞬时强度为1.7×10¹² W/cm2,自由电子密度迅速增加,此时主要为多光子电离。到−1.158τ时刻(点②),电离方式由隧穿电离占主导,激光瞬时功率为2.4×1013 W/cm2,电子密度为1.5×103 cm−3。在0.589τ时刻(点③),自由电子密度达到饱和,电子密度为1.28×1015 cm−3 。40×(NA=0.6)的聚焦条件下,在−1.4τ时刻(点④),激光脉冲的瞬时强度为2×10¹² W/cm2,自由电子密度迅速增加,此时主要为多光子电离。到−1.26τ时刻(点⑤),电离方式由隧穿电离占主导,激光瞬时功率为2.4×1013 W/cm2,电子密度为1.6×1017 cm−3。在0.64τ时刻(点⑥),自由电子密度达到饱和,电子密度为6.9×1019 cm−3。可以得到,在高倍率高数值孔径的聚焦条件下,多光子电离发生的时间更早,同时隧穿电离也贡献了更多的电子数密度。
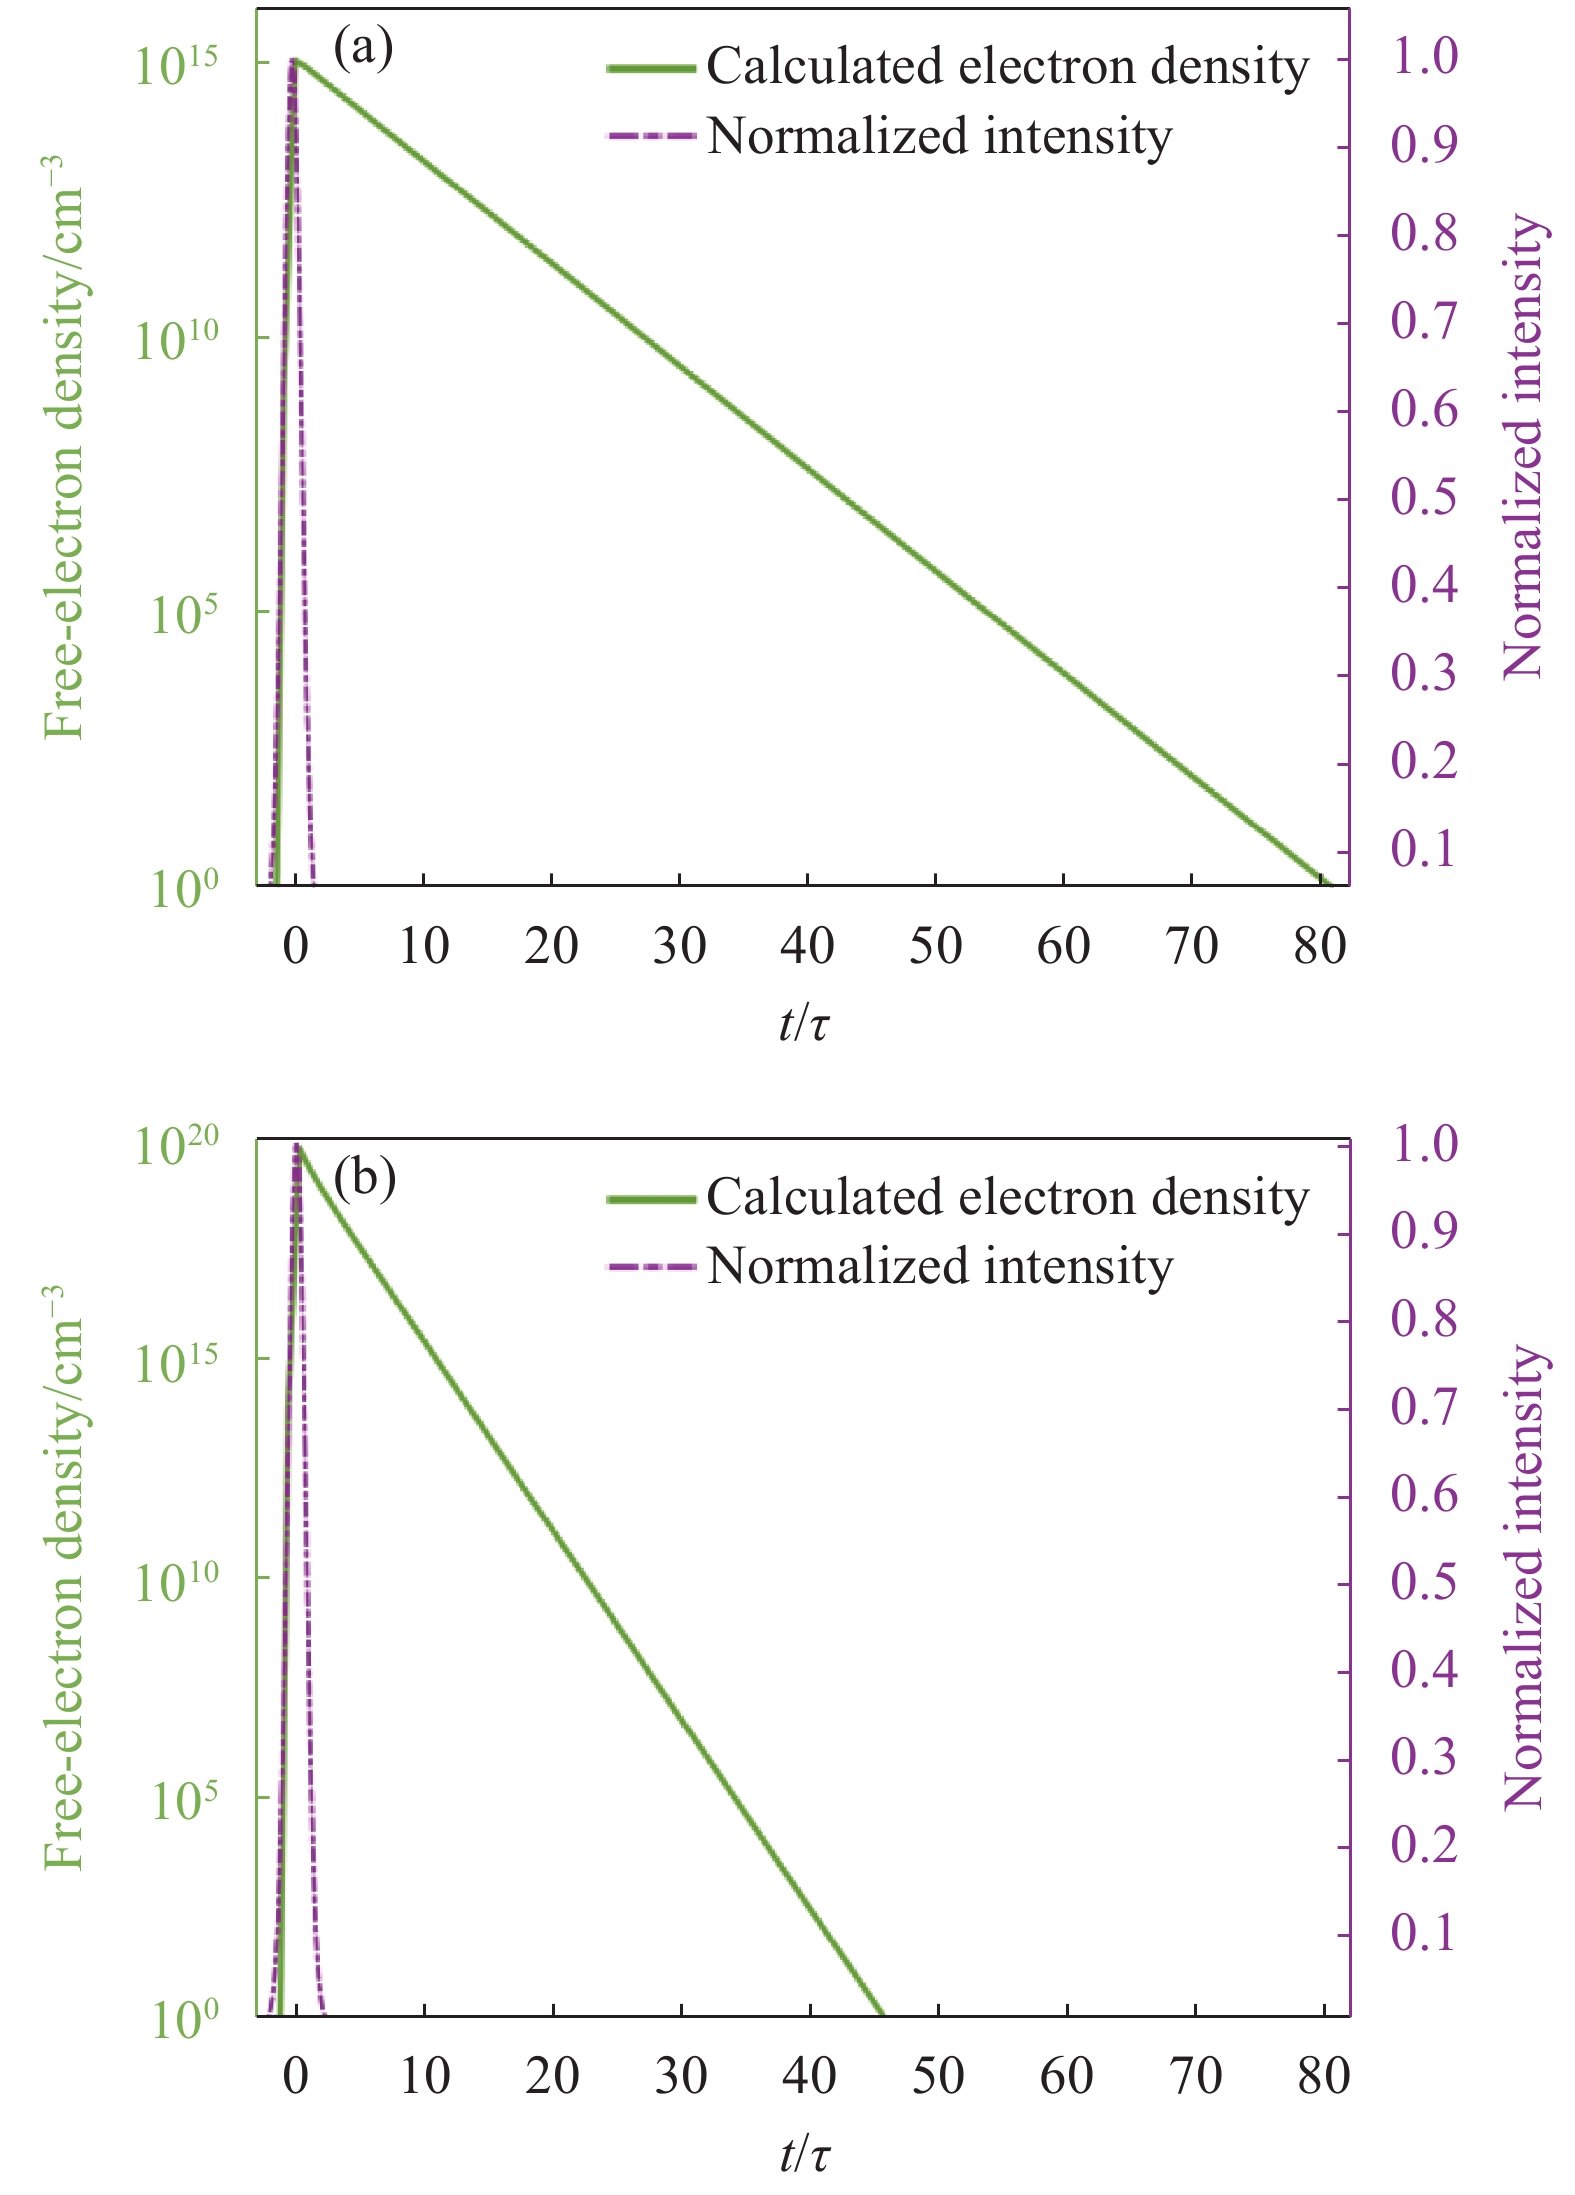
在激光脉冲完全通过电离区域后,只存在电子耗散机制(扩散与复合),得到完整的消失过程。由图可见,在20×、NA=0.4的聚焦条件下,自由电子完全消失的时间为脉冲宽度的80.1倍,即23.2 ps;在40×、NA=0.6的聚焦条件下,自由电子完全消失的时间为脉冲宽度的45.05倍,即13.1 ps。基于此,在飞秒激光电离空气等离子体的过程中,从自由电子从出现到饱和再到完全消失的这一整个过程在时间轴上是不对称的,电离的速度远远大于消失的速度,如图9所示。

图 9 单脉冲能量为160 μJ的激光脉冲经20×与40×物镜聚焦到空气中时,在焦点中心位置产生的自由电子密度随时间的扩散过程。(a) 20×聚焦条件下自由电子密度随时间的扩散过程;(b) 40×聚焦条件下自由电子密度随时间的扩散过程
Figure 9. The diffusion process of free electron density with time at the center of the focus when a laser pulse with a single pulse energy of 160 μJ is focused into the air by 20× and 40× objectives. (a) The diffusion process of free electron density with time under 20× focusing condition; (b) The diffusion process of free electron density with time under 40× focusing condition
-
将脉冲宽度为290 fs、单脉冲能量为160 μJ、中心波长为1026 nm的激光脉冲作为泵浦光脉冲,通过搭建飞秒时间分辨的泵浦探测阴影成像实验研究了聚焦的飞秒脉冲在空气中传输电离的时间−空间过程。并通过求解自由电子速率方程对不同注入能量与聚焦条件进行了数值计算,得到了空气等离子体的产生与消失的时间过程。实验结果表明,电离的空气等离子体为梭形,随着延时的增大,瞬态电子数密度先增大后减小,同时等离子体的延伸速度在一直减小。通过求解自由电子的速率方程表明,在高NA物镜的聚焦条件下,飞秒激光电离空气等离子体的瞬态电子数密度更高,隧穿电离在整个电离过程中贡献的电子数密度更大;并考虑到离子的扩散与复合,高NA聚焦条件下,等离子体密度的衰减更快,电离与扩散过程呈现时间上的高度不对称性。
飞秒激光微加工中工艺优化参数多而广,往往需要耗费大量的人力和物力进行试验探索。现有的微加工计算模型由于缺少瞬态电子特征值等关键物理参数,导致仿真模型无法复现实际的加工结果。飞秒时间分辨泵浦探测技术可对物理特征参数的瞬态测量提供重要手段,并完善仿真模型,从而提高仿真结果的准确性。整体来看,飞秒时间分辨泵浦探测阴影成像可对不同加工环境下的瞬态物理过程提供观测手段,并有望成为高端飞秒加工装备在线监测的有力工具。
Ultrafast observation of air plasma induced by femtosecond laser micromachining
-
摘要: 通过搭建飞秒时间分辨的泵浦探测阴影成像系统,研究了聚焦的飞秒激光脉冲产生空气等离子体的瞬态演化特性,并对不同聚焦条件下空气等离子体的时间特性进行了数值模拟。实验结果表明:聚焦的飞秒激光电离空气等离子体的电子瞬态密度峰值先升高后缓慢下降;同时得到了高时间分辨下的电离速度变化与电子数密度的空间分布。计算结果显示:更高的单脉冲能量对应更高的饱和电子数密度,高数值孔径聚焦条件下隧穿电离也更早出现,表明飞秒时间分辨的泵浦探测阴影成像可为超快激光微加工的瞬态过程提供观测手段,同时可对超快激光微加工过程中的等离子屏蔽效应提供机理解释与加工工艺的优化参考。Abstract:
Objective Femtosecond laser micromachining application scenarios commonly occur in atmospheric environments. When the femtosecond laser is focused and interacts with air, it ionizes to produce air plasma, which has a direct impact on the whole machining process. Among other things, the interaction of Kerr self-focusing with plasma scattering leads to filamentation, which changes the light field distribution, and air ionization can significantly affect the laser energy acting on the material. Studying the interaction between femtosecond laser and air, especially the process of ionization of air by laser pulses, is the key to leapfrogging to enhanced applications. To deeply understand the laser micromachining process in atmospheric environment, the transient evolution characteristics of air plasma generated by focused femtosecond laser pulses are studied by building a femtosecond time-resolved pump-probe shadow imaging system, and the temporal characteristics of air plasma under different focusing conditions are numerically simulated. Methods A high time-resolved pump-probe shadow imaging system was built. The laser beam is focused in the air by a microscopic objective and imaged by another laser beam for detection(Fig.1). A 20× microscope objective was used for high-resolution imaging of the plasma to record the time-space evolution of the air plasma. The optical range difference between the pump light and the detection light is adjusted to determine the detection time interval, and the spatial morphology of the air plasma is characterized by the shadow image on the CCD. In the numerical simulation, the ionization model in atmospheric environment is established to obtain the complete process of plasma generation and dissipation in light calling ionization. Results and Discussions Under the microscope focusing conditions at 20×, the plasma is growing and moving rapidly from 0 fs to 59 fs; After 64 fs, it enters a slow evolutionary stage, with the shadow moving speed and propagation distance slowly decreasing; And at 135 fs, the plasma enters a saturation stage and the shadow signal intensity stops growing (Fig.3). The wave front velocity of its ionization keeps decreasing with time and is overall less than the speed of light (Fig.4). From the computational model, it is obtained that the transition times between multiphoton ionization and tunneling ionization are −1.158τ and −1.26τ for 20-fold and 40-fold focusing conditions, and the times of complete dissipation of free electrons are 23.2 ps and 13.1 ps, respectively. Conclusions A laser pulse with a pulse width of 290 fs, a single pulse energy of 160 μJ, and a central wavelength of 1 026 nm was used as the pump light pulse, and the time-space process of the focused femtosecond pulse transport ionization in air was investigated by building a femtosecond time-resolved pump-probe shadow imaging experiment. The time course of air plasma generation and disappearance was obtained by solving the free electron rate equation for different injection energies and focusing conditions numerically. The experimental results show that the ionized air plasma is shuttle-shaped, and the transient electron number density increases and then decreases as the delay time increases, while the extension velocity of the plasma gradually decreases from 2.9×10⁸ m/s to 0. Solving the free electron rate equation shows that the transient electron number density of the air plasma ionized by the femtosecond laser is higher under the focusing conditions of the high-NA objective, and the tunneling ionization contributes to a higher electron number density in the whole ionization process. The number of electrons contributing to the whole ionization process is higher; And considering the diffusion and compounding of ions, the decay of plasma density is faster under high NA focusing conditions, and the ionization and diffusion processes present a high degree of temporal asymmetry. The process optimization parameters in femtosecond laser micromachining are numerous and extensive, and often require a lot of labor and resources for experimental exploration. The existing micromachining computational models are unable to reproduce the actual processing results due to the lack of key physical parameters such as transient electron eigenvalues in the simulation model. Femtosecond time-resolved pumping probe technology can provide an important tool for transient measurement of physical feature parameters and improve the simulation model, thus increasing the accuracy of simulation results. Overall, femtosecond time-resolved pump-probe shadow imaging can provide a means to observe transient physical processes in different processing environments and is expected to become a powerful tool for online monitoring of high-end femtosecond processing equipment. -
Key words:
- ultrafast lasers /
- plasma /
- pump-probe shadow imaging /
- laser micromachining /
- laser ionization
-
图 1 飞秒时间分辨泵浦探测阴影成像实验装置。(a)泵浦探测阴影成像光路;(b)只有泵浦光时直接采集的等离子体自发光信号;(c)在探测光背景下采集的等离子体阴影信号
Figure 1. Femtosecond time-resolved pump-probe shadow imaging experimental device. (a) Optical path of the pump-probe shawdow graphy; (b) Plasma self-luminescence signal directly collected when there is only pump light; (c) Plasma shadow signal collected in the background of probe light
图 2 100 fs时刻的等离子体阴影图像与焦点自发光成像。(a)延时为100 fs时刻的阴影图像;(b)对应的背景图;(c)仅有环境光下的背景图;(d)大气压下拍摄的飞秒激光经显微物镜聚焦后焦点自发光侧向轮廓的彩色等强度分布图
Figure 2. Plasma shadow image at 100 fs moment with focal autofluorescence imaging. (a) Shadow image with a time delay of 100 fs; (b) Corresponding background image; (c) Background image with ambient light only; (d) Color iso-intensity distribution of the lateral profile of the focal autofluorescence after focusing the microscope objective of the femtosecond laser taken at atmospheric pressure
图 3 在显微物镜20倍、NA=0.4的聚焦条件下,飞秒时间分辨的空气等离子体阴影变化图像
Figure 3. Femtosecond time-resolved air plasma shadow change image at 20 times of microscopic objective and NA=0.4
图 4 等离子体阴影的演化过程。(a)等离子体前端位置随时间的变化曲线;(b)等离子体阴影长度随时间的变化曲线;(c)空气等离子体在不同时间段的离化波前速度
Figure 4. Evolution of plasma shadowing process. (a) Curve of the position of the plasma front with time; (b) Curve of the length of the plasma shadow with time; (c) Velocity of the dissociated wave front of the air plasma at different time periods
图 5 飞秒激光诱导空气电离自由电子等离子体瞬态密度的峰值与平均值随时间的演化规律
Figure 5. Time-dependent evolution of the peak and average values of the transient electron density in a femtosecond laser-induced air ionization plasma
图 6 不同时刻下相对电子密度在轴线上的位置分布。(a) 12、54、82 fs时刻下电子密度在轴线上的密度分布;(b) 122、155、221 fs时刻下电子密度在轴线上的密度分布
Figure 6. Distribution of relative electron density positions on the axis at different moments. (a) Density distribution of electron density on the axis at 12 fs, 54 fs, 82 fs moments; (b) Density distribution of electron density on the axis at 122 fs, 155 fs, 221 fs moments
图 7 在单脉冲能量为160、320、640 μJ下,20×与40×聚焦电离的电子密度变化与归一化激光脉冲的时间关系。(a) 20×聚焦条件下电离的电子密度变化;(b) 40×聚焦条件下电离的电子密度变化
Figure 7. Electron density variation versus normalized laser pulse time for 20× versus 40× focused ionization at single pulse energies of 160 μJ, 320 μJ, and 640 μJ. (a) Electron density variation of ionization under 20× focusing conditions; (b) Electron density variation of ionization under 40× focusing conditions
图 8 单脉冲能量为160 μJ的激光脉冲经20×与40×物镜聚焦到空气中时,在焦点中心位置产生的自由电子密度随时间的演变过程及归一化飞秒激光脉冲强度分布。(a) 20×聚焦条件下电子数密度与归一化脉冲强度的关系;(b) 40×聚焦条件下电子数密度与归一化脉冲强度的关系
Figure 8. Evolution of the free electron density at the center of the focal point with time and the normalized femtosecond laser pulse intensity distribution when a laser pulse with a single pulse energy of 160 μJ is focused into the air by 20× and 40× objective lenses. (a) Relationship between electron number density and normalized pulse intensity under 20× focusing condition; (b) Relationship between electron number density and normalized pulse intensity under 40× focusing condition
图 9 单脉冲能量为160 μJ的激光脉冲经20×与40×物镜聚焦到空气中时,在焦点中心位置产生的自由电子密度随时间的扩散过程。(a) 20×聚焦条件下自由电子密度随时间的扩散过程;(b) 40×聚焦条件下自由电子密度随时间的扩散过程
Figure 9. The diffusion process of free electron density with time at the center of the focus when a laser pulse with a single pulse energy of 160 μJ is focused into the air by 20× and 40× objectives. (a) The diffusion process of free electron density with time under 20× focusing condition; (b) The diffusion process of free electron density with time under 40× focusing condition
-
[1] Liu Yuqing, Sun Hongbo. Progress and application of nonlinear laser manufacturing (invited) [J]. Infrared and Laser Engineering, 2022, 51(1): 20220005. (in Chinese) [2] Yue Duanmu, Sun Huilai, Yang Xue, et al. Annular drilling process and quality control neural network model of stainless stell microhole with femtosecond laser [J]. Infrared and Laser Engineering, 2021, 50(10): 20200446. (in Chinese) doi: 10.3788/IRLA20200446 [3] Morgan C G. Laser-induced breakdown of gases [J]. Reports on Progress in Physics, 1975, 38(5): 621-665. doi: 10.1088/0034-4885/38/5/002 [4] Vogel A, Noack J, Hüttman G, et al. Mechanisms of femtosecond laser nano surgery of cells and tissues [J]. Applied Physics B, 2005, 81(8): 1015-1047. doi: 10.1007/s00340-005-2036-6 [5] Keefer D R. Laser-Induced Plasmas and Applications[M]. New York: Marcel Dekker, 1989: 169-170. [6] Chin S L, Hosseini S A, Liu W, et al. The propagation of powerful femtosecond laser pulses in optical media: physics, applications, and new challenges [J]. Canadian Journal of Physics, 2005, 83: 863-905. [7] Wang F, Pan C, Sun J, et al. Direct observation of structure-assisted filament splitting during ultrafast multiple-pulse laser ablation [J]. Optics Express, 2019, 27(7): 10050-10057. doi: 10.1364/OE.27.010050 [8] Xu Zhijun, Zhu Xiaonong, Yu Yang, et al. Super-luminescent jet light generated by femtosecond laser pulses [J]. Scientific Reports, 2014(4): 1-7. [9] Liu Tianhang, Hao Zuoqiang, Gao Xun, et al. Shadowgraph investigation of plasma shock wave evolution from Al target under 355-nm laser ablation [J]. Chinese Physcis B, 2014, 23(8): 3-4. [10] Tzortzakis S, Prade B, Franco M, et al. Time-evolution of the plasma channel at the trail of a self-guided IR femtosecond laser pulse in air [J]. Optics Communication, 2000, 181: 123-127. [11] Li Yutong, Xi Tingting, Hao Zuoqiang, et al. Oval-like hollow intensity distribution of tightly focused femtosecond laser pulses in air [J]. Optics Express, 2007, 15(26): 17973-17979. doi: 10.1364/OE.15.017973 [12] 于洋, 许宽宏, 朱晓农, 等. 紧聚焦条件下飞秒激光产生空气等离子体的动态演化特性[J]. 中国激光, 2017, 44(07): 343-351. Yu Yang, Xu Kuanhong, Zhu Xiaonong, et al. Dynamic evolution of air plasma induced by tightly-focused femtosecond laser pulse [J]. Chinese Journal of Lasers, 2017, 44(7): 0708001. (in Chinese) [13] Yu Yanwu, Jiang Lan, Cao Qiang, et al. Ultrafast imaging the light-speed propagation of a focused femtosecond laser pulse in air and its ionized electron dynamics and plasma-induced pulse reshaping [J]. Applied Physics A: Materials Science & Processing, 2016, 122(3): 1-7. [14] Wu Zehua, Zhu Xiaonong, Zhang Nan, et al. Time-resoled shadowgraphic study of femtosecond laser ablation of aluminum under different ambient air pressures [J]. Journal of Applied Physics, 2011, 109(5): 2-7. [15] Hu Haofeng, Wang Xiaolei, Zhai Hongchen, et al. Generation of multiple stress waves in silica glass in high fluence femtosecond laser ablation [J]. Applied Physics Letters, 2010, 97(6): 1-3. [16] Quan Sun, Jiang Hongbing, Liu Yi, et al. Measurement of the collision time of dense electronic plasma induced by a femtosecond laser in fused silica [J]. Optics Letters, 2005, 30: 320-321. doi: 10.1364/OL.30.000320 [17] Mao X, Mao S S, Russo R E. Imaging femtosecond laser-induced electron excitation in glass [J]. Applied Physics Letters, 2003, 82(5): 697-699. doi: 10.1063/1.1541947 [18] Stuart B C, Feit M D, Herman S, et al. Nanosecond-to-femtosecond laser-induced breakdown in dielectrics [J]. Physical Review B, 1996, 53(4): 1749-1761. doi: 10.1103/PhysRevB.53.1749 [19] Noack J, Vogel A. Laser-induced plasma formation in water at nanosecond to femtosecondtime scales: Calculation of thresholds, absorption coefficients, and energy density [J]. IEEE Journal of Quantum Electronics, 1999, 35(8): 1156-1167. doi: 10.1109/3.777215 [20] Keldysh L V. Ionization in the field of a strong electromagnetic wave [J]. Journal of Experimental and Theoretical Physics, 1965, 20(5): 1307-1314. -

 点击查看大图
计量
- 文章访问数: 174
- HTML全文浏览量: 15
- PDF下载量: 53
- 被引次数: 0

