


-
光学三维测量技术[1]是一项融光、机、电与计算机技术于一体的新型科学技术,主要运用于对物体三维形貌的扫描,以获取物体表面的三维形貌。光学三维测量技术作为非接触式测量中的一种,具有精度高、速度快、动态范围广等优点[2]。结构光条纹投影三维测量系统一般由发光装置、图像采集装置和待测物体组成。随着技术的发展,投影显示技术不断优化升级,多种现代投影显示设备,例如数字光处理技术 (Digital Light Processing, DLP)、 液晶显示器(Liquid Crystal Display, LCD)、液晶附硅(Liquid Crystal On Silicon, LCOS )等逐渐代替了传统的投影显示设备。
三通道相位测量轮廓术具备高精度、易识别、高度智能化的优势,能够同时在一幅彩色图像上获得多组条纹信息[3],得到了较为深入的探索和应用。由于不同颜色光线通过投影仪镜头时折射率不同,导致同一点发出的光线不能汇聚在同一位置,这种现象即为色差。色差的存在使投影仪投影的彩色图像边缘产生不同颜色的条纹,并且在三通道相位测量轮廓测量术中投影彩色条纹时,不同颜色的条纹发生位置偏移,在最后计算条纹相位时产生误差,从而影响最终三维轮廓的测量结果。因此,需要对投影仪色差进行测量和补偿以提高三通道相位测量轮廓术的整体测量精度。
目前,对于投影仪色差的测量与校正方法可以分为硬件和软件。一般情况下,硬件方法结构复杂,成本投入大,而且校正效果并不非常完美,方法均不具有普遍性。基于软件的投影仪色差测量和校正方法有以下几种。Zuo等[4]在局部颜色空间内建立原颜色与测量颜色的数学模型,并且利用插值计算邻近颜色空间,从而计算出全局的色差。但该方法需要结合颜色插值和图像分割技术,数据计算量大。Huang等[5]提出了一种基于圆环阵列的色差测量和校正方法,并利用插值计算进行校正。该方法原理简单,但在计算过程中引入相机的误差,且插值方法计算时间较长,精度较低。Mallon等[6]通过色平面重新对齐的方法补偿数字图像的横向色差。此方法虽然计算效率高,能产生更清晰的图像,但图像位置不够准确。Korneliussen等[7]提出了一种通过像素重新采样和高通复制进行色差校正的方法,该方法虽有一定的效果,但校正精度不够高。Pagès等[8]利用白色标定板校准系统的横向色差,但是未考虑采集图像位置的变化会使轴向色差发生变化,会对最终的结果造成的影响。Li等[9]提出了一种多通道的条纹投影技术的色差标定和校正方法,相较于其他方法运行速度快,操作简单,精度较高。但其适用性较窄,无法运用在其他结构光编码的三维测量系统中。Sun等[10]基于彩色Gray码,通过对比投影仪不同颜色通道投影出的同一圆点在投影平面中的相对位置情况,建立了数学模型。但其主要是补偿深度方向的色差,在X、Y两个方向补偿效果不明显。相机色差和投影仪色差实际上是耦合在一起的,形成系统色差,对三维测量的精度造成影响。Zhang等[11]提出了一种线性补偿的方法校正系统色差,但其仅适用于最佳多条纹选择法,不适用于一般的结构光测量系统。Li等[12]利用圆形标定板和线性插值的方法生成DMD图像,但计算量较大。Li等[13]针对水平或垂直条纹图像对深度变化不敏感这一局限性,提出了一种基于最佳条纹角度的标定方法。但该方法操作比较复杂,只要更换测量的实际物体就需要重新生成条纹。
一些投影仪色差测量与校正方法存在着投影仪色差与相机色差耦合在一起、特征点少、精度低的问题,并且大多现有方法运用插值算法,计算量大。基于以上现状,文中提出了一种将LCD显示屏作为相位标靶的相位测量轮廓术色差建模与校正研究。将绿色通道视为理想通道,将贴有全息投影膜的LCD显示屏当作相位标靶,利用LCD屏显示的红、绿、蓝三种颜色的条纹相位计算红绿通道和蓝绿通道的色差。建立相机像素坐标系,最终计算出投影仪的色差并建立数学模型,以此为依据提前补偿彩色条纹进行重投影,实现对投影仪色差的校正。这种投影仪色差测量及校正的方法精度高,适用范围广,计算速度快,并且消除了相机色差对投影仪色差测量造成的影响,需要避免相机色差与投影仪色差耦合在一起。
-
投影仪镜头与相机镜头成像原理相同,可以将投影仪看作“逆相机”,则投影仪成像模型与相机成像模型相同[14]。理想情况下,可以将镜头等效为一块透镜,投影仪镜头成像满足小孔成像原理[15]。投影仪镜头的投影线性模型如图1所示。投影仪成像模型中包含了四个坐标系,分别为世界坐标系、投影仪坐标系、图像坐标系和像素坐标系。在图1中,Ow-XwYwZw为世界坐标系,表示物体在三维世界的坐标;o-xyz为投影仪坐标系; O-XY为图像坐标系; O-uv为像素坐标系[16],四个坐标系之间可以相互转换。
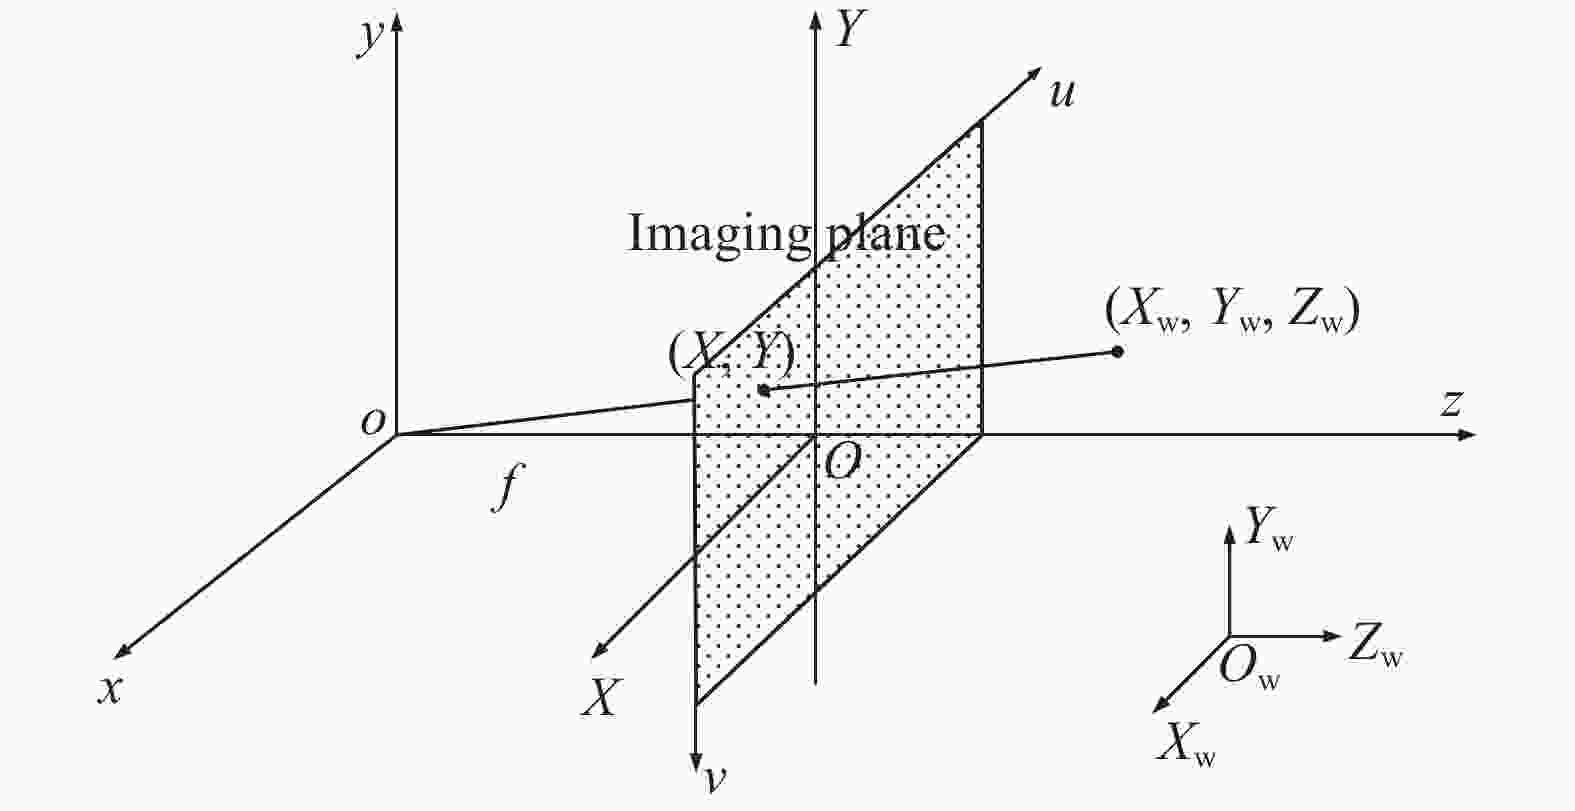
图 1 投影仪镜头成像模型
Figure 1. Imaging model of projector lens
不同波长的光通过光学系统后不能聚焦在同一点上,这种现象叫做色差。色差产生的根本原因是不同波长的光在同一介质中的折射率不同,波长越长,折射率越小;波长越短,折射率越大。则投影仪投影同一位置的点,在红、绿、蓝三种颜色通道会投影在不同位置。对投影仪这一光学系统来说,投影仪投射的光束是发散的,因此,理论上来说,离投影仪投影中心越远,投影仪色差越大;离投影仪投影中心越近,色差越小。由于投影过程是一个放大的过程,而成像是一个缩小的过程,因此在三通道相位测量轮廓术中投影仪色差对测量结果的影响比相机色差更大。
色差分为轴向色差和横向色差,色差示意图如图2所示。理想无色差情况下,不同颜色的光通过透镜后汇聚在同一位置,如图2(a)所示。轴向色差是由于不同颜色的光通过透镜后焦点位于光轴的不同位置,导致其无法聚焦在同一平面,因此投影到同一平面时,红、绿、蓝三种颜色会呈现不同程度的模糊情况,如图2(b)所示。通常情况下可以通过更换质量较好的镜头,在一定程度上减小轴向色差导致的测量误差。而横向色差是由于不同波长的光通过透镜成像时,光的放大率不同,导致成像的高度不同,则红、绿、蓝三种颜色在同一平面成像在不同的位置,使图像出现一些非正常的彩色条纹,如图2(c)所示。
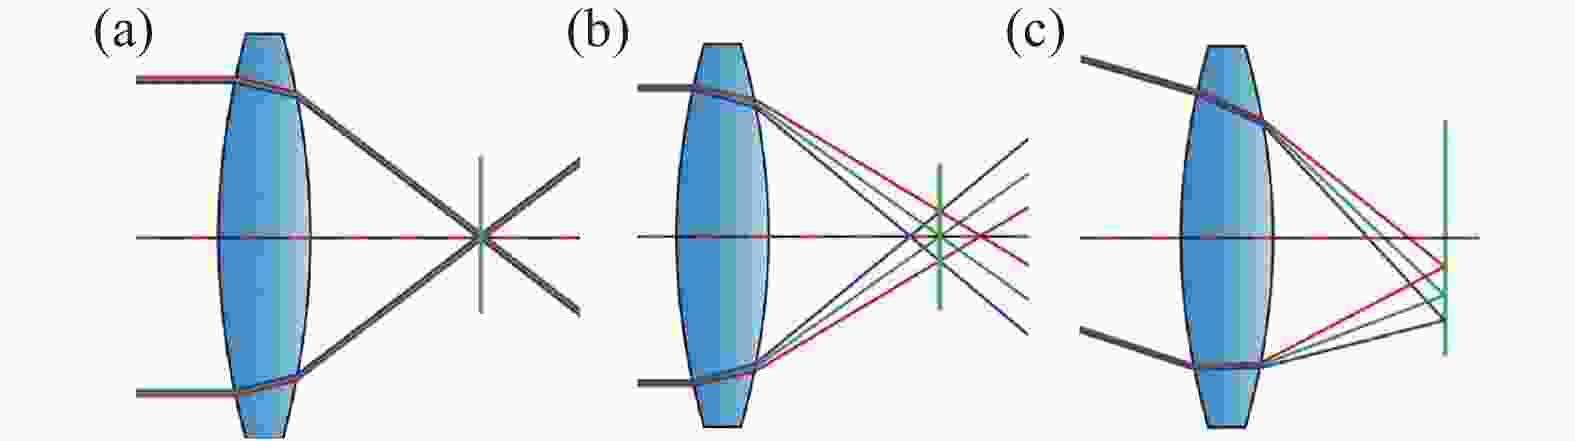
图 2 色差示意图。(a) 理想无色差;(b) 轴向色差;(c) 横向色差
Figure 2. Chromatic aberration diagram. (a) Ideal chromatic aberration-free; (b) Longitudinal chromatic aberration; (c) Lateral chromatic aberration
-
基本的三通道相位轮廓测量系统由一台彩色CCD相机和一台DLP投影仪组成,同时,将一个LCD显示屏作为相位标靶与相机和投影仪一起构成投影仪色差建模与校正系统,如图3所示。
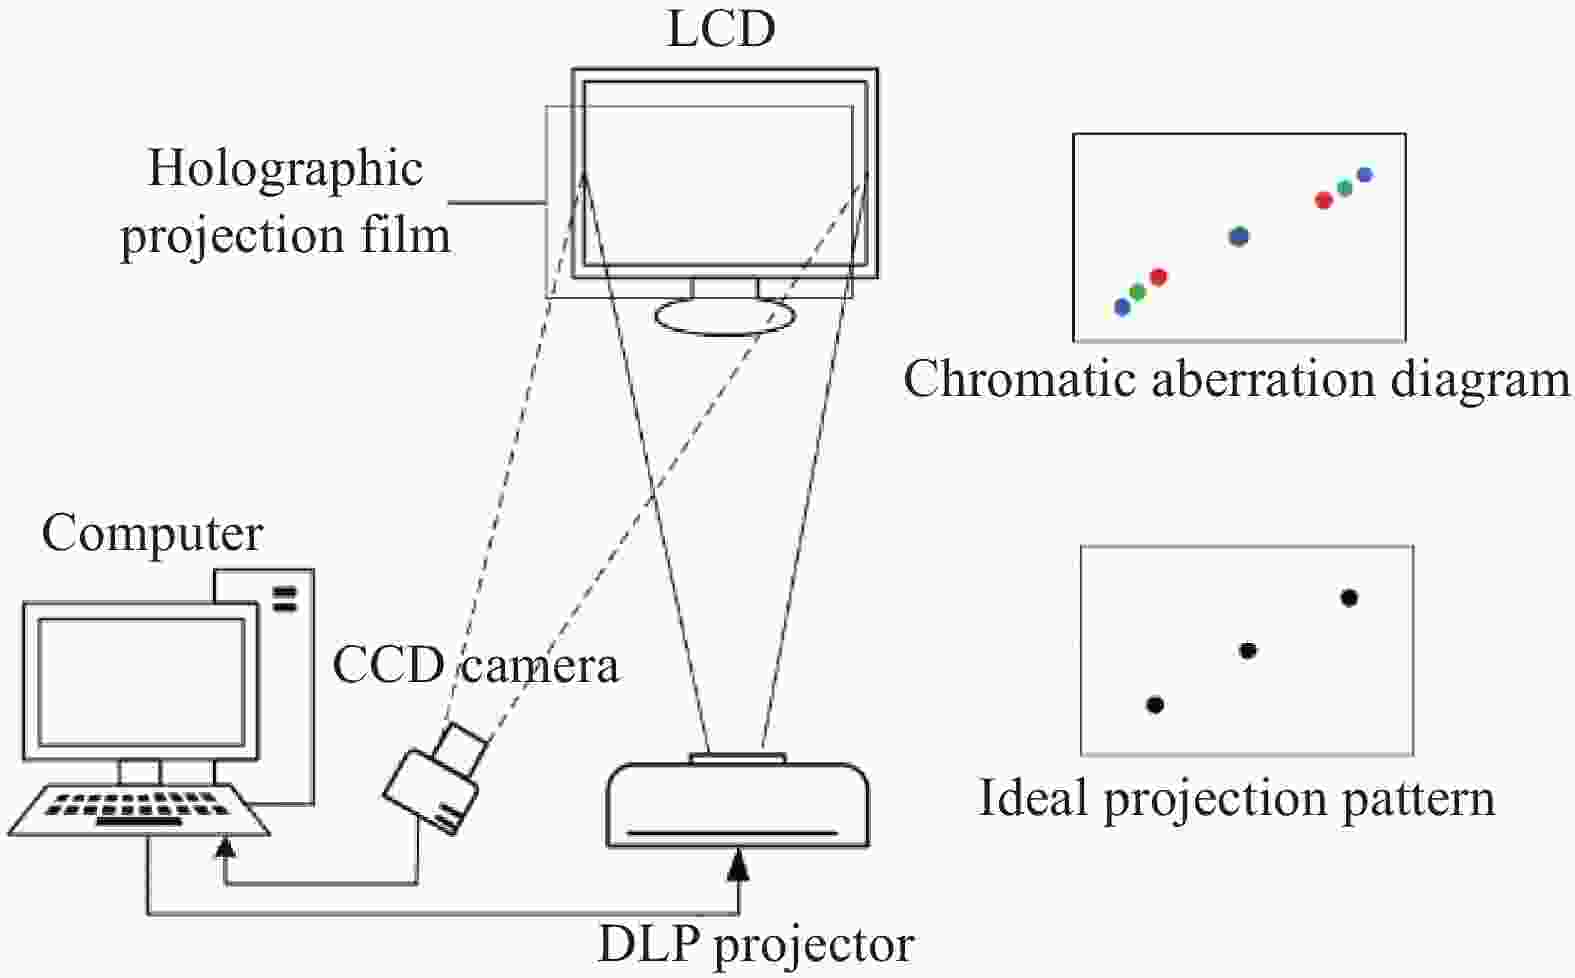
图 3 系统结构示意图
Figure 3. Schematic diagram of system structure
由于投影仪色差且离成像中心越远,色差越明显,可以建立色差与位置之间的关系。文中提出了一种新的基于相位标靶的相位测量轮廓术投影色差建模方法,将LCD显示屏作为相位标靶进行分析研究。首先关闭投影仪,由LCD显示屏直接显示条纹, LCD依次显示红、绿、蓝三种颜色的水平正弦条纹和垂直正弦条纹图像,然后由彩色CCD相机分别采集LCD显示的图像,则该图像只包含相机色差。关闭LCD显示屏,打开投影仪,由投影仪向显示屏依次投影相同的图像,此时CCD相机采集的图像包含投影仪色差和相机色差。然后使用四步相移法进行相位折叠,使用最佳三条纹选择方法进行相位展开,计算得到LCD显示的展开相位$ {\varphi }_{lcd\_h\_r} $、$ {\varphi }_{lcd\_v\_r} $和$ {\varphi }_{lcd\_h\_g} $、$ {\varphi }_{lcd\_v\_g} $和$ {\varphi }_{lcd\_h\_b} $、$ {\varphi }_{lcd\_v\_b} $,以及投影仪投影的展开相位$ {\varphi }_{pro\_h\_r} $、$ {\varphi }_{pro\_v\_r} $和$ {\varphi }_{pro\_h\_g} $、$ {\varphi }_{pro\_v\_g} $和$ {\varphi }_{pro\_h\_b} $、$ {\varphi }_{pro\_v\_b} $。然后利用中值滤波的方法去除突起点,拟合为平滑曲面,建立计算出的六组展开相位和相机像素X、Y的数学模型。最后进行理想显示像素点求解以及色差像素模型建立。投影仪色差建模流程图如图4所示。

图 4 投影仪色差建模流程图
Figure 4. Flowchart of projector chromatic aberration modeling
-
由于相机色差的存在,CCD相机采集红、绿、蓝三种通道的同一个像素点的位置也并不重合,需要一个拟合过程来消除相机色差对投影仪色差建模的影响。文中将绿色通道作为理想通道,因此像素点位置与LCD屏显示的绿色条纹相位和投影仪投影的绿色条纹相位的对应关系为理想的对应关系。由于噪声的影响,不可避免计算出的展开有突起点,使用3×3的中值滤波去除明显的粗大误差点。将像素位置作为横纵坐标,拟合展开相位曲面。分别进行一次、二次、三次的曲面拟合,以$ {\phi }_{pro\_h\_g} $为例,拟合结果如表1所示。进行二次曲面拟合的拟合度能达到1,并且均方根误差较小,拟合过程的复杂程度适中。因此,选用二次拟合的方式将红、绿、蓝三颜色通道两个方向的LCD显示条纹展开相位和投影仪投影条纹展开相位拟合为二次曲面。
表 1 拟合结果对比
Table 1. Comparison of fitting results
$ {\varphi }_{pro\_h\_g} $ R-square RMSE Complexity Poly11: 0.9998 1.3860 Simple Poly22: 1 0.5930 Moderate Poly33: 1 0.4819 Complex 拟合出的结果都符合公式(1):
$$ f\left(x,y\right)=p00+p10x+p01y+p20{x}^{2} +p11xy+p02{y}^{2} $$ (1) 式中:x,y表示像素点的位置;f(x, y)表示展开相位的值;p00、p10、p01、p20、p11、p02为拟合出的系数。
为了获取蓝色通道理想的投影仪投影相位值,首先需要拟合蓝色LCD显示像素点,即为在LCD显示蓝色通道中取与绿色相位点的值相同的像素点,该像素点对应的投影仪绿色通道的相位点则为蓝色通道补偿后应投影出的条纹相位。由于LCD显示的蓝色和绿色条纹相位都可以拟合成关于像素点位置的方程,可以将LCD显示的蓝色相位值代入到LCD显示绿色的方程中,计算出在该相位值时像素点的值。计算方程组如公式(2)所示:
$$\left\{\begin{array}{l}{\varphi }_{lcd\_h\_b}= lgh00+xlgh10+ylgh01+\\ \qquad \quad {x}^{2}lgh20+xylgh11+{y}^{2}lgh02\\ {\varphi }_{lcd\_v\_b}=lgv00+xlgv10+ylgv01+\\ \qquad \quad {x}^{2}lgv20+xylgv11+{y}^{2}lgv02\end{array}\right. $$ (2) 其中,$ {\varphi }_{lcd\_h\_b} $和$ {\varphi }_{lcd\_v\_b} $作为已知,lgh和lgv代表已经拟合出的绿色显示水平和垂直方向关于像素点的数学模型的系数。求解出x和y得到理想显示像素。
-
根据上一节中计算出的理想显示相位及其对应的理想像素点,将解出的像素点代入到投影仪投影的拟合数学模型中,得到理想的红蓝投影仪投影相位$ {\varphi }_{ideal\_pro\_h\_b} $、$ {\varphi }_{ideal\_pro\_v\_b} $、$ {\varphi }_{ideal\_pro\_h\_r} $、$ {\varphi }_{ideal\_pro\_v\_r} $。新的理想投影仪投影的蓝色和红色相位同样可以拟合成关于整数像素点的新的二元二次数学模型,且拟合度均能达到1。
理想像素点对应的投影仪投影的蓝色通道和红色通道相位点即为理想的蓝色和红色投影相位,将理想的红色和蓝色投影相位与绿色通道相位差的视为色差,则蓝绿通道的投影仪水平方向和垂直方向的投影仪色差的计算公式为:
$$ {\Delta \mathrm{\varphi }}_{bg\_h}={\varphi }_{ideal\_pro\_h\_b}-{\varphi }_{pro\_h\_g} $$ (3) $$ {\Delta \mathrm{\varphi }}_{bg\_v}={\varphi }_{ideal\_pro\_v\_b}-{\varphi }_{pro\_v\_g} $$ (4) $$ \overrightarrow{{\Delta \varphi }_{bg}}=\left({\Delta \mathrm{\varphi }}_{bg\_h},{\Delta \mathrm{\varphi }}_{bg\_v}\right) $$ (5) 同理,红绿通道的投影仪水平方向和垂直方向的色差的计算公式为:
$$ {\Delta \mathrm{\varphi }}_{rg\_h}={\varphi }_{ideal\_pro\_h\_r}-{\varphi }_{pro\_h\_g} $$ (6) $$ {\Delta \mathrm{\varphi }}_{rg\_v}={\varphi }_{ideal\_pro\_v\_r}-{\varphi }_{pro\_v\_g} $$ (7) $$ \overrightarrow{{\Delta \varphi }_{rg}}=\left({\Delta \mathrm{\varphi }}_{rg\_h},{\Delta \mathrm{\varphi }}_{rg\_v}\right) $$ (8) 由于$ {\varphi }_{ideal\_pro\_h\_b} $、$ {\varphi }_{ideal\_pro\_v\_b} $、$ {\varphi }_{ideal\_pro\_h\_r} $、$ {\varphi }_{ideal\_pro\_v\_r} $和$ {\varphi }_{pro\_h\_g} $、$ {\varphi }_{pro\_v\_g} $都可以拟合成关于像素横纵坐标的二元二次的数学模型,则投影仪投影的理想蓝色通道和红色通道相位减去投影仪投影的绿色通道相位可以建立关于整数像素点的二元二次的数学模型,即投影仪的水平方向和垂直方向的蓝绿色差可以建立一个二元二次的数学模型。同理,水平方向和垂直方向的投影仪红绿色差也可建立二元二次的色差模型。
-
由于CCD相机的影响,投影仪色差不能直接通过补偿相机采集的图像进行投影仪色差校正,文中使用生成预补偿条纹的方法进行投影仪色差校正。通过已计算出的投影仪色差生成预补偿条纹,再重新投影到相位标靶上,重新计算投影仪色差,以此验证校正方法的有效性。投影仪色差校正示意图如图5所示。

图 5 投影仪色差校正示意图
Figure 5. Schematic diagram of chromatic aberration correction of projector
条纹图的同一像素点经过投影后,色差会导致经红、绿、蓝三种颜色通道的位置差异。提前生成预补偿图像,将红、绿、蓝三种颜色通道的点进行位置偏移,再经过投影仪投影,使投影后的三种颜色通道的点能够汇聚在一点上,从而实现色差校正。
由于计算出的色差数学模型是关于CCD相机像素横纵坐标的数学模型,则每一个CCD相机像素点的红绿色差和蓝绿色差都是已知的。同时,由于计算出的是色差的数学模型,像素点为非整数时的投影仪色差也极易获得。重投影时需要的预补偿条纹应符合投影仪像素,而计算出的投影仪色差模型是基于相机像素的,所以需要转换计算投影仪分辨率下的色差模型。以某一点P为例,将CCD相机分辨率下的P点的像素坐标记为(Pcx, Pcy),转换到投影仪分辨率下,其像素坐标为(Ppx, Ppy),则P点像素在相机分辨率下和投影仪分辨率下的对应关系如公式(9)所示:
$$ \left\{\begin{array}{c}{P}_{px}={P}_{cx}\times {H}_{c}/{H}_{p}\\ {P}_{py}={P}_{cy}\times {V}_{c}⁄{V}_{p}\end{array}\right. $$ (9) 式中:Hc、Vc代表CCD相机的分辨率大小;Hp、Vp代表DLP投影仪的分辨率大小。由于有了相应的色差模型,每一个像素点对应的蓝绿色差和红绿色差都能精准、快速地计算出来,与插值的方法相比,既提高了计算精度,又减少了计算时间,进而提高了测量精度和校正效率。根据色差模型计算出蓝色通道和红色通道理想像素值,再生成符合最佳三条纹和四步相移的预补偿条纹图。
重新投影预补偿条纹即可校正投影仪色差。绿色通道的条纹图像与初投影时相同,继续以2.1节的方法进行色差计算,建立重投影的投影仪蓝绿通道和红绿通道色差模型,最终通过对比初投影时和重投影时的投影仪色差大小,验证基于相位标靶的投影仪色差建模与校正方法研究的有效性。再将预补偿条纹运用到之后的三维测量系统中,以减少投影仪色差对整体测量带来的影响,提高三通道相位测量轮廓术的测量精度。
-
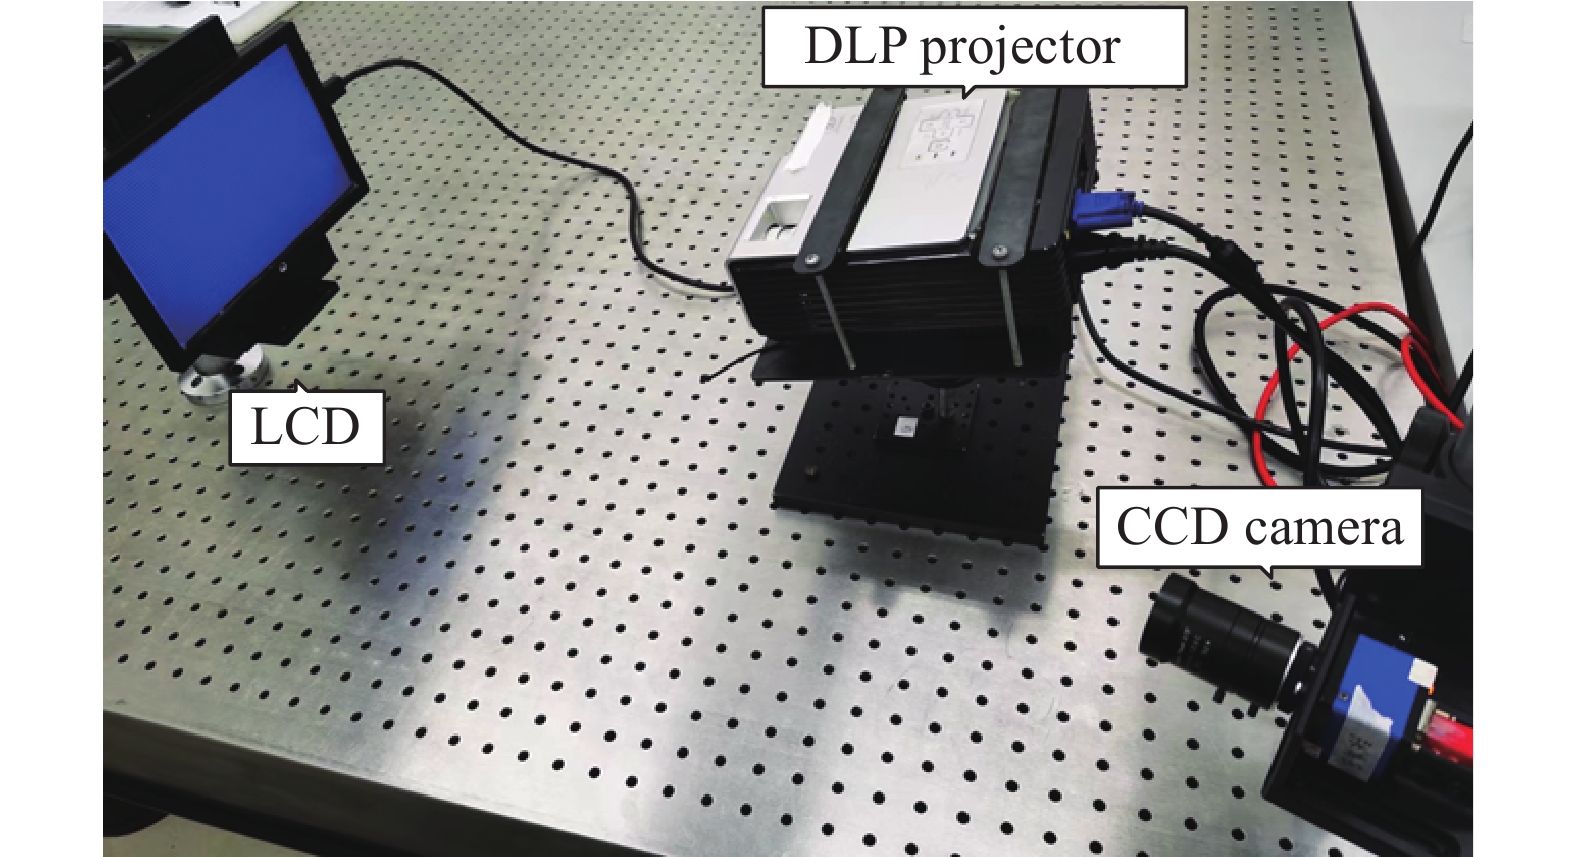
文中所需搭建的实验系统如图6所示。基于相位标靶的投影色差建模与方法研究所需的硬件有:一个彩色CCD相机,其型号为ECO424 CVG (SVS-VISTEK);一个LCD显示屏,其型号为CYS-R101;一个DLP投影仪,其型号为CP270 (BenQ)。为保证实验的严谨性,保持实验过程在黑暗环境下进行。

图 6 投影仪色差建模与校正实验硬件系统图
Figure 6. System diagram of projector chromatic aberration modeling and correction experiment
-
首先对投影仪全局投影进行投影仪色差建模。利用2.1节的方法,以绿色通道作为理想通道,计算投影仪色差的数学模型。以投影仪水平方向色差为横向量,以投影仪垂直方向色差为列向量,绘制投影仪色差矢量图。投影仪蓝绿通道色差矢量图如图7所示。

图 7 投影仪蓝绿通道色差矢量图
Figure 7. Chromatic aberration vector diagram of projector blue and green channels
得到蓝绿通道的色差模型方程式如下:
$$ \begin{split} \Delta bg\_h=& -0.356\;8+0.000\;309\;1x+0.001\;438y-\\ & 0.000\;000\;511\;3{x}^{2}+0.000\;000\;195\;9xy-\\ & 0.000\;000\;301\;7{y}^{2}\\ \Delta bg\_v=& -0.489\;2+0.001\;311x-0.000\;070\;8y+\\ &0.000\;000\;236\;2{x}^{2}+0.000\;000\;259xy-\\ & 0.000\;000\;079\;62{y}^{2} \end{split}$$ (10) 计算出投影仪蓝绿通道的最大色差为0.6090 pixel,平均色差为0.3255 pixel。
投影仪红绿通道色差矢量图如图8所示。
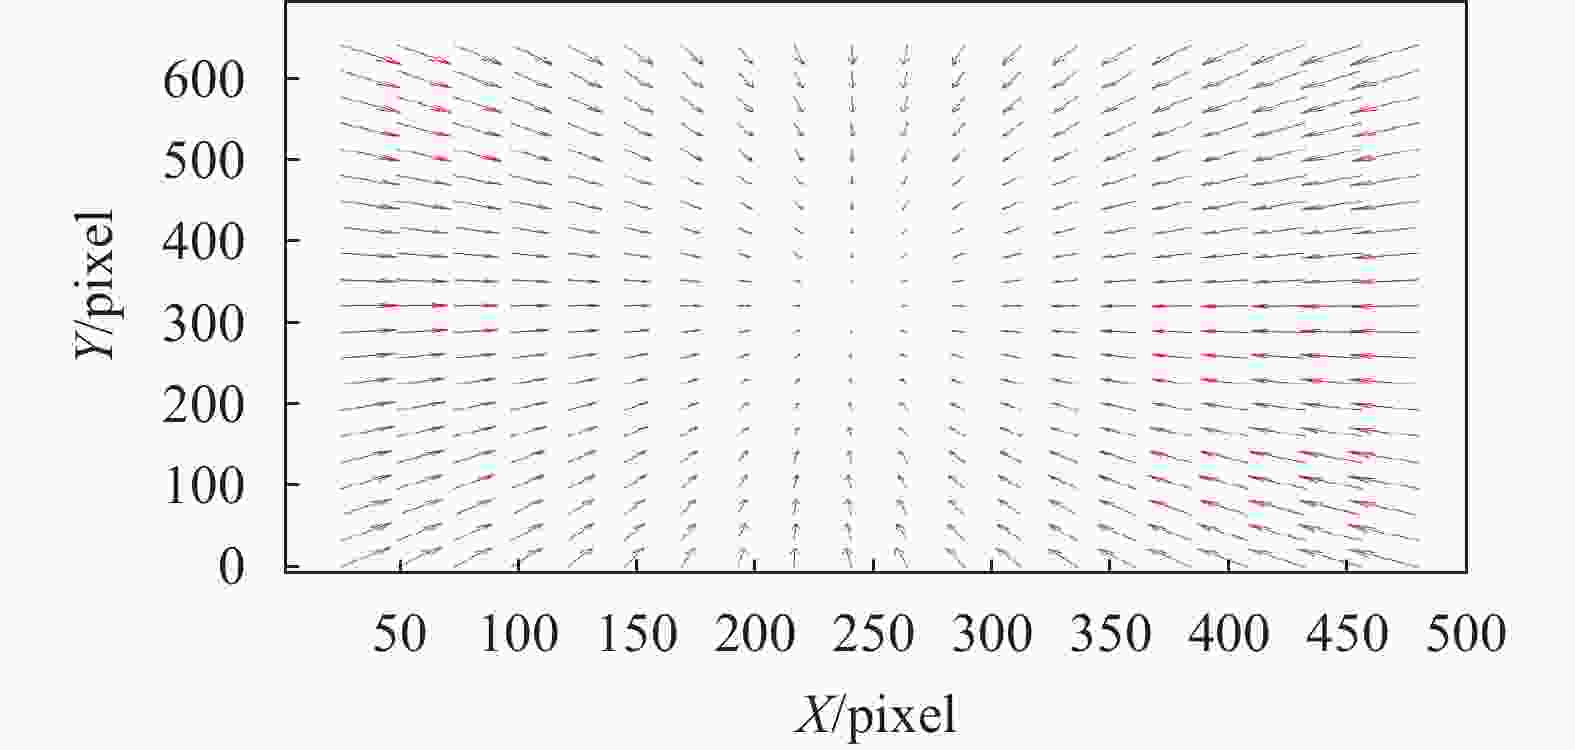
图 8 投影仪红绿通道色差矢量图
Figure 8. Chromatic aberration vector diagram of projector red and green channels
得到红绿通道的色差模型方程式为:
$$\begin{split} \Delta rg\_h=& 0.366\;8-0.001\;104x-0.000\;051\;8y-\\ & 0.000\;000\;054\;05{x}^{2}+0.000\;000\;096\;01xy-\\ & 0.000\;000\;0439\;2{y}^{2}\\ \Delta rg\_v=& 0.474\;8+0.000\;240\;3x-0.002\;065y-\\ & 0.000\;000\;140\;7{x}^{2}-0.000\;000\;236\;7xy-\\ & 0.000\;000\;373\;1{y}^{2}\\[-8pt] \end{split} $$ (11) 计算出投影仪红绿通道的最大色差为0.7225 pixel,平均色差为0.3651 pixel。
色差矢量图中,箭头的指向代表色差的方向,箭头的大小代表色差的大小。由蓝绿通道色差矢量图和红绿色差矢量图可以看出,投影仪越靠近中间的部分色差最小,越靠近四周的部分色差越大。同时,蓝绿通道色差方向与红绿通道色差方向完全相反,投影仪蓝绿通道色差方向由中心指向四周,投影仪红绿通道的色差由四周指向中心,这是由于三种颜色光线波长不同造成的。最终实验结果与理论相符。由于该方法可以得到全局的蓝绿通道色差和红绿通道色差,即使是处于图像最边缘位置的色差也不存在粗大误差的问题,以便于后续对色差进行补偿校正。
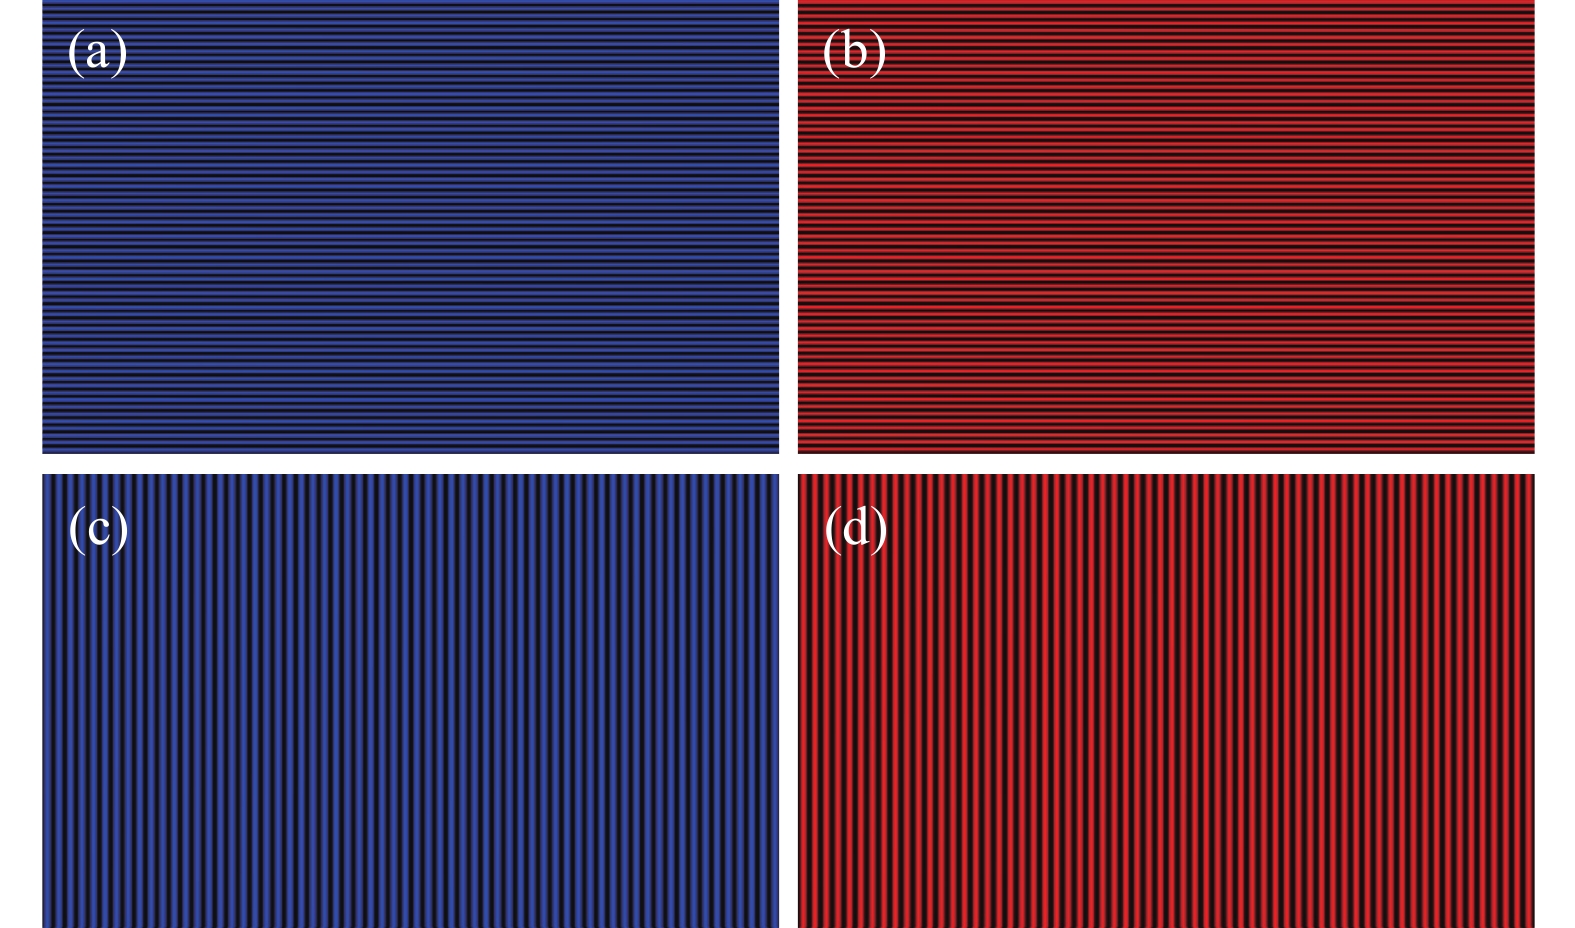
下一步对投影仪色差进行校正,文中只针对投影仪色差进行分析研究,在色差建模的过程中,保证了相位标靶与投影仪投影平面的平行,并没有对相机平面和相位标靶之间的位置关系进行确定,因此不能直接将计算出的色差模型的结果补偿到三维测量数据中。文中采用生成与补偿条纹、然后重投影的方法进行投影仪色差校正。经过上述实验可以得到投影仪红色通道和蓝色通道间的色差模型,其结果如公式(10)、(11)所示。利用公式(9)可以将CCD像素坐标系下的投影仪色差转换为投影仪像素坐标系下的投影仪色差模型,生成新的蓝色通道和红色通道的预补偿条纹图像。文中采用最佳三条纹选择方法进行相位计算,因此需要投影三个频率的条纹图。根据色差模型计算出蓝色通道和红色通道理想像素值,生成64、63、56个周期的符合四步相移的预补偿条纹图。新生成的部分条纹图如图9所示。
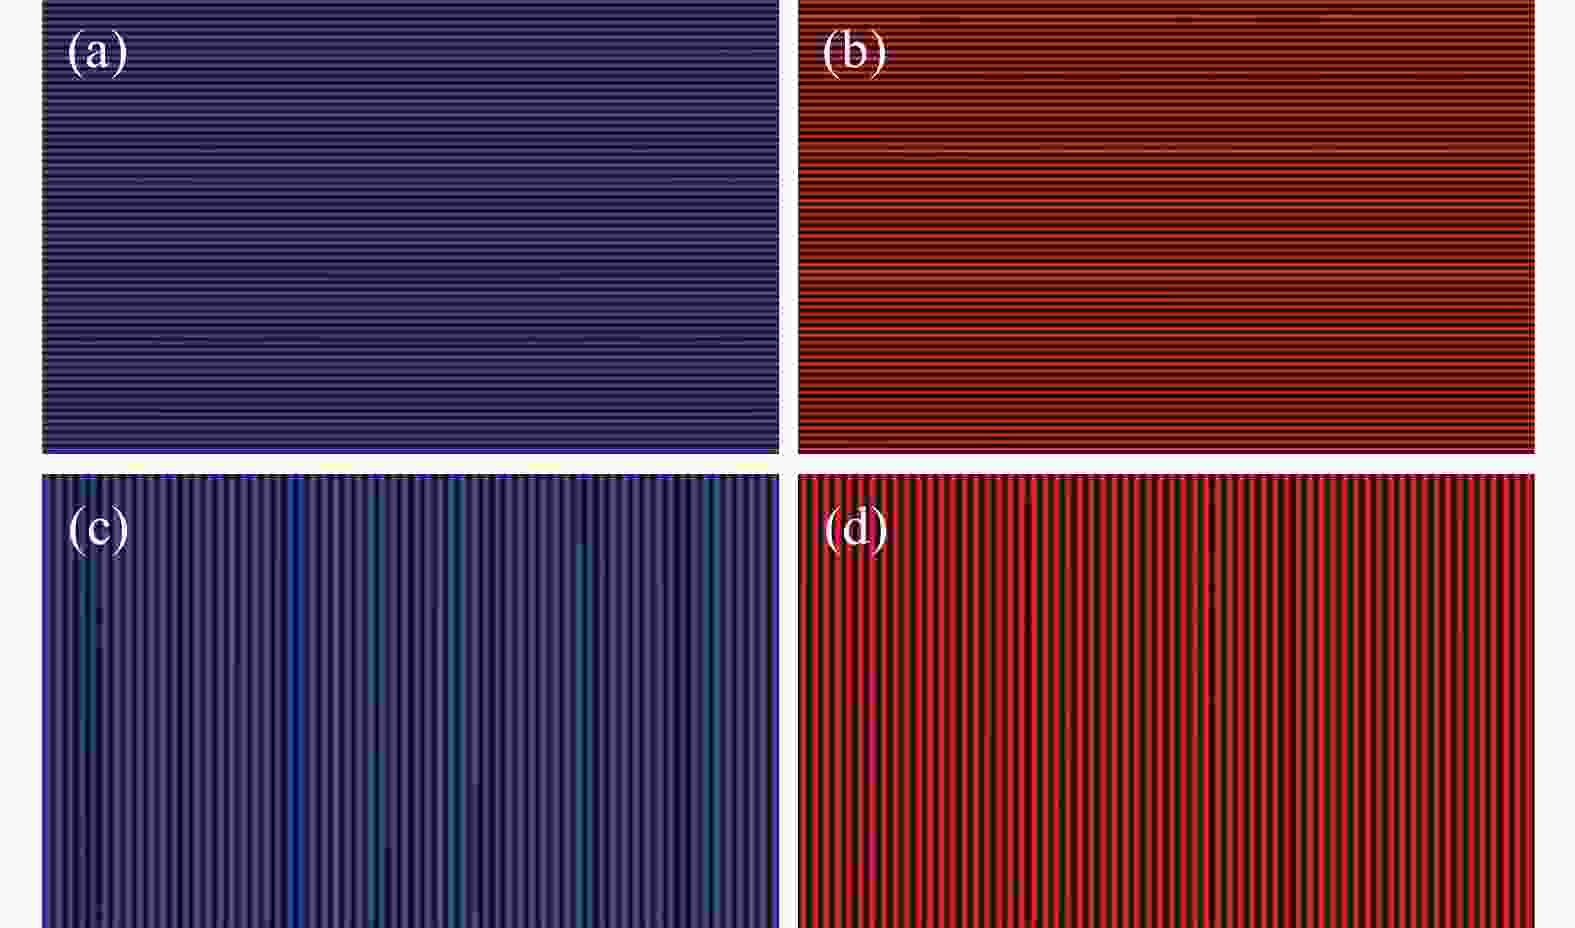
图 9 预补偿条纹。(a)水平方向蓝色通道预补偿条纹;(b)水平方向红色通道预补偿条纹;(c)垂直方向蓝色通道预补偿条纹;(d)垂直方向红色通道预补偿条纹
Figure 9. Pre-compensated fringes. (a) Horizontal blue channel pre-compensated fringe; (b) Horizontal red channel pre-compensation fringe; (c) Vertical blue channel pre-compensation fringe; (d) Vertical red channel pre-compensation fringe
将预补偿条纹重新投影到LCD显示屏上,再由CCD相机进行采集。重复初投影的方法步骤,计算新的蓝绿通道和红绿通道的投影仪色差,以验证该校正方法的有效性。计算出重投影的投影仪蓝绿通道的最大色差为0.2479 pixel,平均色差为0.1063 pixel。重投影的投影仪红绿通道的最大色差为0.2590 pixel,平均色差为0.1114 pixel。为了直观体现色差校正的效果,如图10所示,对比了预补偿重投影前后的投影仪色差矢量变化。彩色箭头代表补偿前的投影仪色差矢量,黑色箭头代表重投影预补偿条纹后的投影仪色差矢量,可以明显观察到色差有所减小,验证了重投影方法对校正投影仪色差的有效性。

图 10 初投影与重投影色差矢量对比图。(a)蓝绿通道;(b)红绿通道
Figure 10. Chromatic aberration vector comparison between primary projection and reprojection. (a) Blue and green channels; (b) Red and green channels
-
为了验证利用建立数学测量投影仪色差方法的适用性,文中采用不同的投影仪对该投影仪色差进行建模。新选用的投影仪为实验室中常用的PRO4500数字投影仪, 按照文中所提出的投影仪色差建模的方法步骤进行实验。以绿色通道为基准,分别建立蓝绿通道和红绿通道的色差模型。蓝绿通道水平方向和垂直方向的投影仪色差矢量图如图11所示。

图 11 投影仪蓝绿通道色差矢量图
Figure 11. Chromatic aberration vector diagram of projector blue and green channels
得到PRO4500投影仪蓝绿通道色差模型的方程式为:
$$ \begin{split} \Delta bg\_h=& -0.158\;8+0.000\;078\;87x+0.000\;694\;5y\\ &{x}^{2}+0.000\;000\;275\;4xy-0.000\;000\;248{y}^{2}\\ \Delta bg\_v=& -0.285\;0+0.000\;683\;8x+0.000\;020\;06y+\\ &0.000\;000\;341\;3{x}^{2}+0.000\;000\;021\;93xy-\\ & 0.000\;000\;060\;18{y}^{2}\\[-8pt] \end{split} $$ (12) 经计算,投影仪蓝绿通道最大色差为0.3459 pixel,平均色差为0.1844 pixel。
红绿通道水平方向和垂直方向的投影仪色差矢量图如图12所示。

图 12 投影仪红绿通道色差矢量图
Figure 12. Chromatic aberration vector diagram of projector red and green channels
得到PRO4500投影仪红绿通道色差模型的方程式为:
$$ \begin{split} \Delta rg\_h=&0.159\;3+0.000\;164\;2x-0.000\;751\;8y\\ & 0.000\;000\;067\;52{x}^{2}-0.000\;000\;297\;9xy-\\ & 0.000\;000\;0133\;7{y}^{2}-\\ \Delta rg\_v=& 0.286\;1-0.000\;783\;6x-0.000\;104\;5y-\\ & 0.000\;000\;245\;4{x}^{2}+0.000\;000\;211\;1xy-\\ & 0.000\;000\;019\;26{y}^{2} \end{split} $$ (13) 经计算,投影仪红绿通道最大色差为0.3814 pixel,平均色差为0.1951 pixel。由于PRO4500投影仪通常为实验专用投影仪,精度较高,相较于之前的CP270 (BenQ)商业投影仪来说色差较小,实验结果符合预期。
-
预补偿前后的彩色条纹进行光学三维测量,验证预补偿前后光学系统的测量精度。实验系统可以保证投影仪投影的条纹能覆盖台阶表面,同时,相机采集视场能采集到台阶表面的全部信息。
校正投影仪色差前后恢复的台阶的三维形貌如图13所示。

图 13 投影仪色差校正前后台阶三维形貌。(a)校正前的台阶三维形貌;(b)校正后的台阶三维形貌
Figure 13. 3D topography of steps before and after chromatic aberration correction of projector. (a) 3D morphology of the step before correction; (b) 3D morphology of the step after correction
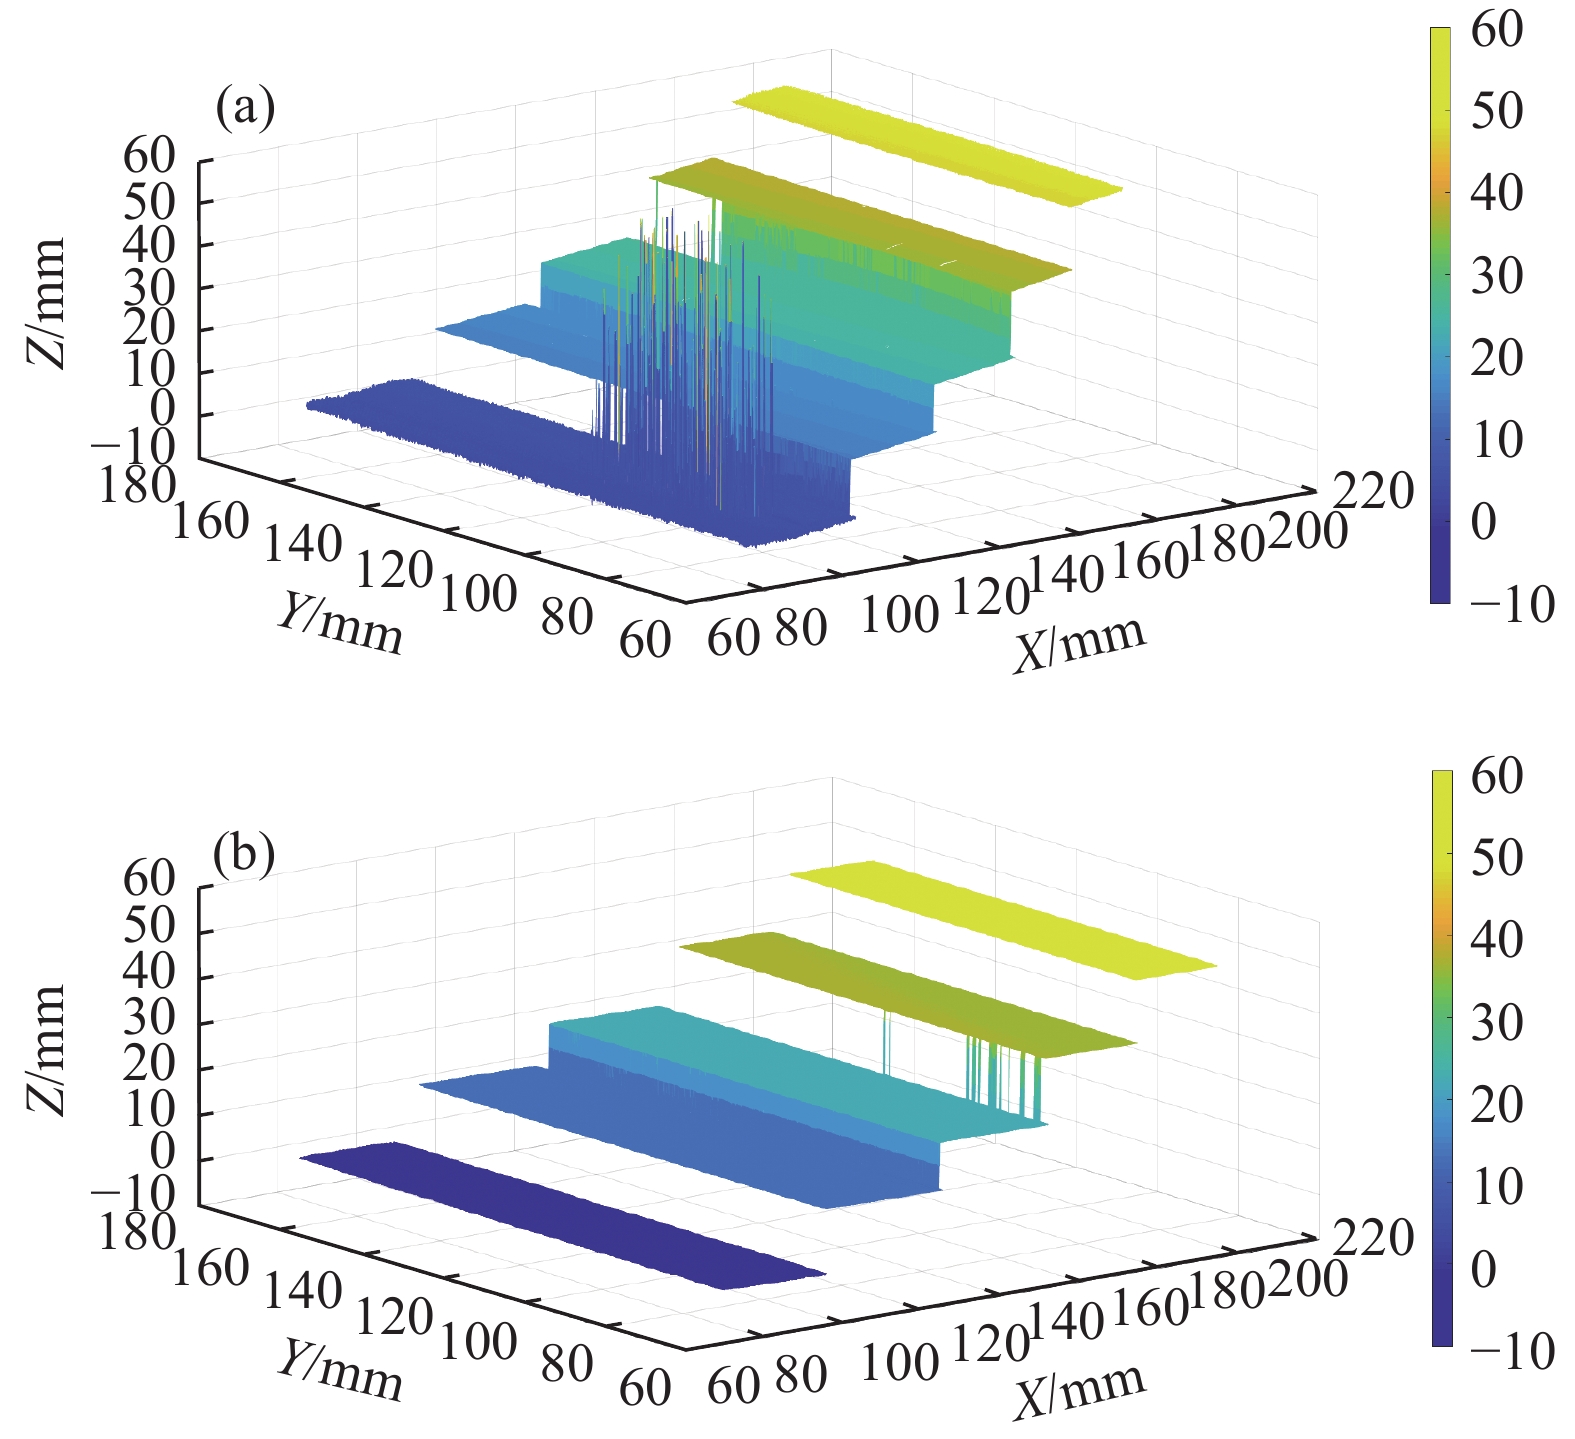
可以看出,相较于校正色差前的恢复效果,校正投影仪色差后恢复的台阶的三维形貌更平滑,噪声更少。为了进一步验证文中提出的基于相位标靶的投影色差建模方法的有效性,再使用PRO4500投影仪进行台阶间距测量实验,得到的校正前后的台阶三维形貌图如图14所示。可以看出,校正投影仪色差后,整体的测量精度有了进一步提高。

图 14 PRO4500投影仪色差校正前后台阶三维形貌。(a) 校正前的台阶三维图;(b) 校正后的台阶三维图
Figure 14. 3D topography of step before and after chromatic aberration correction of PRO4500 projector. (a) 3D morphology of the step before correction; (b) 3D morphology of the step after correction
为了定量评价校正前后的精度,对台阶间的间距进行了对比。使用三坐标测量仪测量实验台阶相邻台阶面的高度,并以该结果作为标准值,三坐标测量仪的型号为 Zeiss Contura-G2,当环境温度范围为18~22 ℃时,长度测量误差为 1.5+L/350 m,扫描误差为 2 μm。选择第二、三、四级台阶间距进行测量计算,投影三次相同的条纹到台阶表面并采集变形条纹图像,计算三组数据,对测量出的三组台阶间距取平均值,作为利用该条纹测量台阶间距的测量值。对比台阶间距的标准值与校正不同型号投影仪色差前后的数据。不同的台阶间距数据如表2所示。
从表2中可以得出,校正投影仪色差前的三个台阶间距的平均误差为0.489 mm,校正投影仪色差后的三个台阶间距的平均误差为0.038 mm。校正PRO4500投影仪色差前的三个台阶间距的平均误差为0.051 mm,校正PRO4500投影仪色差后的三个台阶间距的平均误差为0.025 mm。对比校正CP270投影仪和PRO4500投影仪色差前后的精度误差,可以得出文中提出的基于相位标靶的投影色差建模与校正方法能够较好地提升相位轮廓测量术中的投影质量,提升精度较差的商业投影仪的测量精度,使其能够达到实验所需的效果;对于本身精度较高的投影仪来说,该方法能够进一步提高测量精度。
表 2 校正投影仪色差前后台阶间距测量值(单位:mm)
Table 2. Measurement value of step spacing before and after correcting projector chromatic aberration (Unit: mm)
Projector model Step spacing Standard value Before correction After correction Pre-correction error Corrected error CP270 Step surface
2-313.258 13.732 13.308 0.474 0.050 Step surface
3-418.422 17.918 18.447 −0.504 0.025 PRO4500 Step surface
2-313.258 13.317 13.220 0.059 −0.038 Step surface
3-418.422 18.465 18.411 0.043 −0.011 -
文中开展了基于相位标靶的相位测量轮廓术投影色差建模和校正研究。所提出的方法不同于以往利用插值算法,计算速度得到了很大的提升,提高了测量效率,同时避免了相机的耦合误差。实验结果表明,进行投影仪色差建模和校正可以提高三通道相位测量轮廓术的测量精度,实测台阶的平均误差从0.489 mm减少到0.038 mm,可用于该类技术中不同型号的投影仪色差测量与校正。
Projection chromatic aberration modeling and correction of phase measurement profilometry based on phase target
-
摘要: 光学三维测量中的三通道相位测量轮廓术具有高精度、易识别、自动化程度高等优点,在科学研究和工程应用中获得了广泛的关注。在三通道相位测量轮廓术中,投影仪不同通道间的色差成为影响测量精度的关键因素。针对该问题,文中开展了基于相位标靶的相位测量轮廓术投影色差建模与校正研究。提出了将带有全息投影膜的液晶显示屏(Liquid Crystal Display, LCD)当作相位标靶对投影色差建模与校正的方法。通过LCD显示条纹与投影仪投射条纹的相位,计算投影仪色差并建立其数学模型。然后通过预补偿的方法实现投影仪三通道投射色差的校正,进行实验验证校正前后对相位测量轮廓术精度的影响。实验结果表明,文中所提方法的校正效果为蓝绿通道的平均色差由0.3255 pixel校正为0.1063 pixel,红绿通道的平均色差由0.3651 pixel校正为0.1114 pixel。该方法可为三通道相位测量轮廓术提升投影质量。实测台阶的平均误差从0.489 mm减少到0.038 mm。实验结果验证了投影仪色差建模与校正方法的有效性,提升了三通道相位测量轮廓术的整体测量精度。与已有方法相比,可以有效避免相机误差带来的影响,大大缩短计算时间,能够适用于不同型号的投影仪色差测量与校正。Abstract:
Objective Due to the advantages of high precision, easy recognition and high degree of automation, the three-channel phase measurement profilometry in optical three-dimensional measurement has gained increasing attention in both scientific research and engineering applications. For three-channel phase measurement profilometry, the chromatic aberration between projector channels is the key factor affecting the measurement accuracy. Most of the existing chromatic aberration correction methods of projectors regard projectors as "reverse cameras". Therefore, the accuracy of correction results will be dependent on the imaging quality of the camera. Moreover, the existing chromatic aberration measurement and correction methods still have shortcomings, so it is significant to improve the measurement accuracy of the system. Therefore, this study carries out the research on the projection chromatic aberration modeling and correction of phase target-based phase measurement profilometry. Methods In this paper, the projection chromatic aberration modeling and correction method using the LCD screen with holographic projection film as the phase target is proposed (Fig.3). Firstly, the unfolded phase of LCD display fringes and projector projection fringes are calculated respectively. Next, binary fitting on display phase and projection phase are carried out. The green channel is regarded as an ideal channel, and the ideal pixel values of red and blue channels is calculated. Then the ideal pixel is substituted into the projection equation, and the ideal phases of the red and blue channels are obtained. Thus, the mathematical model of the chromatic aberration of the projector is established. Finally, the pre-compensation of projection fringes is implemented with the established chromatic aberration model(Fig.5). Then, the pre-compensated fringes are projected in three channels, so that the chromatic aberration of the projector is corrected. Results and Discussions The experimental results demonstrated the performance of the proposed method. The average chromatic aberration of the blue and green channels is corrected from 0.325 5 pixel to 0.106 3 pixel. The average chromatic aberration of the red and green channels is corrected from 0.365 1 pixel to 0.111 4 pixel (Fig.10). This method can effectively improve the projection quality for three-channel phase measurement profilometry. The average error of the measured step is reduced from 0.489 mm to 0.038 mm (Tab.2). The experimental results verified the effectiveness of the chromatic aberration modeling and correction method of projector. This method can improve the overall measurement accuracy of three-channel phase measurement profilometry. Compared with the existing methods, the proposed method can be calibrated to avoid the impact of camera errors and effectively shorten the calculation time. Moreover, this method can be applied to the measurement and correction of different projector chromatic aberration. Conclusions A phase-measurement contouring chromatic aberration modeling method using an LCD display as a phase target is designed and calibrated for study. This method eliminated the coupling error of the camera while measuring and calibrating the projector chromatic aberration, and enabled measurement of the projector chromatic aberration at global pixel points, while using mathematical modeling to model the projector chromatic aberration in a chromatic way to shorten the calculation time. By measuring the 3D shape of the actual object for accuracy comparison experiments and comparing the accuracy error before and after correcting the chromatic aberration of CP270 projector and PRO4500 projector, it can be concluded that the projection chromatic aberration modeling and correction study based on phase target proposed in this paper can better improve the projection quality in phase contour measurement and enhance the measurement accuracy of commercial projectors with poor accuracy. For the projectors with low accuracy, the method of correcting chromatic aberration in this paper can greatly improve the measurement accuracy of projectors. For the projectors with high accuracy, the proposed projector chromatic aberration modeling and correction method can further improve the measurement accuracy. -
图 2 色差示意图。(a) 理想无色差;(b) 轴向色差;(c) 横向色差
Figure 2. Chromatic aberration diagram. (a) Ideal chromatic aberration-free; (b) Longitudinal chromatic aberration; (c) Lateral chromatic aberration
图 5 投影仪色差校正示意图
Figure 5. Schematic diagram of chromatic aberration correction of projector
图 6 投影仪色差建模与校正实验硬件系统图
Figure 6. System diagram of projector chromatic aberration modeling and correction experiment
图 7 投影仪蓝绿通道色差矢量图
Figure 7. Chromatic aberration vector diagram of projector blue and green channels
图 8 投影仪红绿通道色差矢量图
Figure 8. Chromatic aberration vector diagram of projector red and green channels
图 9 预补偿条纹。(a)水平方向蓝色通道预补偿条纹;(b)水平方向红色通道预补偿条纹;(c)垂直方向蓝色通道预补偿条纹;(d)垂直方向红色通道预补偿条纹
Figure 9. Pre-compensated fringes. (a) Horizontal blue channel pre-compensated fringe; (b) Horizontal red channel pre-compensation fringe; (c) Vertical blue channel pre-compensation fringe; (d) Vertical red channel pre-compensation fringe
图 10 初投影与重投影色差矢量对比图。(a)蓝绿通道;(b)红绿通道
Figure 10. Chromatic aberration vector comparison between primary projection and reprojection. (a) Blue and green channels; (b) Red and green channels
图 11 投影仪蓝绿通道色差矢量图
Figure 11. Chromatic aberration vector diagram of projector blue and green channels
图 12 投影仪红绿通道色差矢量图
Figure 12. Chromatic aberration vector diagram of projector red and green channels
图 13 投影仪色差校正前后台阶三维形貌。(a)校正前的台阶三维形貌;(b)校正后的台阶三维形貌
Figure 13. 3D topography of steps before and after chromatic aberration correction of projector. (a) 3D morphology of the step before correction; (b) 3D morphology of the step after correction
图 14 PRO4500投影仪色差校正前后台阶三维形貌。(a) 校正前的台阶三维图;(b) 校正后的台阶三维图
Figure 14. 3D topography of step before and after chromatic aberration correction of PRO4500 projector. (a) 3D morphology of the step before correction; (b) 3D morphology of the step after correction
表 1 拟合结果对比
Table 1. Comparison of fitting results
$ {\varphi }_{pro\_h\_g} $ R-square RMSE Complexity Poly11: 0.9998 1.3860 Simple Poly22: 1 0.5930 Moderate Poly33: 1 0.4819 Complex  下载: 导出CSV
表 2 校正投影仪色差前后台阶间距测量值(单位:mm)
Table 2. Measurement value of step spacing before and after correcting projector chromatic aberration (Unit: mm)
Projector model Step spacing Standard value Before correction After correction Pre-correction error Corrected error CP270 Step surface
2-313.258 13.732 13.308 0.474 0.050 Step surface
3-418.422 17.918 18.447 −0.504 0.025 PRO4500 Step surface
2-313.258 13.317 13.220 0.059 −0.038 Step surface
3-418.422 18.465 18.411 0.043 −0.011
下载: 导出CSV
-
[1] Dai M L, Yang F J, Liu C. A dual-frequency fringe projection three-dimensional shape measurement system using a DLP 3D projector [J]. Optics Communications, 2017, 382: 294-301. doi: 10.1016/j.optcom.2016.08.004 [2] Yang L X, Xie X, Zhu L Q, et al. Review of electronic speckle pattern interferometry (ESPI) for three-dimensional displacement measurement [J]. Chinese Journal of Mechanical, 2014, 27(1): 1-13. doi: 10.3901/CJME.2014.01.001 [3] 白雪飞, 张宗华. 基于彩色条纹投影术的三维形貌测量[J]. 仪器仪表学报, 2017, 38(8): 1912-1925. doi: 10.3969/j.issn.0254-3087.2017.08.009 Bai X F, Zhang Z H. 3D shape measurement based on colour fringe projection techniques [J]. Chinese Journal of Scientific Instrument, 2017, 38(8): 1912-1925. (in Chinese) doi: 10.3969/j.issn.0254-3087.2017.08.009 [4] Zuo C, Feng S, Huang L, et al. Phase shifting algorithms for fringe projection profilometry: A review [J]. Optics and Lasers in Engineering, 2018, 109: 23-59. doi: 10.1016/j.optlaseng.2018.04.019 [5] Huang J H, Xue Q, Wang Z, et al. Analysis and compensation for lateral chromatic aberration in a color coding structured light 3D measurement system [J]. Sensors, 2016, 16(9): 1426. doi: 10.3390/s16091426 [6] Mallon J, Whelan P F. Calibration and removal of lateral chromatic aberration in images [J]. Pattern Recognition Letters, 2007, 28: 125-135. doi: 10.1016/j.patrec.2006.06.013 [7] Korneliussen J T, Hirakawa K. Camera processing with chromatic aberration [J]. IEEE Transactions on Image Processing, 2014, 23(10): 4539-4552. doi: 10.1109/TIP.2014.2350911 [8] Pagès J, Collewetb C, Forest J, et al. Optimised De Bruijn patterns for one-shot shape acquisition [J]. Image and Vision Computing, 2005, 23(8): 707-712. doi: 10.1016/j.imavis.2005.05.007 [9] Li W G, Duan S J. Color calibration and correction applying linear interpolation technique for color fringe projection system [J]. Optik, 2016, 127(4): 2074-2082. doi: 10.1016/j.ijleo.2015.11.093 [10] Sun P P, Xue Q, Ji W, et al. Analysis and compensation of lateral chromatic aberration of structured light 3D measurement system [J]. Optics Communications, 2021, 488(25): 126871. [11] Zhang Z H, Towers C, Towers D. Compensating lateral chromatic aberration of a color fringe projection system for shape metrology [J]. Optics and Lasers in Engineering, 2010, 48(2): 159-165. doi: 10.1016/j.optlaseng.2009.04.010 [12] Li Z, Shi Y, Wang C, et al. Accurate calibration method for a structured light system [J]. Optical Engineering, 2008, 47(5): 525-534. [13] Li B W, Song Z. Structured light system calibration method with optimal fringe angle [J]. Applied Optics, 2014, 53(33): 7942-7950. doi: 10.1364/AO.53.007942 [14] Huang S, Xie L, Wang Z, et al. Accurate projector calibration method by using an optical coaxial camera [J]. Applied Optics, 2015, 54(4): 789-795. doi: 10.1364/AO.54.000789 [15] Xue Q, Wang Z, Huang J, et al. A two-level space-time color-coding method for 3D measurements using structured light [J]. Measurement Science and Technology, 2015, 26(11): 115204. doi: 10.1088/0957-0233/26/11/115204 [16] Zhang X, Zhu L. Projector calibration from the camera image point of view [J]. Optical Engineering, 2009, 48(11): 117208. doi: 10.1117/1.3265551 -

 点击查看大图

计量
- 文章访问数: 124
- HTML全文浏览量: 32
- PDF下载量: 32
- 被引次数: 0

