


-
近年来,科技发展迅猛,有机溶剂在有机合成、生物医学等领域得到广泛应用。然而,这也带来了对有机溶剂质量的高要求。在许多特殊化学反应和工业生产过程中,水被视为最常见的杂质之一。即使是微小的水含量,也可能直接导致化学反应失败,造成无法挽回的损失。因此,对有机溶剂中水含量的高灵敏度快速检测变得至关重要。文中介绍的光纤传感器通过基于金属-氧化物-金属(Metal Insulator Metal, MIM)结构的设计,利用双层金属之间光场的强烈局部化效应,以提高传感器的灵敏度。
光纤传感器可以通过改变空气孔布置和使用不同的涂层材料厚度来优化结构,从而增强模式的激发和耦合效应,这样可以大幅提高传感器在检测有机溶剂中痕量水时的性能。通过光纤传感器的应用,可以实现对有机溶剂中水含量的高灵敏度检测,有助于确保特殊化学反应和工业生产过程的质量和效率。
目前,用于测定样品中水分含量的分析技术主要包括色谱-质谱、滴定分析和蒸馏法等[1-2]。然而,这些方法存在一些缺点,如技术要求高、实时监测能力不足、成本昂贵且耗时较长[3]。在传统方法中,卡尔·费歇尔法是常用的测定有机溶剂中水分含量的方法[4-5],它具有良好的选择性和准确性,因此,它已成为基于容量滴定法和库仑法原理测定水含量的最常用分析技术[6-7]。然而,这种方法需要熟练的操作员和专业设备才能准确检测水分含量[8],且需要使用昂贵且有毒的化学试剂,限制了其在水分测定中的实际应用。
相比之下,光学设备是更适用于生物和化学环境中水分含量检测的方法。光学设备可以实现远程和现场监测,具有快速响应速度和高灵敏度[9],因此在分析化学、光化学和光物理等领域得到广泛应用[10-11]。然而,到目前为止,对于有机溶剂中痕量水分的检测,其准确度只能达到10−6量级,这在工业生产中是不够的。
针对以上问题,有人提出了使用丝蛋白作为指示剂来检测痕量水的方法。丝蛋白是一种高分子,而且丝蛋白薄膜在整个可见光范围内具有90%的透光率,具有突出的表面平整度,这十分符合光子学和光学的创新材料的要求[12-13]。由于具有较高的半透明度和均匀的纤维横截面积,丝蛋白的光泽度也非常好。此外,丝蛋白具有较高的折射率(约1.54),不需要蚀刻深层微结构来实现所需的相移调制。通过改变涂覆率,可以调节丝蛋白膜的光学性能,使丝蛋白适合作为湿度指示剂[14-15]。因为丝蛋白可以很容易地改变二级结构,以快速响应外部条件的变化[16],因此,当光场具有强局域化时,可以进行高灵敏度的反应。此外,根据原理分析,已知了固定厚度金属银的渗透率参数。然后,用达西定律计算出丝素蛋白的吸水率,然后得到有机溶剂中的含水量。因此,采用丝蛋白和双层银构成的MIM结构痕量水传感器可以克服以上提到的缺点,它具有高灵敏度、良好的生物相容性和成本效益[17]。
丝蛋白因其具有优良的特性,适用于制备先进的光学传感元件[18]。Arif S等人使用银-丝蛋白-银的三层结构痕量水传感器来测量有机溶剂中的水含量。该传感器利用液体分子可以渗透进入沉积的银纳米膜中的纳米孔,当水分子被丝蛋白吸收时,丝蛋白层会膨胀,导致共振波长发生显著偏移,其检测限低至0.008%[19]。这种传感器技术具有潜力,在工业生产过程中能够提高对有机溶剂中水分含量的检测精度,从而满足越来越严格的质量要求。
-
该节首先介绍了所设计传感器的材料以及结构参数,其中,D型光纤横截面上依次涂敷银、丝蛋白以及下部带有光栅的银膜,传感器内部的大空气孔有利于光纤的拉制[20-21],在上层银膜上增加光栅,有利于实现SPR的增强[22]。接着从实际制作的角度分析了光纤传感器实现的可能性,中间的大空气孔采用溶胶-凝胶工艺制备,银光栅采用光刻工艺和双束干涉光刻技术结合制造,这些技术已经十分成熟。
-
光子晶体光纤(Photonic Crystal Fiber, PCF)由于其灵活的结构设计[23-24],广泛应用在传感领域。图1描绘的是柚子型PCF的横截面,其背景材料是二氧化硅,光纤的半径R选定为6 μm,在光纤剖面上依次涂覆金属银、丝蛋白、金属银,它们的厚度分别为A1、A和A2。相关水渗透参数可以通过达西定律来得出:
$$ F=\frac{K}{\eta} \times \frac{\Delta P}{\Delta L} {~A}=\frac{K}{\eta} \times \frac{1}{\Delta L} \times \frac{m g}{A} \times {A}=\frac{K}{\eta} \frac{\rho V g}{\Delta L}$$ (1) 式中:K表示银纳米膜的渗透性;P表示膜上的压差,它取决于每横截面积(A)1 mol水的重力(mg);L表示纳米膜的厚度;η表示1 mol水的粘度值。水的质量(m)通过密度(ρ)乘以水的体积和重力加速度(g)获得,F则可以通过丝蛋白的膨胀体积除以扩散时间来测量。

图 1 柚子型光纤截面图
Figure 1. Cross-section of grapefruit type optical fiber
为了便于后续计算,选择银纳米膜厚度A2为固定值(30 nm),后续将对下层银膜厚度A1进行优化。光纤内部有三个大空气孔,相邻两个空气孔之间的中心夹角为60°,空气孔高度用参数d表示,在后续研究中,将对d的大小进行优化。
上层金属银下部刻有一定数量的银光栅。图1中蓝色圈中部分放大图如右上角所示,在顶层金属银膜靠近光纤纤芯的部分添加了一定数量具有周期性的银光栅,其高度为h1,间距为d1,宽度d2固定为20 nm,在后续研究中将分别对银光栅的高度h1、间距d1以及数量n进行优化。
-
光纤对于柚子型光纤的中间大空气孔,可采用溶胶-凝胶工艺制备[25-26],该方法已被证明是一种适用于制造各种光子器件的技术[27]。在这种柚子型光纤的制备过程中,溶胶-凝胶法用于制备叠层中的二氧化硅管和硅棒之间形成键的粘接,并用于填充这些部件之间的间隙,从而可以控制叠层孔内的压力。形成的干凝胶在高达1000 ℃的温度下进行热处理,柚子型光纤是在约1 900 ℃的温度下将叠层拉伸制作而成的。
银光栅结合光刻工艺和双光束干涉光刻技术制造[28-29],制备工艺步骤如下:第一步清洁玻璃衬底。使用丙酮和乙醇棉球反复擦拭玻璃衬底,再依次放入丙酮、乙醇和去离子水中进行超声清洗,用氮气吹干,再放入热烘箱烘干取出,待冷却后使用。第二步是制备光刻胶薄膜。采用旋涂的方式,在清洁后的玻璃衬底表面制备厚度约为200 nm的光刻胶薄膜,再将光刻胶玻璃衬底置于95 ℃的热烘台上坚膜、冷却。第三步是紫外光刻与激光双光束干涉连续曝光。将坚膜后的光刻胶玻璃衬底置于光刻机载物台上,并与掩模板对准,进行第一次曝光。将光刻胶玻璃衬底置于激光双光束干涉光路中的光屏上,进行第二次曝光。最后一步是显影,将曝光后的光刻胶玻璃衬底放入专用显影液中显影,以去除未聚合的光刻胶,显影后再用氮气吹干,即得到不同形貌不同周期的复合微纳米结构。
-
文中利用全矢量有限元的方法,探索了光纤结构参数对传感器性能的影响。其中,优化的主要结构参数有丝蛋白层厚度、空气孔高度、银光栅的高度、数量、间距以及下层银厚度,通过分析损耗光谱特性得到了最佳传感结构。计算结果表明,利用最佳光纤结构可对有机物中痕量水进行高灵敏度检测。
-
第一步先确定丝蛋白的厚度范围,即干燥和吸水膨胀状态下的厚度,将中间丝蛋白层的厚度分别设定为40 nm、60 nm、90 nm以及100 nm,光纤空气孔高度设置为固定值4.55 μm,下层银膜厚度为25 nm,银光栅的高度为5 nm,数量设置为28,间距为20 nm,得到的传感器损耗情况如图2所示。

图 2 不同丝蛋白厚度的损耗峰值曲线
Figure 2. Loss peak curves of different silk protein thicknesses
为了更加准确地评估丝蛋白厚度对传感器性能的影响,根据图2曲线中的信息,提取出了不同丝蛋白厚度下传感器的共振波长、损耗峰峰值以及半高全宽(Full Width at Half Maximum, FWHM)的数值,结果如表1所示,从表中可以看出:随着丝蛋白层厚度的增加,传感器的共振波长明显红移,损耗峰的峰值也不断增加,而FWHM则显著减小,这些参数的变化都在合理范围内。基于以上结果,在设计痕量水传感器时选择了40~100 nm之间的丝蛋白厚度范围,在后续的结构优化过程中,选取60 nm和90 nm厚度的丝蛋白作为标准。
表 1 不同丝蛋白厚度的传感器参数比较
Table 1. Comparison of sensor parameters of different silk protein thicknesses
Thickness of
silk protein/nmResonance
wavelength/nmPeak value of
loss/dB·m−1FWHM/
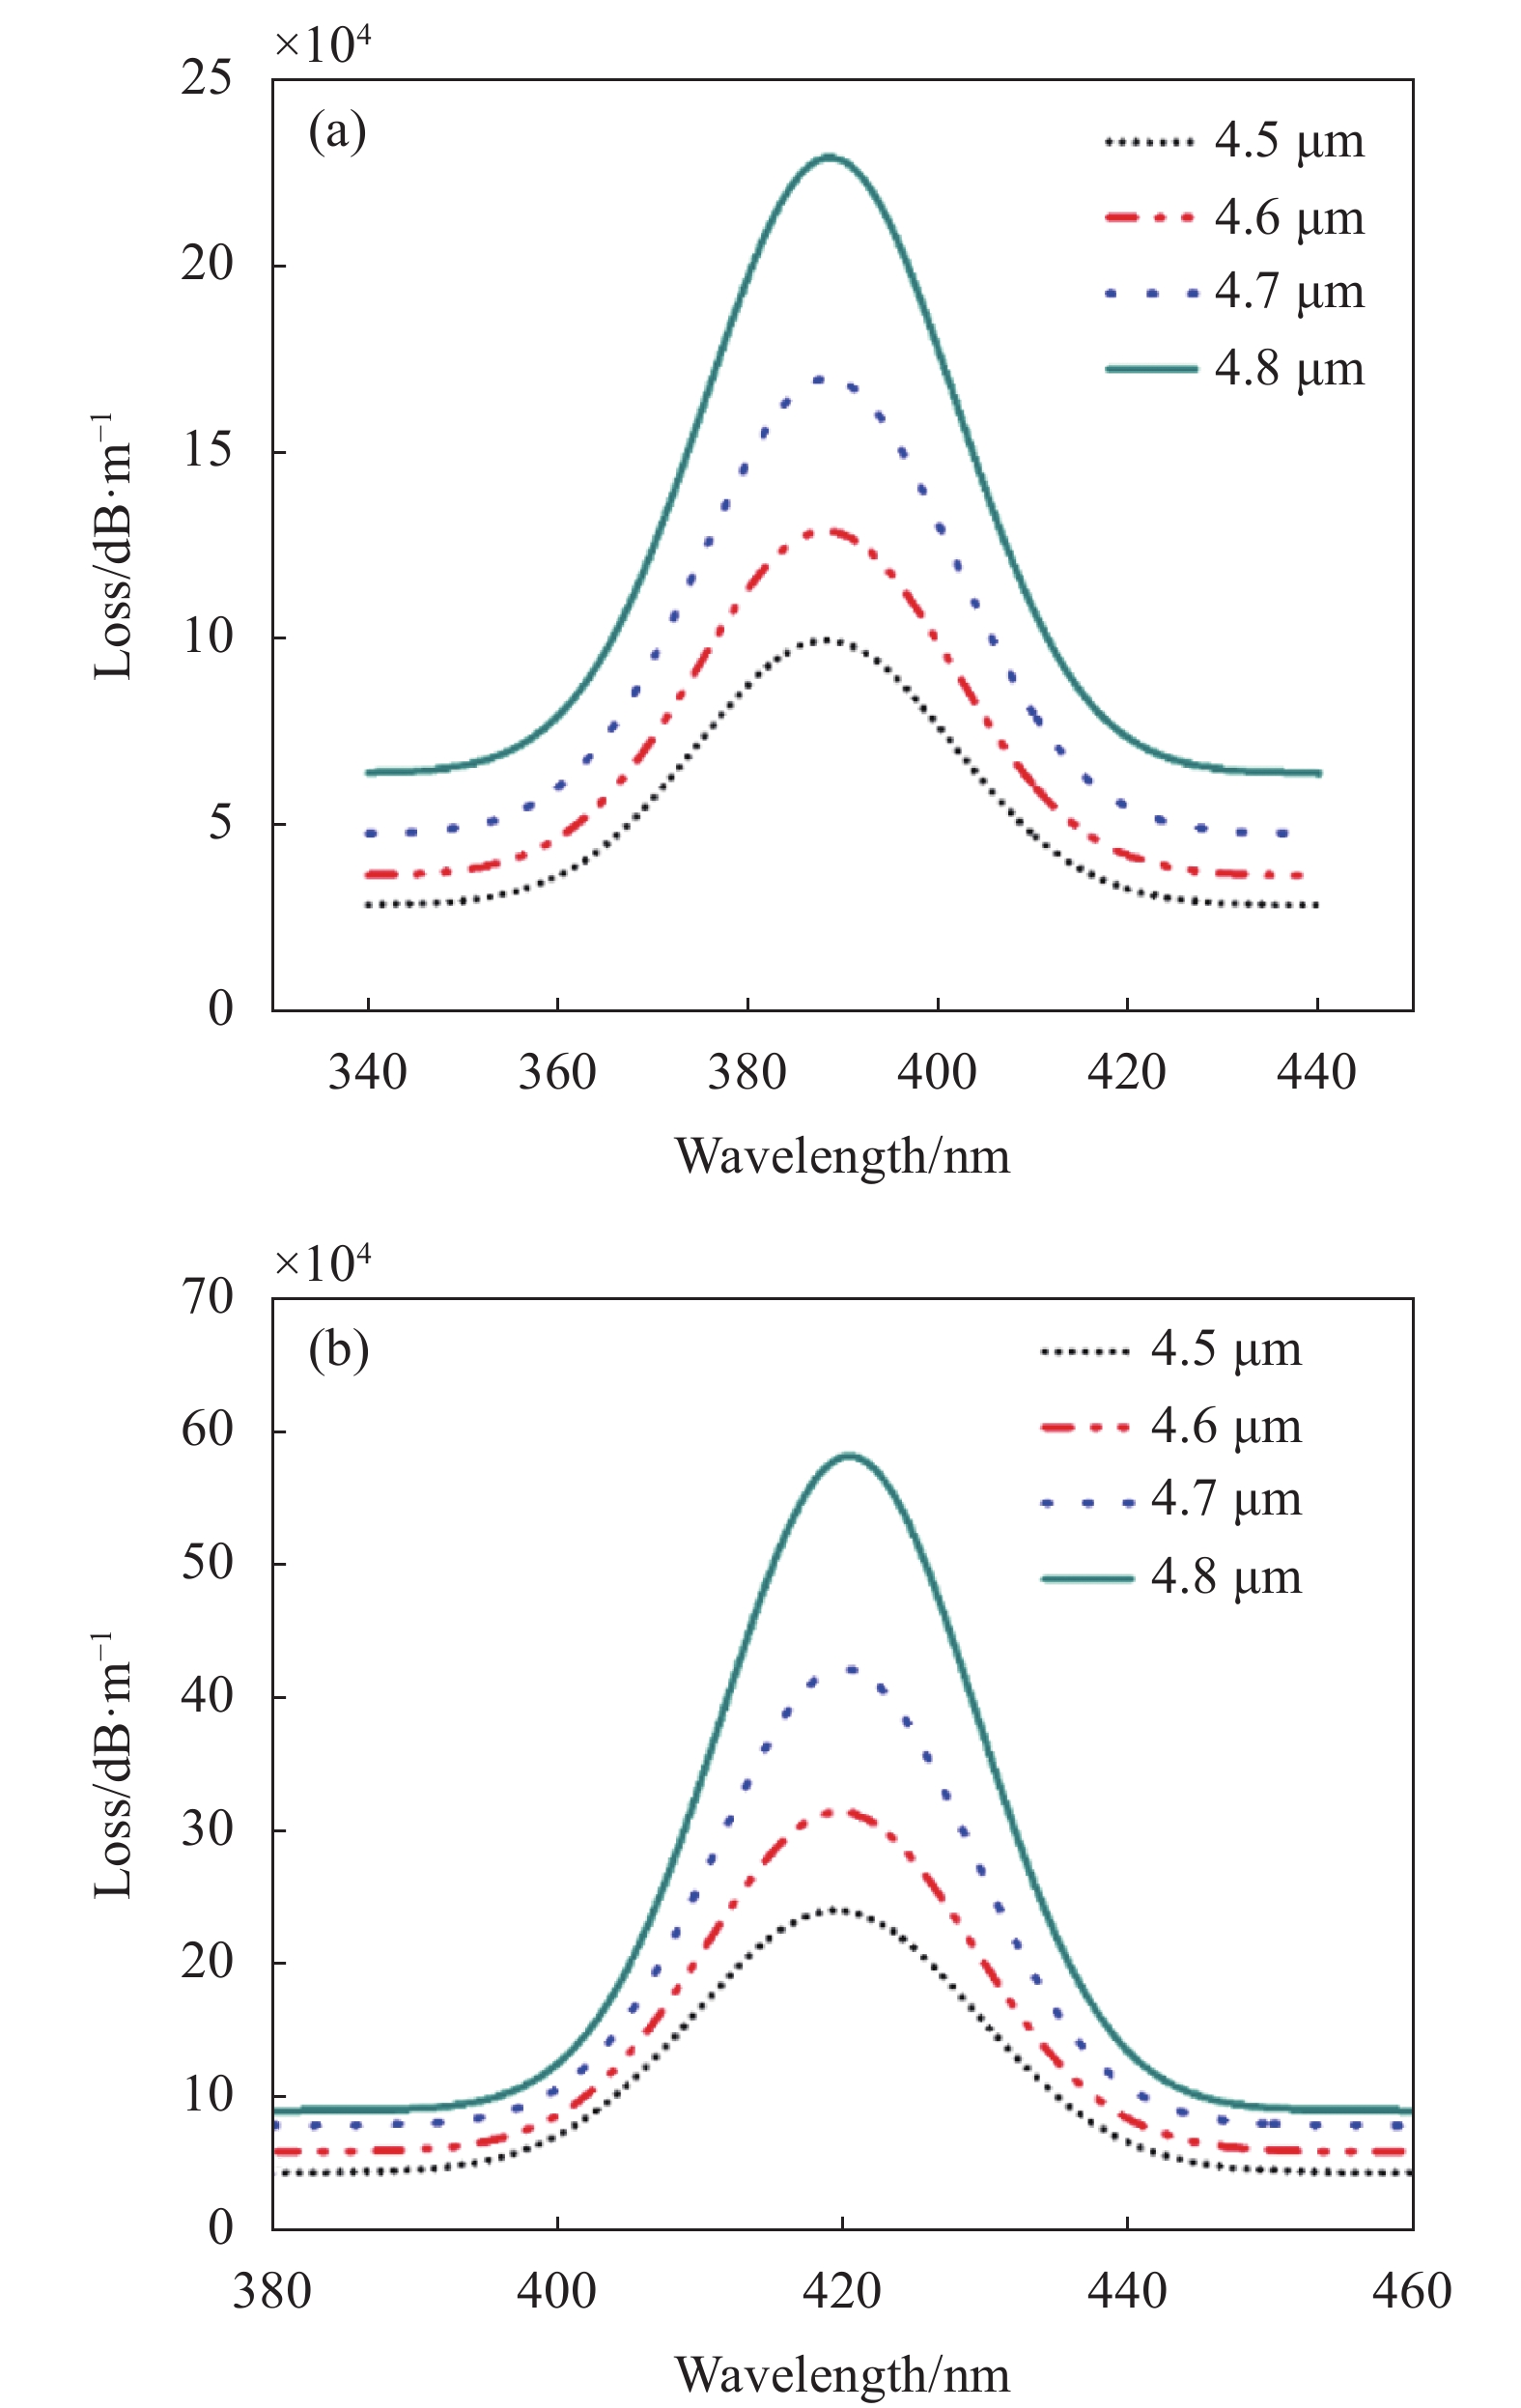
nm40 371 60216 68.4 60 388 114040 40.5 90 419 280430 27.6 100 430 361840 24.6 在下面的优化过程中,始终将丝蛋白层的厚度为60 nm和90 nm的作为一个对照组。先讨论空气孔的最佳高度。分别把丝蛋白层厚度设置为60 nm和90 nm,把空气孔的高度参数d分别调整为4.8 μm、4.7 μm、4.6 μm和4.5 μm,得到损耗曲线如图3所示。

图 3 丝蛋白的厚度为 (a) 60 nm;(b) 90 nm时,损耗峰随空气孔高度的变化曲线
Figure 3. When the thickness of silk protein is (a) 60 nm, (b) 90 nm, the loss peak varying curves with the height of air cores
通过分析对比图3中的两组曲线,可以发现不管丝蛋白层的厚度是60 nm还是90 nm,随着空气孔高度的减小,损耗峰值均显著降低。这可能是因为随着空气孔高度的减小,光纤纤芯的尺寸变大,纤芯约束光的能力增强,能量被不断限制在纤芯中,因此纤芯损耗减小。通过对比丝蛋白吸水膨胀前后的损耗峰值,发现吸水之后传感器的损耗显著增加。由此可见,在光纤空气孔高度为4.5 μm时,损耗峰差值最小。另外,四个尺寸的共振波长偏移量差别不大,都围绕在31 nm左右,最大和最小偏移量仅仅相差0.5 nm。从FWHM的角度分析,虽然空气孔的高度为4.5 μm时,损耗曲线的FWHM略大,但是其损耗峰差值最小并且优势明显,选定光纤空气孔高度d为4.5 μm最为合适。
-
该节讨论银光栅的最优高度,将中间层丝蛋白的初始厚度分别设定为60 nm和90 nm,光纤空气孔的高度参数d设置为4.5 μm,把银光栅的高度分别设置为7 nm、8 nm、9 nm以及10 nm,其他的参数均保持不变。传感器的损耗情况如图4所示。

图 4 丝蛋白的厚度为 (a) 60 nm、(b) 90 nm时,损耗峰随银光栅高度的变化曲线
Figure 4. When the thickness of silk protein is (a) 60 nm, (b) 90 nm, the loss peak changing curves with the height of silver grating
为了更准确地评估丝蛋白厚度对传感器性能的影响,根据图4曲线中的信息,提取出了不同银光栅高度下传感器的共振波长、损耗峰峰值以及FWHM的数值,结果如表2所示。可以看出:当丝蛋白的厚度为60 nm时,通过表2实验的损耗峰值明显减小,并且FWHM显著增大,因此银光栅存在的情况下传感性能更加优异。由于丝蛋白厚度为60 nm时没有加银光栅与加银光栅时的对照实验已经很明显,因此当丝蛋白的厚度为90 nm时,不再做有无银光栅的对照实验。从表2可以看出,FWHM数值随着银光栅高度的增加而逐渐增加,共振波长发生了明显红移,损耗峰的峰值也逐渐减小。造成以上传感器参数出现差异的原因可能是由于银光栅高度的不断增加,相当于竖直方向上腔体长度的增加,导致对应的共振波长频率波矢量随之减小。另外,大部分的入射光被局限在狭缝腔体的内部,进而导致了损耗峰值不断增大。
表 2 丝蛋白的厚度为60 nm和90 nm时,不同银光栅高度下的传感器参数比较
Table 2. When the thickness of silk protein is 60 nm and 90 nm, comparison of sensor parameters under different silver grating heights
h1/nm Resonance
wavelength/nmPeak value of
loss/dB·m−1FWHM/nm 60 nm 90 nm 60 nm 90 nm 60 nm 90 nm 0 383.3 - 87217 - 45.8 - 7 390.2 422.5 106380 243900 41.3 29.8 8 391.5 423.9 109490 242560 41.4 31.2 9 392.6 425.5 112770 236010 41.6 38.3 10 394 428.1 116330 233190 41.6 39.7 通过对比图4中的两组曲线以及表2的数据,发现丝蛋白吸水膨胀以后损耗峰值显著增加,扩大了将近2倍。与此同时,在银光栅高度为10 nm时,损耗峰差值最小,并且吸水前后的波长偏移量最大,虽然其FWHM略大,但综合考虑还是选择银光栅高度为10 nm。
基于以上讨论,选定了空气孔的高度d为4.5 μm,银光栅的高度为10 nm,后续将就银光栅数量展开讨论,进一步研究中间丝蛋白层吸水前后损耗曲线的变化情况。丝蛋白厚度依然在60 nm和90 nm中选择。当丝蛋白厚度为60 nm时,将银光栅数量从28~58均匀取值,测得传感器的损耗情况如图5所示。

图 5 丝蛋白的厚度为 (a) 60 nm、(c) 90 nm时,损耗峰随银光栅数量的变化曲线;(b) 图5(a) 峰值处的局部放大图
Figure 5. When the thickness of silk protein is (a) 60 nm, (c) 90 nm, the loss peak changing curves with the number of the silver gratings; (b) Local magnification at the peak of Fig.5(a)
分析图5中中间丝蛋白层的厚度为60 nm时的四条损耗峰随银光栅数量的变化曲线,可以发现:随着银光栅数量的不断增加,传感器的损耗峰峰值也在逐渐增加,银光栅的数量越多,损耗峰的峰值越大,传感器的共振波长也发生了红移,但是偏移情况并不明显,可是FWHM的数值却有所下降,不过下降的数值并不明显,具体数值都列在了表3中。为了使测得的结果更加直观,将图5(a)中损耗峰峰值处的局部图像进行了放大,放大情况如图5(b)所示,从图5(b)可以清楚地看到:四条曲线之间的最大波长偏移量约为1.9 nm,损耗峰峰值之间的最大差值约为13320 dB/m。当丝蛋白厚度为90 nm时,能够发现:随着银光栅数量的不断增加,损耗曲线向长波长方向移动,损耗峰峰值增加,曲线的FWHM略有增加,但是波动不大。
表 3 丝蛋白的厚度为60 nm和90 nm时,不同银光栅数量下的传感器参数比较
Table 3. When the thickness of silk protein is 60 nm and 90 nm, comparison of sensor parameters under different amount of silver grating
n Resonance
wavelength/nmPeak value of
loss/dB·m−1FWHM/
nm60 nm 90 nm 60 nm 90 nm 60 nm 90 nm 28 394.0 428.1 116330 233190 41.6 39.7 38 394.9 431 124200 243630 40.1 40 48 395.6 432.4 127910 247600 39.4 40.2 58 395.9 433.3 129650 247660 39.1 40.4 通过对比图5中的曲线以及表3中丝蛋白吸水前后的损耗曲线变化情况,可以发现:丝蛋白厚度为90 nm时,传感器的损耗显著增加,四组曲线对应的峰值差以及共振波长红移量变化并不大。另外,当银光栅数量为58且丝蛋白厚度为60 nm时,损耗曲线的FWHM最小,因此综合损耗峰值差、共振波长偏移量以及FWHM,选择银光栅数量为58最为合适。
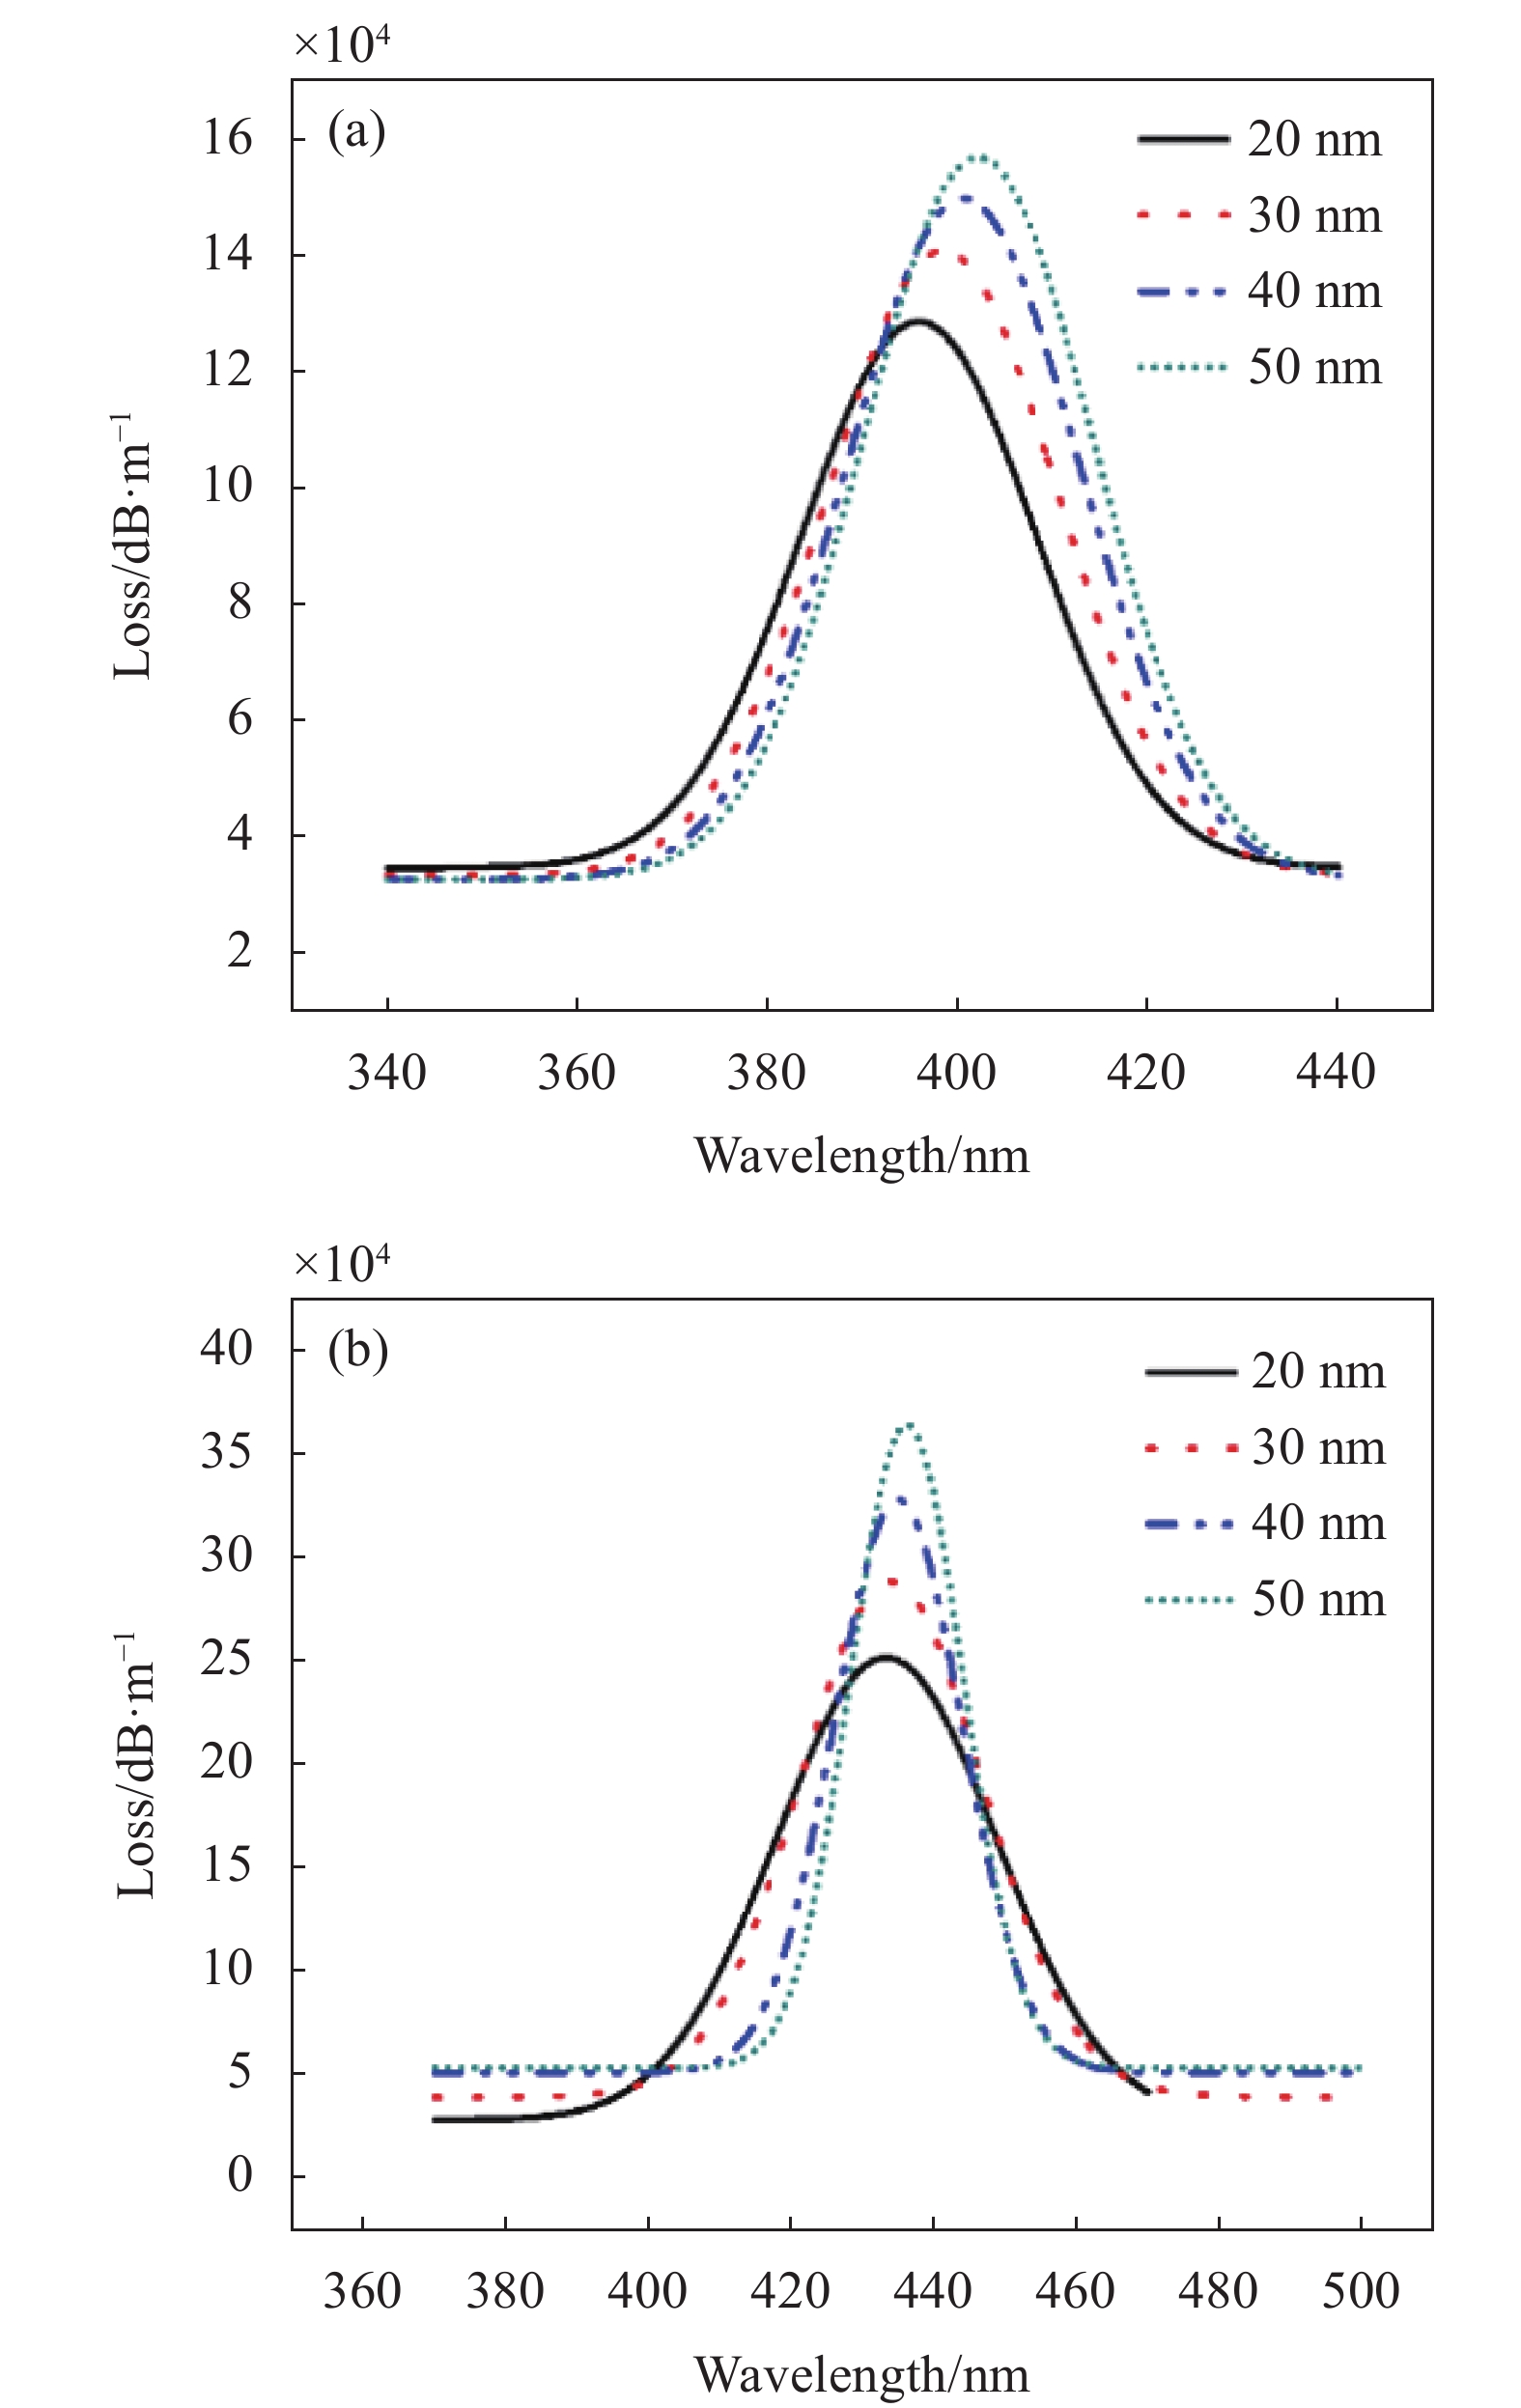
通过以上讨论,选定光纤空气孔的高度为4.5 μm,银光栅高度为10 nm,银光栅数量为58,下面优化银光栅的间距,讨论范围在20~50 nm,丝蛋白传感器吸水前后的损耗情况分别如图6所示。

图 6 丝蛋白的厚度为 (a) 60 nm、(b) 90 nm时,损耗峰随银光栅间距的变化曲线
Figure 6. When the thickness of silk protein is (a) 60 nm, (b) 90 nm, the loss peak variesying curves with the spacing of the silver gratings
分析图6(a)中中间丝蛋白层的厚度为60 nm时的四条损耗峰随银光栅间距的变化曲线,可以发现:随着银光栅间距的不断增加,传感器的损耗峰峰值也在逐渐增加,银光栅的间距越大,损耗峰的峰值越大,传感器的共振波长也发生了红移,FWHM的数值却有所下降。具体数值如表4所示。由此可见,随着银光栅间距的增加,损耗曲线发生较为明显的红移,同时峰值逐渐增大,曲线的FWHM数值也明显减小。以上现象出现的原因主要是由于银光栅宽度的增加,导致它们之间的局域SPR强度降低,反射率逐渐减小,因此损耗增大。当丝蛋白厚度为90 nm时,由表4中的数据能够发现:随着银光栅间距的不断增加,损耗曲线出现了红移现象,并且损耗曲线的峰值显著增加,FWHM明显减小。
表 4 丝蛋白的厚度为60 nm和90 nm时,不同银光栅间距下的传感器参数比较
Table 4. When the thickness of silk protein is 60 nm and 90 nm, comparison of sensor parameters under different silver grating spacing
d1/nm Resonance
wavelength/nmPeak value of
loss/dB·m−1FWHM/
nm60 nm 90 nm 60 nm 90 nm 60 nm 90 nm 20 395.9 429 129650 247660 39.1 40.4 30 398.4 432 142730 300300 36.2 29.7 40 400.6 434 151790 343760 35.5 24.1 50 402.1 436.2 159180 382740 34.6 21.9 对比丝蛋白吸水前后的损耗曲线变化情况可以发现:厚度为90 nm时,传感器的损耗显著增加,四组曲线对应的峰值差分别为118010 dB/m、157570 dB/m、191970 dB/m以及223560 dB/m,共振波长红移量分别为33.1 nm、33.6 nm、33.4 nm以及34.1 nm。由此可见,增加银光栅的间距,吸水前后损耗峰值差逐渐增大,共振波长红移量整体波动不大,在间距为50 nm时略有优势,但是FWHM相较于间距为20 nm时显著减小,尤其是丝蛋白厚度为90 nm时,FWHM缩小了近一半,可见增大银光栅的间距可以有效改善损耗曲线的FWHM。综合以上几点因素,选择银光栅间距为50 nm最为合适。
-
通过对以上光纤结构参数的优化,最终选定了光纤的空气孔高度为4.5 μm,银光栅的高度为10 nm,数量为58个,间距为50 nm,下面优化下层金属银膜的厚度,使用已经确定好的最优参数,将下层银膜厚度分别调整为25 nm、27 nm、29 nm以及31 nm,并得到了中间丝蛋白层吸水前后的损耗值,如表5所示。
表 5 丝蛋白的厚度为60 nm和90 nm时,不同下层银膜厚度的传感器参数比较
Table 5. When the thickness of silk protein is 60 nm and 90 nm, comparison of sensor parameters of different underlayer silver film thicknesses
A1/nm Resonance
wavelength/nmPeak value of
loss/dB·m−1FWHM/
nm60 nm 90 nm 60 nm 90 nm 60 nm 90 nm 25 402.1 436.2 159180 382740 34.7 21.9 27 404.5 439.2 141000 316640 35 23.4 29 406.9 442.3 124240 263810 35.2 25.3 31 408.4 444.9 109270 221340 35.8 26.5 分析表5可以得出以下结论:随着下层银膜厚度的不断增加,传感器的损耗峰峰值在逐渐减少,银光栅的间距越大,损耗峰的峰值越小,与此同时,传感器的共振波长也发生了红移,但是红移效果并不是很明显。FWHM的数值有所上升,但是数值整体波动情况不大。当丝蛋白厚度为90 nm时,由表5数据可以发现:随着下层银膜厚度的不断增加,传感器的损耗曲线出现了明显的红移现象,并且损耗曲线的峰值显著减小,FWHM有了大幅度的增加。
通过对比丝蛋白吸水前后的损耗曲线变化情况,可以发现:厚度为90 nm时,传感器的损耗显著增加,四组曲线对应的峰值差为223560 dB/m、175640 dB/m、139570 dB/m以及112070 dB/m,共振波长红移量分别为34.1 nm、34.7 nm、35.4 nm以及36.5 nm。由此可见:随着下层银厚度的增加,吸水前后损耗峰值差逐渐减小,共振波长红移量逐渐增大,虽然FWHM有所增加。综合以上因素,选定下层银厚度为31 nm较为合适。
-
通过以上优化,传感器的最佳结构参数如下:光纤空气孔高度为4.5 μm,银光栅高度为10 nm,数量为58,间距为50 nm,下层银膜的厚度为31 nm,当中间丝蛋白吸收有机溶剂中的不同容量的水而膨胀时,分析传感器损耗峰的变化。
从图7可以看出,当传感器的丝蛋白吸水膨胀,厚度分别为40 nm、50 nm、60 nm、70 nm、80 nm、90 nm和100 nm时,七条损耗曲线相应的损耗峰值分别为60506 dB/m、81616 dB/m、109270 dB/m、144410 dB/m、184120 dB/m、221340 dB/m和235770 dB /m。共振波长分别为385.9 nm、396.9 nm、408.4 nm、420.3 nm、432.6 nm、444.9 nm和456.9 nm。随着丝蛋白厚度的增加,共振峰值逐渐增加,并出现了非常明显的红移。可以看出,基于银-丝蛋白-银结构的柚子型光纤传感器可以很好地应用于痕量水的检测。
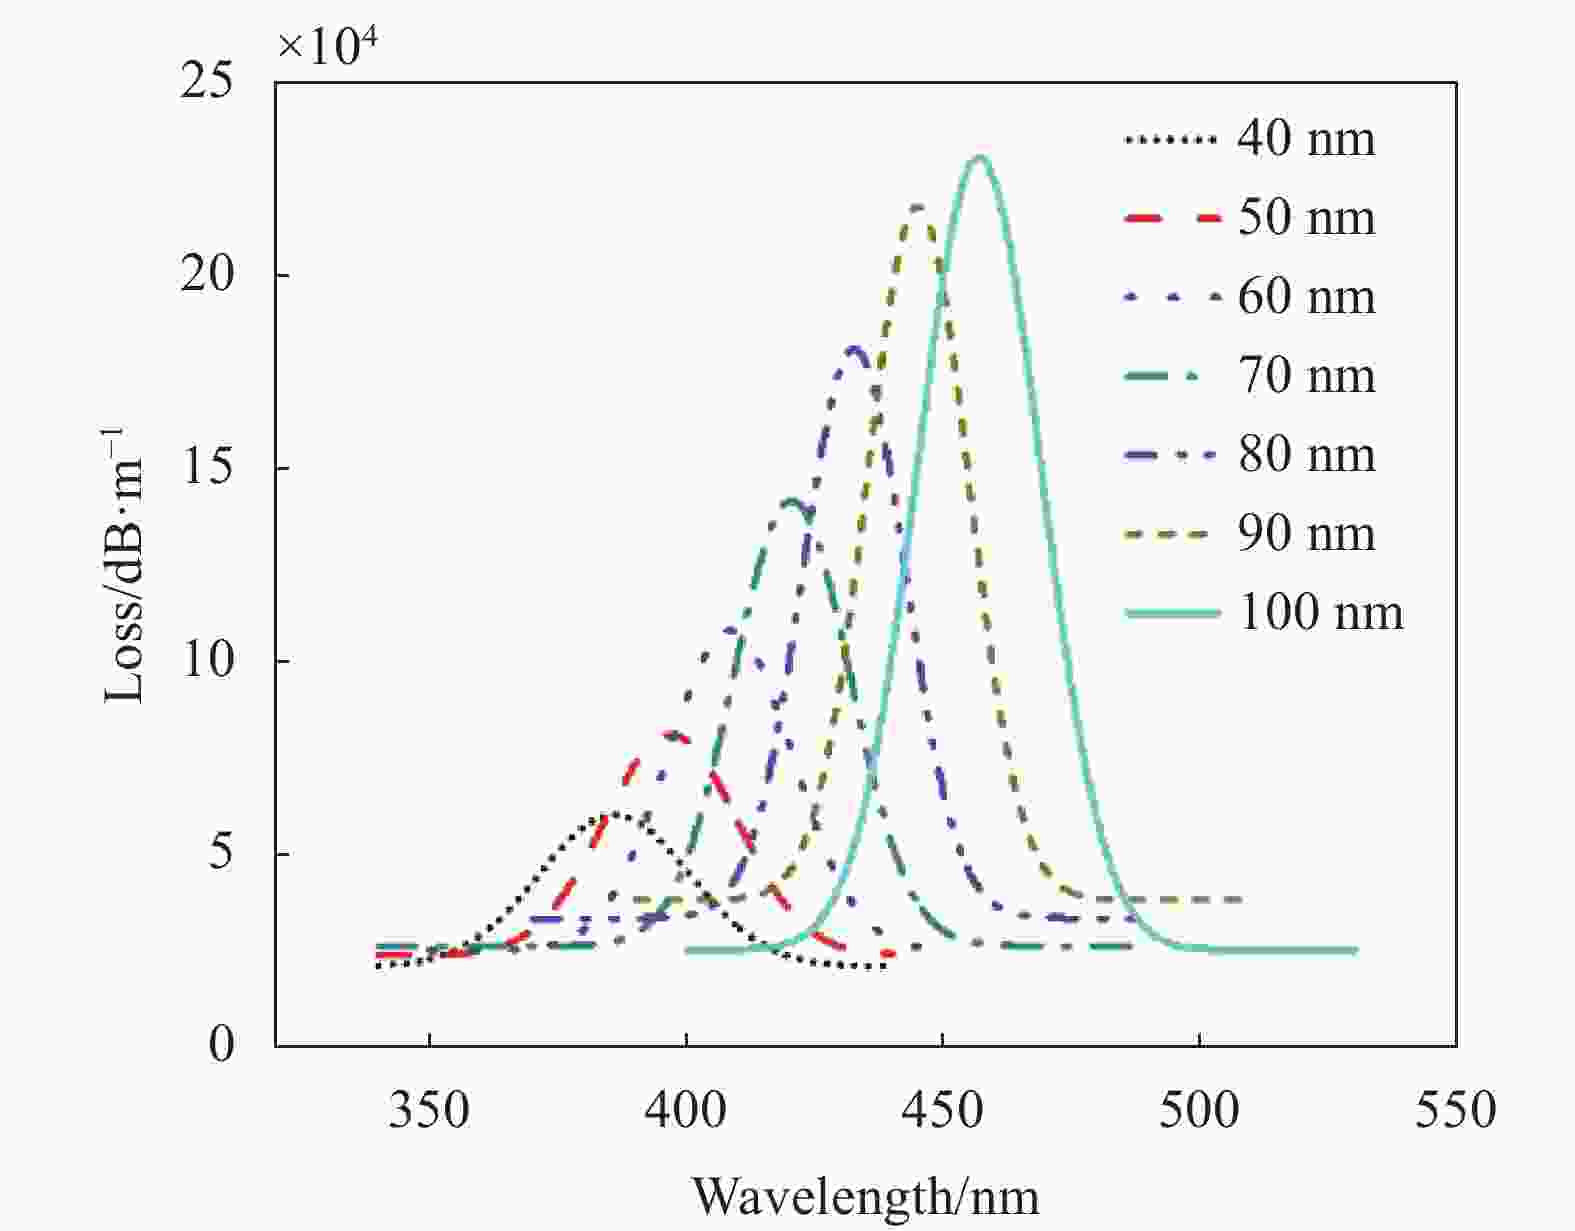
图 7 最佳结构传感器损耗图
Figure 7. Optimal structural loss diagram
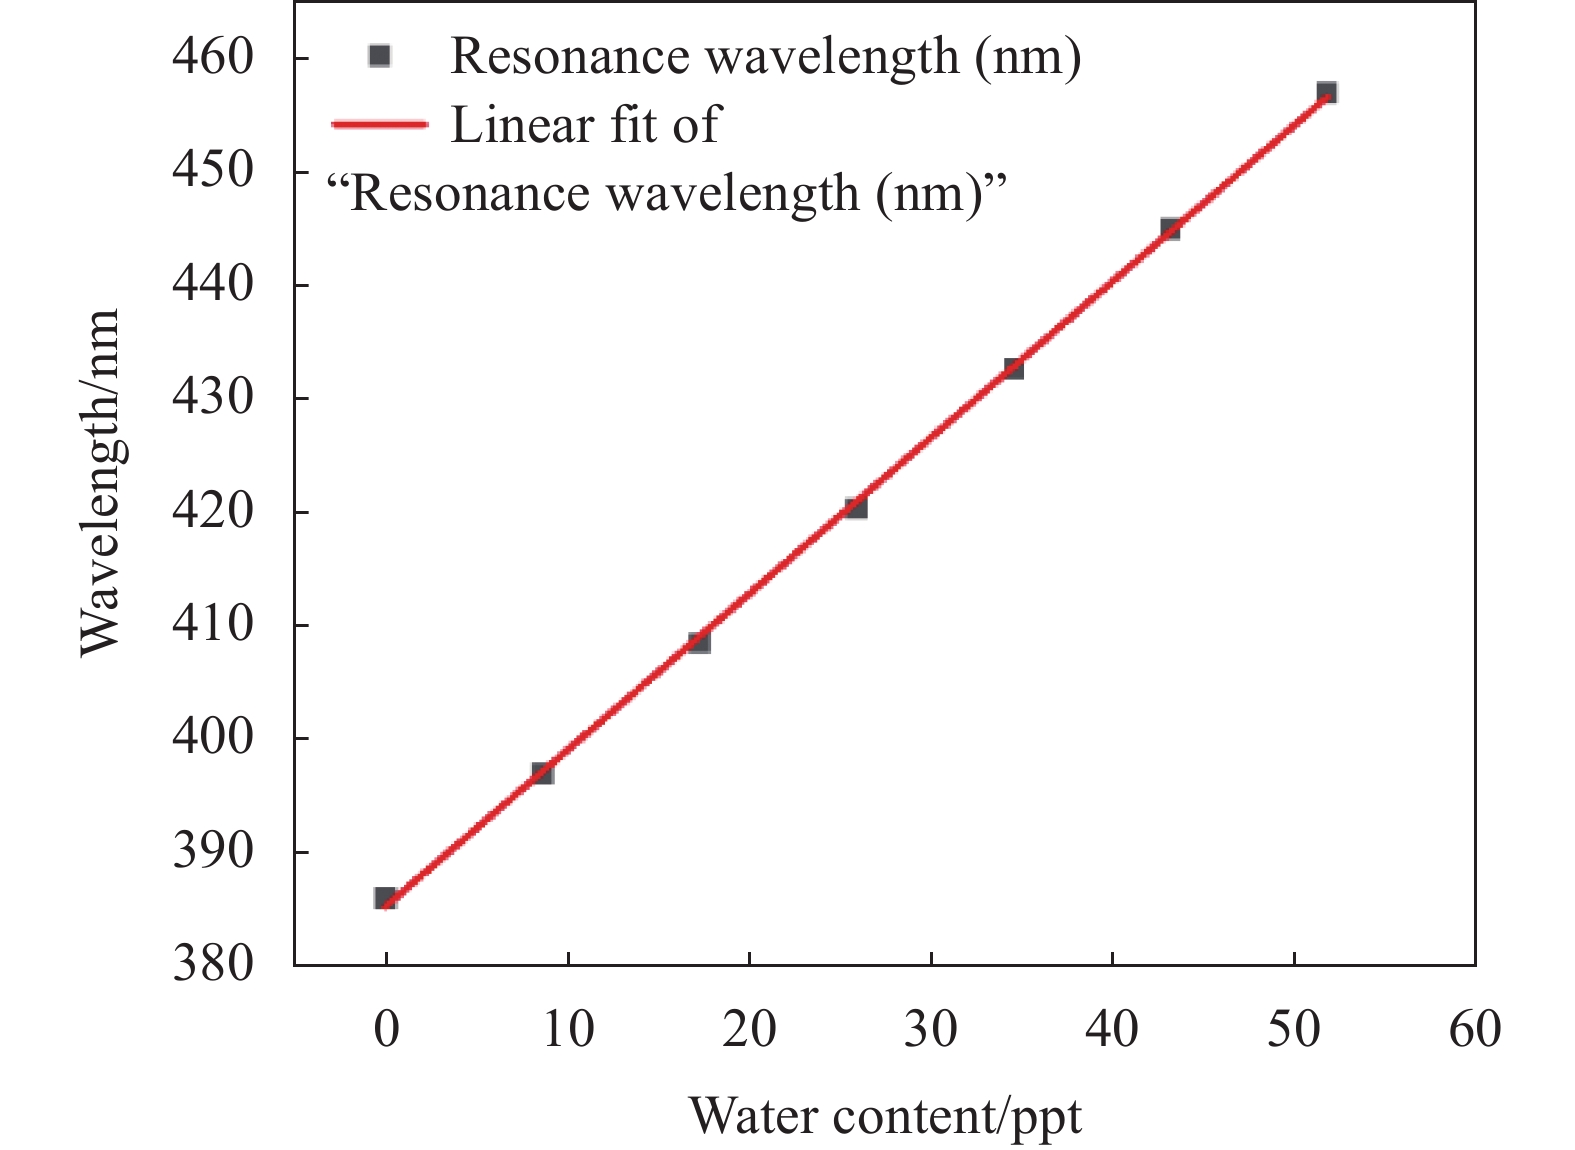
在有机物痕量水的实际检测过程中,将半径为100 μm的不同含水量的有机溶剂小心地放置在最佳参数的柚子型光纤传感器截面结构处并使其被吸收。当丝蛋白从40 nm的初始高度扩展到100 nm时,根据达西定律的公式,对应不同的膨胀厚度分别求出了丝蛋白的吸水量,进而可以计算出有机溶剂中的水份含量。文中所设计的痕量水光纤传感器共振波长随含水量的变化情况如图8所示,直线斜率即表示所设计的基于银-丝蛋白-银的MIM结构痕量水传感器灵敏度,高达1.39 nm/ppt (1 ppt=10−12),与同类型的痕量水传感器相比具有较大的优势。另外,拟合线段的R2大于0.999,拟合度较高。由此可以说明所设计的痕量水检测传感器共振波长与水分含量之间存在着非常良好的线性关系。

图 8 共振波长随含水量的变化
Figure 8. Variation of resonance wavelength with water content
为验证设计的结构在检测痕量水方面的优越性,与其他结构或方法的痕量水检测设备在灵敏度或检测极限方面的性能做了对比,结果如表6所示。表6列出了由金属框架、离子配合物和其他材料制成的痕量水传感器,由此表可知,所列的传感器检测灵敏度最高为0.10 nm/ppb(1 ppb=10−9)。文中设计的传感器的灵敏度为1.39 nm/ppt,检测性能远远优于现有文献的结果。因此,基于银-丝蛋白的传感器可用于检测有机物中的痕量水,并获得了很好的结果。通过对比其他传感器实验结果,所设计的传感器具有很长的使用寿命,可以在连续使用25 h后,有很好的稳定性和可逆响应[30]。丝蛋白在−30~80 ℃的温度范围内结构稳定[31],因此,所设计的传感器不受温度影响。
表 6 不同设计的传感器的检测灵敏度
Table 6. Detection sensitivity of sensors of different designs
Sensor Time Sensitivity Ref. D-shaped fiber covered with molecularly imprinted polymer 2018 1.25 nm/ppb [32] Fiber together with gold functionalized by biological receptors 2018 0.10 nm/ppb [33] Coated fibres based on Fabry-Perot interference 2020 178 nm/ppb [34] D-shaped fiber covered with Ag-Silk Fibroin-Ag structure 2023 1.39 nm/ppt - -
该文基于MIM结构和SPR原理设计了D型光纤传感器,用于检测有机物中的痕量水,传感材料主要使用金属银和丝蛋白,金属银组成的夹层结构可以使局部电场显著增强,进而提高传感器的灵敏度。丝蛋白具有良好的光学特性并且可以快速而精确地对外部刺激做出可逆的体积变化,因此,可以通过其膨胀体积并结合达西定律计算出丝蛋白的吸水量,进一步求得有机物中的水含量。金属银和丝蛋白的结合确保了能够在可见波段实现痕量液体检测。另外,微通道夹层金属涂层结构的设计可以显著提高光纤SPR传感器的性能。最终通过对丝蛋白初始厚度、空气孔高度、银光栅的高度、数量、间距以及下层银厚度的优化,得到了最佳传感结构,实现了有机物中痕量水的高灵敏度测量,灵敏度可达1.39 nm/ppt,结果显著优于其他同类型的传感器。
Grapefruit-type three-core fiber sensor for trace water based on silver-silk protein-silver structure
-
摘要:
有机溶剂中的水杂质强烈影响化学反应的进程。然而,目前检测痕量水的方法仍存在操作复杂、实验试剂毒性高、检测灵敏度低、无法实时监测等不足。为了克服这些缺点,提出了一种在可见光波长范围内银和丝蛋白结合的D型光纤传感器。该传感器利用金属银和丝蛋白作为主要材料,利用二者出色的传感特性,设计了一种可见光波长的光纤传感器,用于高灵敏度有机化合物中的痕量水检测。研究结果总结如下: 首先,提出了在可见光波长范围内银和丝蛋白结合的三明治结构,银被用作外部夹层来诱导表面等离子体共振效应。通过理论分析,观察到所提出的D型光纤传感器表面的双层银结构与单层银结构相比,可以诱导强光局部化。在接下来的尺寸选择过程中,对丝蛋白初始厚度、空气孔大小、银光栅的高度、数量、间距和下层银厚度进行了优化,得到了最佳传感结构,对有机物中痕量水的检测灵敏度高达1.39 nm/ppt (1 ppt=10−12),与同类型的痕量水传感器相比具有较大的优势。另外,拟合线的R2大于0.999,达到了预期的效果。 Abstract:Objective Water impurity in organic solvent strongly affects the process of chemical reaction. However, current methods for detecting trace water still suffer from disadvantages such as complex operation, high toxicity of experimental reagents, low detection sensitivity, and the inability to monitor in real-time. In order to overcome these challenges, a D-type fiber sensor which combines silver and silk protein in the visible wavelength range is designed. It is designed for high-sensitivity detection of trace water in organic compounds, and the performance of the sensor is optimized and analyzed. Methods First of all, the circular air hole in the middle of the fiber is replaced by the grapefruit type, which increases its size by about ten times (Fig.1), which can reduce the difficulty of the sensor in the actual production process with high efficiency. In addition, the lower metal silver film on the side profile of D-type fiber can form an energy channel with the nearby large air hole of grapefruit type, which promotes the energy leakage of the fiber core into the plasma and enhance the SPR effect. Secondly, a certain number of silver grating structures are added to the lower part of the top silver film, which can make the incident bright part confined to the slit cavity. Through reasonable structural design and size optimization, the local surface plasmon resonance (SPR) wave and surface plasmon wave can further resonate, thus realizing the enhancement of SPR phenomenon. Results and Discussions Theoretical analysis shows that compared to a single-layer silver structure, the double-layer silver structure on the surface of the D-type fiber sensor can induce strong localized light. In the subsequent size selection process, the initial thickness of the silk protein and the height of the air hole (Tab.1), the height of the silver gratings (Tab.2), the amount of the silver gratings (Tab.3), the spacing of the silver gratings (Tab.4) and the thicknesses of the underlayer silver film (Tab.5) are optimized to obtain the optimal sensing structure. Through the above optimization, the optimal structural parameters of the sensor are as follows: the height of the fiber air hole is 4.5 μm, the height of the silver grating is 10 nm, the number of the silver grating is 58, the spacing of the silver grating is 50 nm, and the thickness of the underlying silver film is 31 nm. Compared with other structures or methods of trace water detection equipment in sensitivity or detection limit performance, the results show that the detection performance of the grapefruit-type three-core fiber sensor for trace water based on silver-silk protein-silver structure is much better than the previous design. Conclusions Based on metal insulator metal structure and SPR principle, D-type fiber sensor is designed to detect trace water in organic matter. The sensing materials mainly use silver metal and silk protein, and the sandwich structure composed of silver metal can significantly enhance the local electric field, thus improving the sensitivity of the sensor. Silk protein has good optical properties and can quickly and accurately make reversible volume changes in response to external stimuli. Therefore, water absorption of silk protein can be calculated by its expanded volume combined with Darcy's law, and the water content in organic matter can be further obtained. The high sensitivity measurement of trace water in organic matter is realized, and the sensitivity can reach 1.39 nm/ppt (1 ppt=10−12). Moreover, the fitted line has an R2 value greater than 0.999, achieving the expected performance. And the sensor is designed to have a long service life, and is not affected by temperature. -
Key words:
- double-layer silver film /
- silk protein /
- trace water sensor /
- surface plasmon resonance
-
图 3 丝蛋白的厚度为 (a) 60 nm;(b) 90 nm时,损耗峰随空气孔高度的变化曲线
Figure 3. When the thickness of silk protein is (a) 60 nm, (b) 90 nm, the loss peak varying curves with the height of air cores
图 4 丝蛋白的厚度为 (a) 60 nm、(b) 90 nm时,损耗峰随银光栅高度的变化曲线
Figure 4. When the thickness of silk protein is (a) 60 nm, (b) 90 nm, the loss peak changing curves with the height of silver grating
图 5 丝蛋白的厚度为 (a) 60 nm、(c) 90 nm时,损耗峰随银光栅数量的变化曲线;(b) 图5(a) 峰值处的局部放大图
Figure 5. When the thickness of silk protein is (a) 60 nm, (c) 90 nm, the loss peak changing curves with the number of the silver gratings; (b) Local magnification at the peak of Fig.5(a)
图 6 丝蛋白的厚度为 (a) 60 nm、(b) 90 nm时,损耗峰随银光栅间距的变化曲线
Figure 6. When the thickness of silk protein is (a) 60 nm, (b) 90 nm, the loss peak variesying curves with the spacing of the silver gratings
表 1 不同丝蛋白厚度的传感器参数比较
Table 1. Comparison of sensor parameters of different silk protein thicknesses
Thickness of
silk protein/nmResonance
wavelength/nmPeak value of
loss/dB·m−1FWHM/
nm40 371 60216 68.4 60 388 114040 40.5 90 419 280430 27.6 100 430 361840 24.6  下载: 导出CSV
表 2 丝蛋白的厚度为60 nm和90 nm时,不同银光栅高度下的传感器参数比较
Table 2. When the thickness of silk protein is 60 nm and 90 nm, comparison of sensor parameters under different silver grating heights
h1/nm Resonance
wavelength/nmPeak value of
loss/dB·m−1FWHM/nm 60 nm 90 nm 60 nm 90 nm 60 nm 90 nm 0 383.3 - 87217 - 45.8 - 7 390.2 422.5 106380 243900 41.3 29.8 8 391.5 423.9 109490 242560 41.4 31.2 9 392.6 425.5 112770 236010 41.6 38.3 10 394 428.1 116330 233190 41.6 39.7
下载: 导出CSV
表 3 丝蛋白的厚度为60 nm和90 nm时,不同银光栅数量下的传感器参数比较
Table 3. When the thickness of silk protein is 60 nm and 90 nm, comparison of sensor parameters under different amount of silver grating
n Resonance
wavelength/nmPeak value of
loss/dB·m−1FWHM/
nm60 nm 90 nm 60 nm 90 nm 60 nm 90 nm 28 394.0 428.1 116330 233190 41.6 39.7 38 394.9 431 124200 243630 40.1 40 48 395.6 432.4 127910 247600 39.4 40.2 58 395.9 433.3 129650 247660 39.1 40.4
下载: 导出CSV
表 4 丝蛋白的厚度为60 nm和90 nm时,不同银光栅间距下的传感器参数比较
Table 4. When the thickness of silk protein is 60 nm and 90 nm, comparison of sensor parameters under different silver grating spacing
d1/nm Resonance
wavelength/nmPeak value of
loss/dB·m−1FWHM/
nm60 nm 90 nm 60 nm 90 nm 60 nm 90 nm 20 395.9 429 129650 247660 39.1 40.4 30 398.4 432 142730 300300 36.2 29.7 40 400.6 434 151790 343760 35.5 24.1 50 402.1 436.2 159180 382740 34.6 21.9
下载: 导出CSV
表 5 丝蛋白的厚度为60 nm和90 nm时,不同下层银膜厚度的传感器参数比较
Table 5. When the thickness of silk protein is 60 nm and 90 nm, comparison of sensor parameters of different underlayer silver film thicknesses
A1/nm Resonance
wavelength/nmPeak value of
loss/dB·m−1FWHM/
nm60 nm 90 nm 60 nm 90 nm 60 nm 90 nm 25 402.1 436.2 159180 382740 34.7 21.9 27 404.5 439.2 141000 316640 35 23.4 29 406.9 442.3 124240 263810 35.2 25.3 31 408.4 444.9 109270 221340 35.8 26.5
下载: 导出CSV
表 6 不同设计的传感器的检测灵敏度
Table 6. Detection sensitivity of sensors of different designs
Sensor Time Sensitivity Ref. D-shaped fiber covered with molecularly imprinted polymer 2018 1.25 nm/ppb [32] Fiber together with gold functionalized by biological receptors 2018 0.10 nm/ppb [33] Coated fibres based on Fabry-Perot interference 2020 178 nm/ppb [34] D-shaped fiber covered with Ag-Silk Fibroin-Ag structure 2023 1.39 nm/ppt -
下载: 导出CSV
-
[1] Inagaki S, Morii N, Numata M. Development of a reliable method to determine water content by headspace gas chromatography/mass spectrometry with the standard addition technique [J]. Analytical Methods, 2015, 7(11): 4816-4820. doi: 10.1039/C5AY00832H [2] Veillet S, Tomao V, Visinoni F, et al. New and rapid analytical procedure for water content determination: microwave accelerated Dean-Stark [J]. Analytica Chimica Acta, 2009, 632(2): 203-207. doi: 10.1016/j.aca.2008.11.008 [3] Ooyama Y, Aoyama S, Furue K, et al. Fluorescence sensor for water based on PET (photo-induced electron transfer): Anthracene-bis (aminomethyl) phenylboronic acid ester [J]. Dyes and Pigments, 2015, 123: 248-253. doi: 10.1016/j.dyepig.2015.07.042 [4] Tavčar E, Turk E, Kreft S. Simple modification of Karl-Fischer titration method for determination of water content in colored samples [J]. Journal of Analytical Methods in Chemistry, 2012, 2012: 379724. doi: 10.1155/2012/379724 [5] Kumar P, Ghosh A, Jose D A. Chemical sensors for water detection in organic solvents and their applications [J]. Chemistry Select, 2021, 6(4): 820-842. doi: 10.1002/slct.202003920 [6] Westrich H R. Determination of water in volcanic glasses by Karl-Fischer titration [J]. Chemical Geology, 1987, 63(3): 335-340. [7] Bruttel P, Schlink R. Water determination by Karl Fischer titration [J]. Metrohm Monograph, 2003, 8(5003): 2003-2009. [8] Verhoef J C, Barendrecht E. Mechanism and reaction rate of the Karl Fischer titration reaction: Part V. Analytical Implications [J]. Analytica Chimica Acta, 1977, 94(2): 395-403. doi: 10.1016/S0003-2670(01)84541-4 [9] Wang J, Li Z, Wang J. All-optical fiber miniature soil moisture content sensor [J]. Infrared and Laser Engineering, 2022, 51(3): 20210299. (in Chinese) doi: 10.3788/IRLA20210299 [10] Guan L, Lu Y, He Z, et al. Design and development of an intelligent security alarm system based on optical fiber sensing [J]. Infrared and Laser Engineering, 2022, 51(8): 20220028. (in Chinese) doi: 10.3788/IRLA20220028 [11] Qin G, Meng F, Li H, et al. Adaptive demodulation of reflection spectrum intensity of fiber grating link [J]. Infrared and Laser Engineering, 2022, 51(5): 20200440. (in Chinese) doi: 10.3788/IRLA20200440 [12] Sun G, Wang P, Jiang Y, et al. Research progress on flexible fiber-based tactile sensors [J]. Journal of Hebei University of Technology, 2022, 51(4): 1-19. (in Chinese) [13] Zhou Z, Shi Z, Cai X, et al. The use of functionalized silk fibroin films as a platform for optical diffraction-based sensing applications [J]. Advanced Materials, 2017, 29(15): 1605471. doi: 10.1002/adma.201605471 [14] Padaki N V, Das B, Basu A. 1-Advances in understanding the properties of silk[M]//Advances in Silk Science and Technology. Cambridge: Woodhead Publishing, 2015: 3-16. [15] Fan S, Zhang Y, Huang X, et al. Silk materials for medical, electronic and optical applications [J]. Science China (Technological Sciences), 2019, 62(6): 903-918. doi: 10.1007/s11431-018-9403-8 [16] Chen Y, Duan L, Ma Y, et al. Preparation of transient electronic devices with silk fibroin film as a flexible substrate [J]. Colloids and Surfaces A: Physicochemical and Engineering Aspects, 2020, 600(5): 124896. doi: https://doi.org/10.1016/j.colsurfa.2020.124896 [17] Kwon H, Kim S. Chemically tunable, biocompatible, and cost-effective metal-insulator-metal resonators using silk protein and ultrathin silver films [J]. ACS Photonics, 2015, 2(12): 1675-1680. doi: 10.1021/acsphotonics.5b00470 [18] Wang Y, Li M, Wang Y. Silk: a versatile biomaterial for advanced optics and photonics [Invited] [J]. Chinese Optics Letters, 2020, 18(8): 080004. doi: 10.3788/COL202018.080004 [19] Arif S, Umar M, Kim S. Interacting metal-insulator-metal resonator by nanoporous silver and silk protein nanomembranes and its water-sensing application [J]. ACS Omega, 2019, 4(5): 9010-9016. doi: 10.1021/acsomega.9b00838 [20] Zhang Y, Hong Y, Sheng Y, et al. Current status and development trends of mid-infrared hollow core fiber technology (Invited) [J]. Infrared and Laser Engineering, 2023, 52(5): 20230132. (in Chinese) doi: 10.3788/IRLA20230132 [21] Wang W, Sheng X, Hu K, et al. Novel hybrid-structured polarization-maintaining hollow core fiber [J]. Electro-Optic Technology Application, 2022, 37(2): 41-47. (in Chinese) [22] Li N, Li B, Xing C, et al. Research progress on regulation of ion channel function by near-infrared light-responsive materials [J]. Journal of Hebei University of Technology, 2022, 51(5): 43-54. (in Chinese) [23] Liu S, Zhang Y, Zhao L W, et al. Research on multi core hollow core photonic band gap fiber for 2 μm band laser transmission [J]. Electro-Optic Technology Application, 2023, 38(1): 21-27. (in Chinese) [24] Zhang Y, Liu S, Bai Z. Research on characteristics of 2 μm band 7-cell hollow core photonic bandgap fiber [J]. Electro-Optic Technology Application, 2021, 36(1): 34-38. (in Chinese) [25] Qin C. Sol-gel method in fiber preparation [J]. Optical Fiber & Electric Cable and Their Applications, 1989, 1(3): 21-26. (in Chinese) [26] Yin Z, Zou L, Tang B, et al. Preparation of large-pore SiO2 crystal on fiber substrate by sol-gel method [J]. Journal of Jiangsu University of Science and Technology, 2015, 21(6): 43-49. (in Chinese) [27] Mrázek J, Matejec V, Kasik I, et al. Application of the solgel method at the fabrication of microstructure fibers [J]. Journal of Solgel Science and Technology, 2004, 31(1): 175-178. [28] Wang K, Jin Y, Liu Y, et al. Preparation and characterization of multi-morphology and multi-period micro-nano composite structures [J]. Advances in Laser and Optoelectronics, 2019, 56(12): 51-58. [29] Dai Y. Fabrication and optical properties of large-area micro-nano structures[D]. Hefei: University of Science and Technology of China, 2019. (in Chinese) [30] Liu X, Zhang W, Lin Z, et al. Coupling of silk fibroin nanofibrils enzymatic membrane with ultra-thin PtNPs/graphene film to acquire long and stanble on-skin sweat glucose and lactate sensing [J]. Small Methods, 2021, 5(3): 2000926. doi: 10.1002/smtd.202000926 [31] Liu J, Chen Q, Liu Q, et al. Intelligent silk fibroin ionotronic skin for temperature sensing [J]. Advanced Materials Technologies, 2020, 5(7): 200430. [32] Cennamo N, Zeni L, Tortora P, et al. A molecularly imprinted polymer on a plasmonic plastic optical fiber to detect perfluorinated compounds in water [J]. Sensors, 2018, 18(6): 1836. doi: 10.3390/s18061836 [33] Cennamo N, Zeni L, Tortora P, et al. A high sensitivity biosensor to detect the presence of perfluorinated compounds in environment [J]. Talanta, 2018, 178: 955-961. doi: 10.1016/j.talanta.2017.10.034 [34] Faiz F, Baxter G, Collins S, et al. Polyvinylidene fluoride coated optical fibre for detecting perfluorinated chemicals [J]. Sensors and Actuators B: Chemical, 2020, 312: 128006. doi: 10.1016/j.snb.2020.128006 -

 点击查看大图

计量
- 文章访问数: 106
- HTML全文浏览量: 29
- PDF下载量: 28
- 被引次数: 0

