


-
随着工业化的不断发展,气体压强检测在实际测量中的需求越来越大。例如在气体管道泄漏问题、轮胎气密性实验问题、井下通风、中央空调、风管风力、电力及煤炭行业压力过程、有气压要求的实验室、消防工程用的室内气体压力控制领域等方面都有重要应用。目前压强检测方法多为接触式测量,很难满足恶劣环境下的瞬时测量需求。调谐激光吸收光谱(Tunable Laser Absorption Spectroscopy, TLAS)技术是一种非接触式气体测量方法,可进行实时、快速、多组分多参数测量,灵敏度高,适用于恶劣环境[1]。因此,基于TLAS技术可对气体进行浓度、温度、压强的测量。
TLAS技术在气体压强检测中得到了一定的发展。贾良权[2]等研究了在不同温度压强(1~10 atm, 1 atm=1.013×10⁵ Pa)下O2分子吸收谱线的二次谐波峰值,对通过二次谐波峰值反演气体浓度产生的误差进行了分析,提出了误差修正方法。陈舟[3]等考虑了温度压强同时变化对气体线型峰值的影响,得出在压强1×10⁻³ atm−1~1×10³ atm或温度在70~2 500 K时可用Lorentz线型峰值来计算峰值吸收系数。李金义[4]等人利用CO2吸收谱线的一次谐波峰谷值间距和二次谐波过零点间距分别反演气体压强,与传感器测得的压强对比,偏差在1%以内。吕晓静[5]等在1~ 10.13×10⁵ Pa压力环境下,对1.58 µm处CO2吸收光谱进行了数值模拟,得到了高压下的CO2吸收光谱特性,为TLAS技术应用于研究高压燃烧环境打下基础。张博涵[6]等以CO2气体为研究对象构建压力测量模型,对测量模型进行仿真分析以及实验验证,结果表明,在1~2 atm的气压范围内,吸光度曲线仿真结果与SpectraPlot的结果高度重合。这些研究对于建立压强从低压到高压之间的模型并探讨系统自带干扰对模型有无影响没有提及。
还有很多针对压强展开的气体测量工作。段金虎[7]等基于直接吸收光谱来测量气体压强,但是直接吸收光谱法测量易受干扰,测量误差较大。该小组[8]又利用波长调制光谱技术来测量两条H2O吸收谱线,基于谱线的4fpeak/2fpeak和2f/1f信号,通过迭代算法实现了气体压强和组分浓度的同时测量。Cai[9]等通过TLAS技术测量了无菌液体瓶顶部空间的压力和水的浓度。Sur[10]等将波长调制光谱法应用于高压煤气化炉中,对煤气化炉中CO、CO2、H2O等进行了测量。曹亚南[11]等用位于7168.437 cm−1处的H2O的吸收谱线对密闭玻璃容器中H2O的浓度和压力进行了同步测量。这些都是压强检测时只考虑了理想情况,没有考虑噪声、背景干扰等影响下的压强检测。测得的气体吸收谱线可能由于系统干扰会对压强反演有不同影响,因此需要考虑不同干扰情况下的压强检测。
文中基于TLAS原理,运用基于分析吸收线线型与压强之间关系的研究方法进行压强检测。模拟实际系统测得的吸收谱线对气体压强进行仿真研究,分析不同干扰情况下信号拟合度的变化趋势,建立压强与拟合度之比的数学模型。利用TLAS技术进行气体检测,将二次谐波信号进行压强反演,并与仿真结果进行比较,验证所建立模型,为气体压强的非接触测量提供了新的思路。
-
当一束频率为$ \nu $的单色光穿过长度为L的充满某种介质的吸收池时,介质分子吸收一部分光能,透射光强$ I $和入射光强$ {I}_{0} $之间满足Lambert-Beer定律[12]:
$$ I={I}_{0}\exp\left[-\alpha \left(\nu \right)CL\right]={I}_{0}\exp\left[-PS\left(T\right)\varphi \left(\nu \right)CL\right] $$ (1) 式中:$ \alpha \left(\nu \right) $为气体的吸收系数,cm−1,该系数与气体的种类以及穿过该气体的光频率有关;C为探测气体的浓度,mol·cm−3;L为吸收光程长度,cm;P为待测气体的压强,atm;S(T)为谱线的吸收强度,cm−2·atm−1,只与温度有关;$ \varphi \left(\nu \right) $为线型函数,表示待测气体吸收谱线的形状,与待测气体温度、压强、种类及各成分含量有关[13]。
-
不同展宽机制对应不同的谱线线型,主要分为三种基本线型[14]:Lorentz线型、Gauss线型、Voigt线型。线型函数表示被测气体吸收谱线的形状,主要存在两种谱线展宽机制[15]:碰撞展宽和多普勒展宽。
碰撞展宽是由于辐射原子或分子周围存在大量的干扰粒子,它们之间相互碰撞引起谱线加宽。随着压力的增大,碰撞加宽作用加大导致谱线线宽增加,因此这种展宽又称为压力展宽。碰撞展宽的线型函数是Lorentz函数,其线型函数表达式为:
$$ {g}_{L}\left(\nu ,{\nu }_{0}\right)=\frac{1}{2\pi }\frac{\mathrm{\Delta }{\nu }_{L}}{{\left(\nu -{\nu }_{0}\right)}^{2}+{\left(\dfrac{\mathrm{\Delta }{\nu }_{L}}{2}\right)}^{2}} $$ (2) 式中:$ {\nu }_{0} $为谱线中心吸收频率;$ \mathrm{\Delta }{\nu }_{L} $为Lorentz线型的半高宽。
多普勒展宽是由于分子的无规则热运动,分子吸收激光后引发多普勒频移,分子吸收和发射单频光的机率不再相同引起谱线加宽。气体多普勒展宽的线型函数一般为Gauss函数,谱线的多普勒展宽的线型函数表达式为:
$$ {g}_{D}\left(\nu ,{\nu }_{0}\right)=\frac{2}{\mathrm{\Delta }{\nu }_{D}}\sqrt{\frac{{\rm{ln}} 2}{\pi }}\exp \left[-4 {\rm{ln}} 2{\left(\dfrac{\nu -{\nu }_{0}}{\mathrm{\Delta }{\nu }_{D}}\right)}^{2}\right] $$ (3) 式中:$ {\nu }_{0} $为谱线中心吸收频率;$ \mathrm{\Delta }{\nu }_{D} $为Gauss线型的半高宽。
Gauss线型与压强变化无关;Lorentz线型随压强的增大而减小;Voigt线型随着压强的增大由Gauss线型向Lorentz线型过渡,由Gauss线型和Lorentz线型的卷积得到[16]。其近似表达式为[17]:
$$ {g}_{\nu }\left(\nu ,{\nu }_{0}\right)=\frac{2}{\mathrm{\Delta }{\nu }_{D}}\sqrt{\frac{{\rm{ln}}2}{\pi }}\frac{a}{\pi }{\int }_{-\infty }^{+\infty }\frac{\exp\left(-{y}^{2}\right)}{{a}^{2}+{\left(w-y\right)}^{2}}{\rm{d}}y $$ (4) 式中:$a=\dfrac{\sqrt{{\rm{ln}}2}\mathrm{\Delta }{\nu }_{L}}{\mathrm{\Delta }{\nu }_{G}}$;$w=\dfrac{\sqrt{{\rm{ln}}2}\left(\nu -{\nu }_{0}\right)}{\mathrm{\Delta }{\nu }_{G}}$;$y=\dfrac{\sqrt{{\rm{ln}}2}\left({\nu }_{i}-\nu \right)}{\mathrm{\Delta }{\nu }_{G}}$;$ \mathrm{\Delta }{\mathrm{\nu }}_{G} $、$ \mathrm{\Delta }{\nu }_{L} $分别为多普勒展宽和碰撞展宽的半高宽;$ {\nu }_{0} $为线型中心频率;$ {\nu }_{i} $为激光频率[18]。
基于谐波检测原理得到Voigt线型函数的二次谐波信号,其峰宽用两谷值之间的波长宽度表示,无论Gauss线型还是Lorentz线型,原函数的半高宽与二次谐波的峰宽之比均为常数,因此气体吸收峰的半高宽可由二次谐波的峰宽描述。随着压强的增大,碰撞展宽在谱线展宽中逐渐占据主导因素,而Lorentz线型的半高宽与压强成正比,谱线的宽度会随之变大。也就是说压强对二次谐波信号产生影响,进而反映在吸收线线型上。因此文中基于压强对吸收谱线的影响,通过调节两种线型半高宽占比来模拟压强变化,以Gauss线型和Lorentz线型的表达式分别拟合,通过拟合度之比的测量对气体压强进行实时检测。
-
文中对通过卷积方式得到的二阶导数信号进行仿真分析,固定两原函数半高宽和为1,Lorentz原函数半高宽占总峰宽比例为5%~95%,间隔5%,令Gauss原函数峰高与Lorentz二阶导数信号峰高都为1保持不变。
当Lorentz原函数半高宽占总峰宽比例为5%、95%时仿真曲线如图1所示。
由图1可知,随着压强的增加,曲线由接近Gauss拟合变为接近Lorentz拟合,与上面论述一致。
依据上述方法计算得到19组仿真结果,其中Gauss拟合度与Lorentz拟合度之比用大写字母Y (Lfit/Gfit)表示。Y随半高宽占比改变而改变,而压强变化用半高宽占比模拟,故可建立压强与Y之间的关系。通过对仿真结果进行拟合,得到压强与Y之间各阶拟合曲线如图2所示。
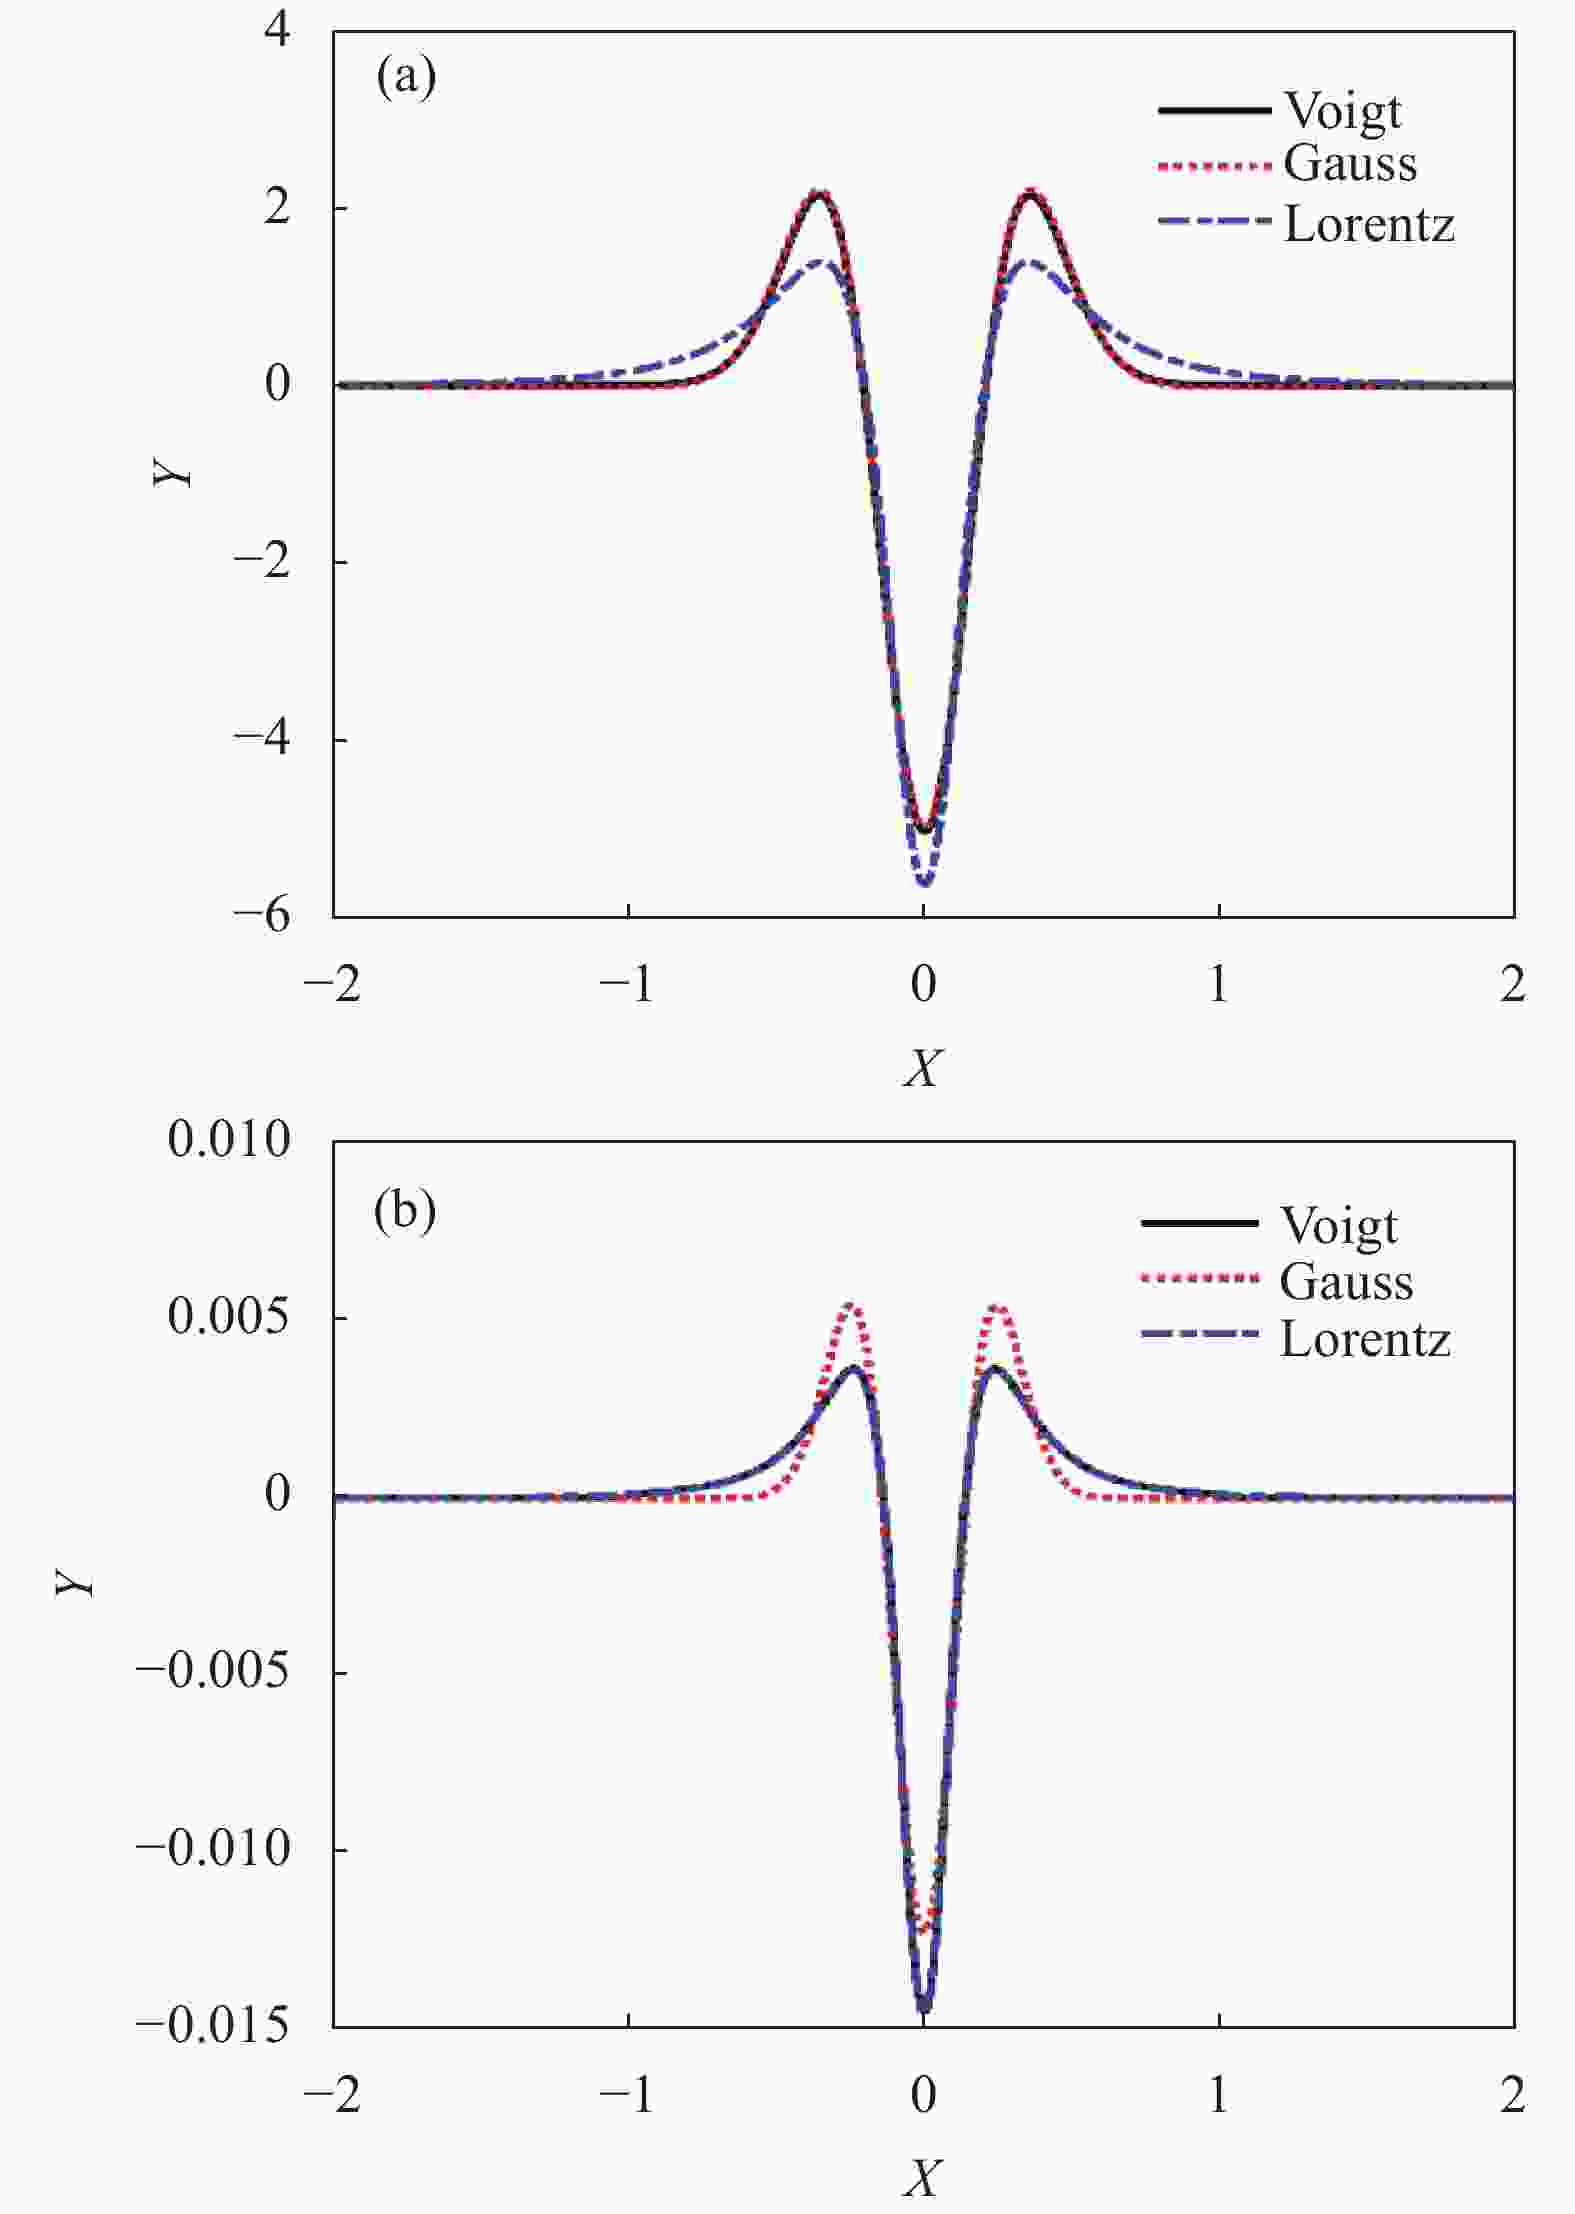
图 1 仿真曲线:(a) Lorentz原函数占总峰宽比例5%;(b) Lorentz原函数占总峰宽比例95%
Figure 1. Simulation curve: (a) The original Lorentz function accounts for 5% of the total peak width; (b) The original Lorentz function accounts for 95% of the total peak width

图 2 压强与Y的拟合曲线
Figure 2. Fitting curve of pressure and Y
由图2可知,压强与Y的三阶拟合有很好的拟合效果,故可运用三阶拟合公式进行模拟压强检测,即可初步确定Y与压强之间近似三阶拟合关系。
-
激光器线宽通常远小于吸收峰的峰宽,仿真过程中,设激光器线宽信号模型的幅值为1,峰宽为第一次卷积前Lorentz二阶函数信号的原函数半高宽的1/20、1/10、3/20、1/5。加原函数半高宽的1/20、1/10、3/20、1/5的激光器线宽后,压强与Y的曲线拟合结果对比如图3所示。
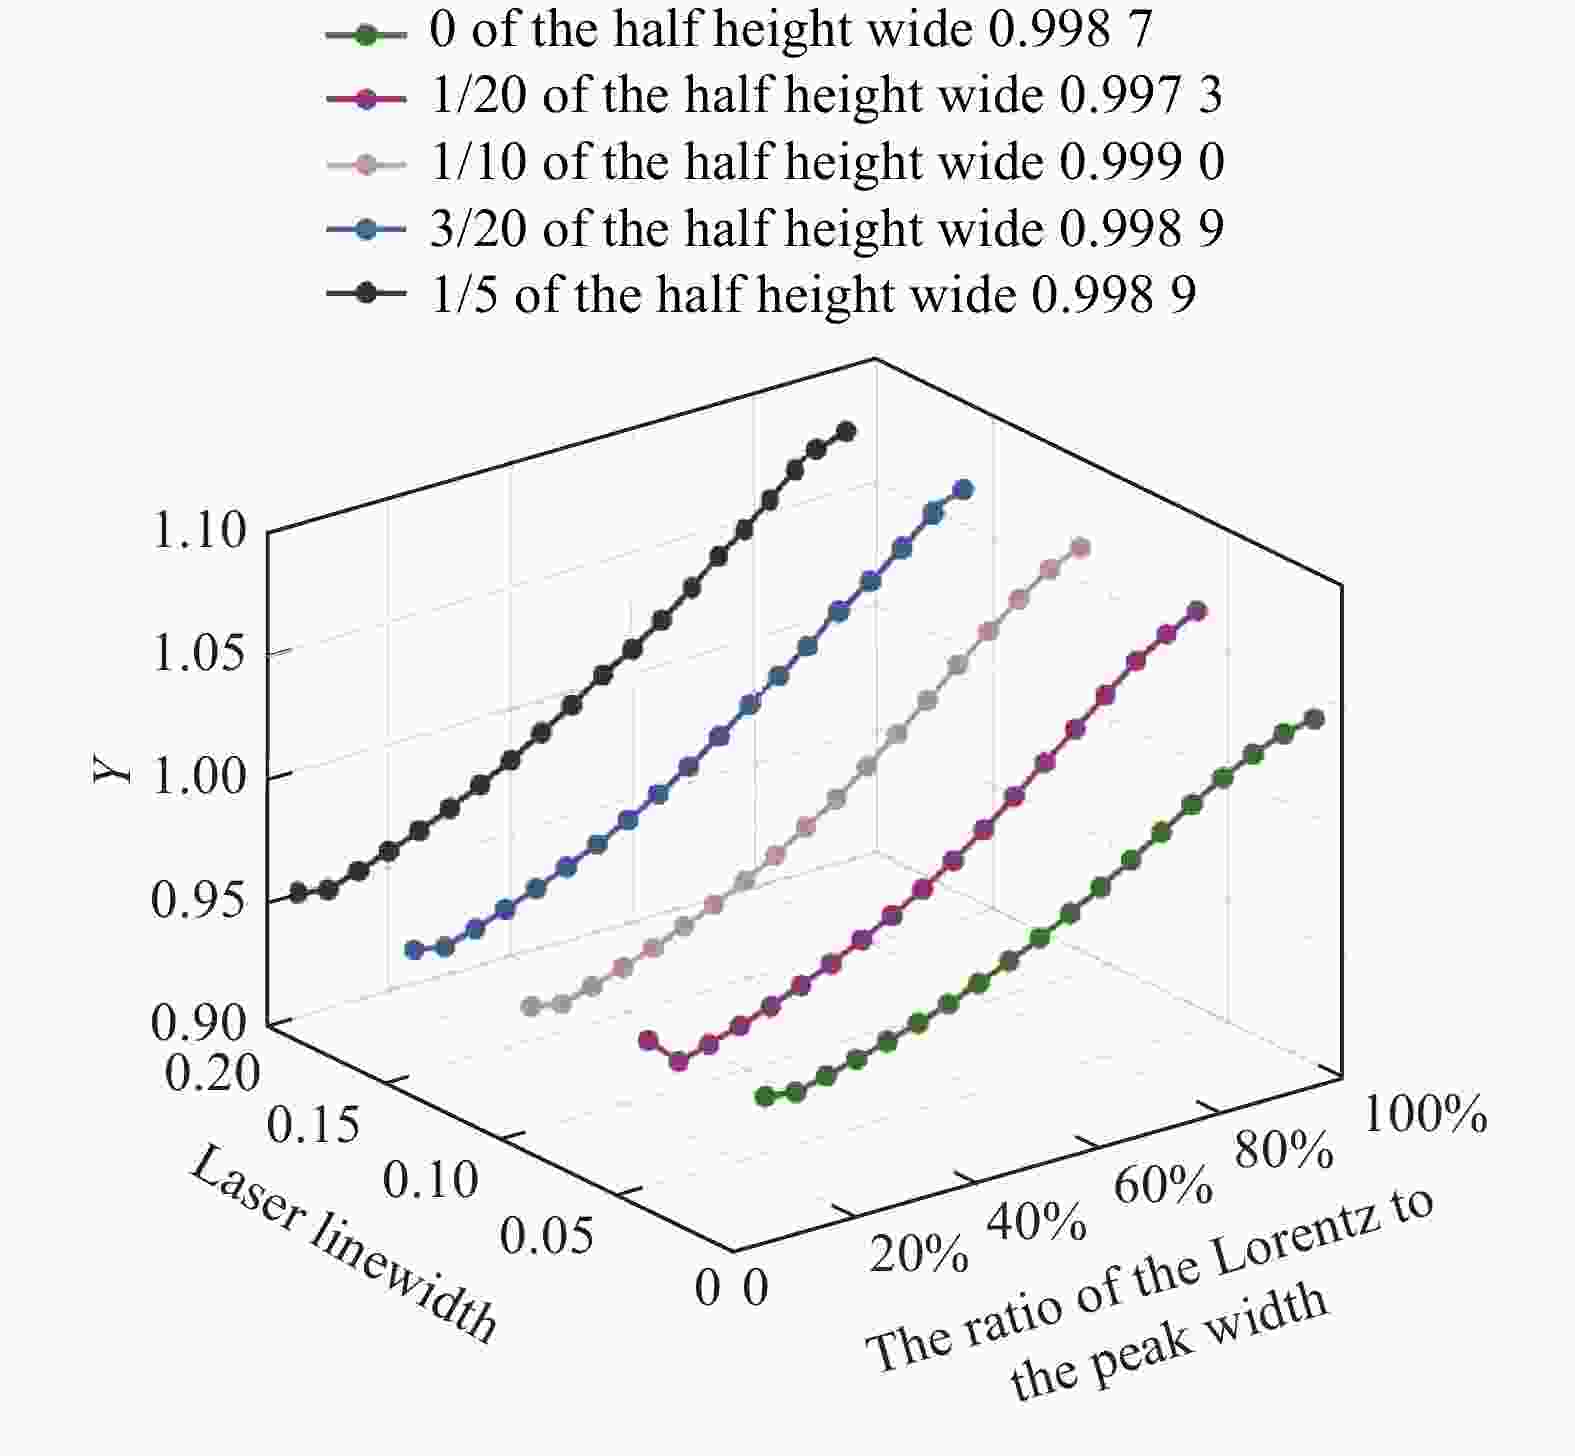
图 3 加激光器线宽后压强与Y的曲线对比图
Figure 3. Curve comparison of pressure and Y after adding the laser linewidth
由图3可知,加入激光器线宽后Y值变大,在图中表现为曲线纵向伸展,激光器线宽越宽Y值越大,曲线纵向伸展越明显,但整体上压强与Y仍满足三阶拟合关系。
-
在实际系统中存在白噪声的影响,向二阶Voigt信号加上不同幅值比例的白噪声信号,通过Y值来分析白噪声对仿真信号的影响。
TLAS系统信噪比为100左右,所以选取白噪声幅值系数分别为信号峰高的1/400、1/200、1/150、1/100、1/80、1/60、1/40、1/30、1/20。对最终信号进行函数拟合,通过Y值分析白噪声对仿真信号的影响。加白噪声后,压强与Y的曲线对比如图4所示。
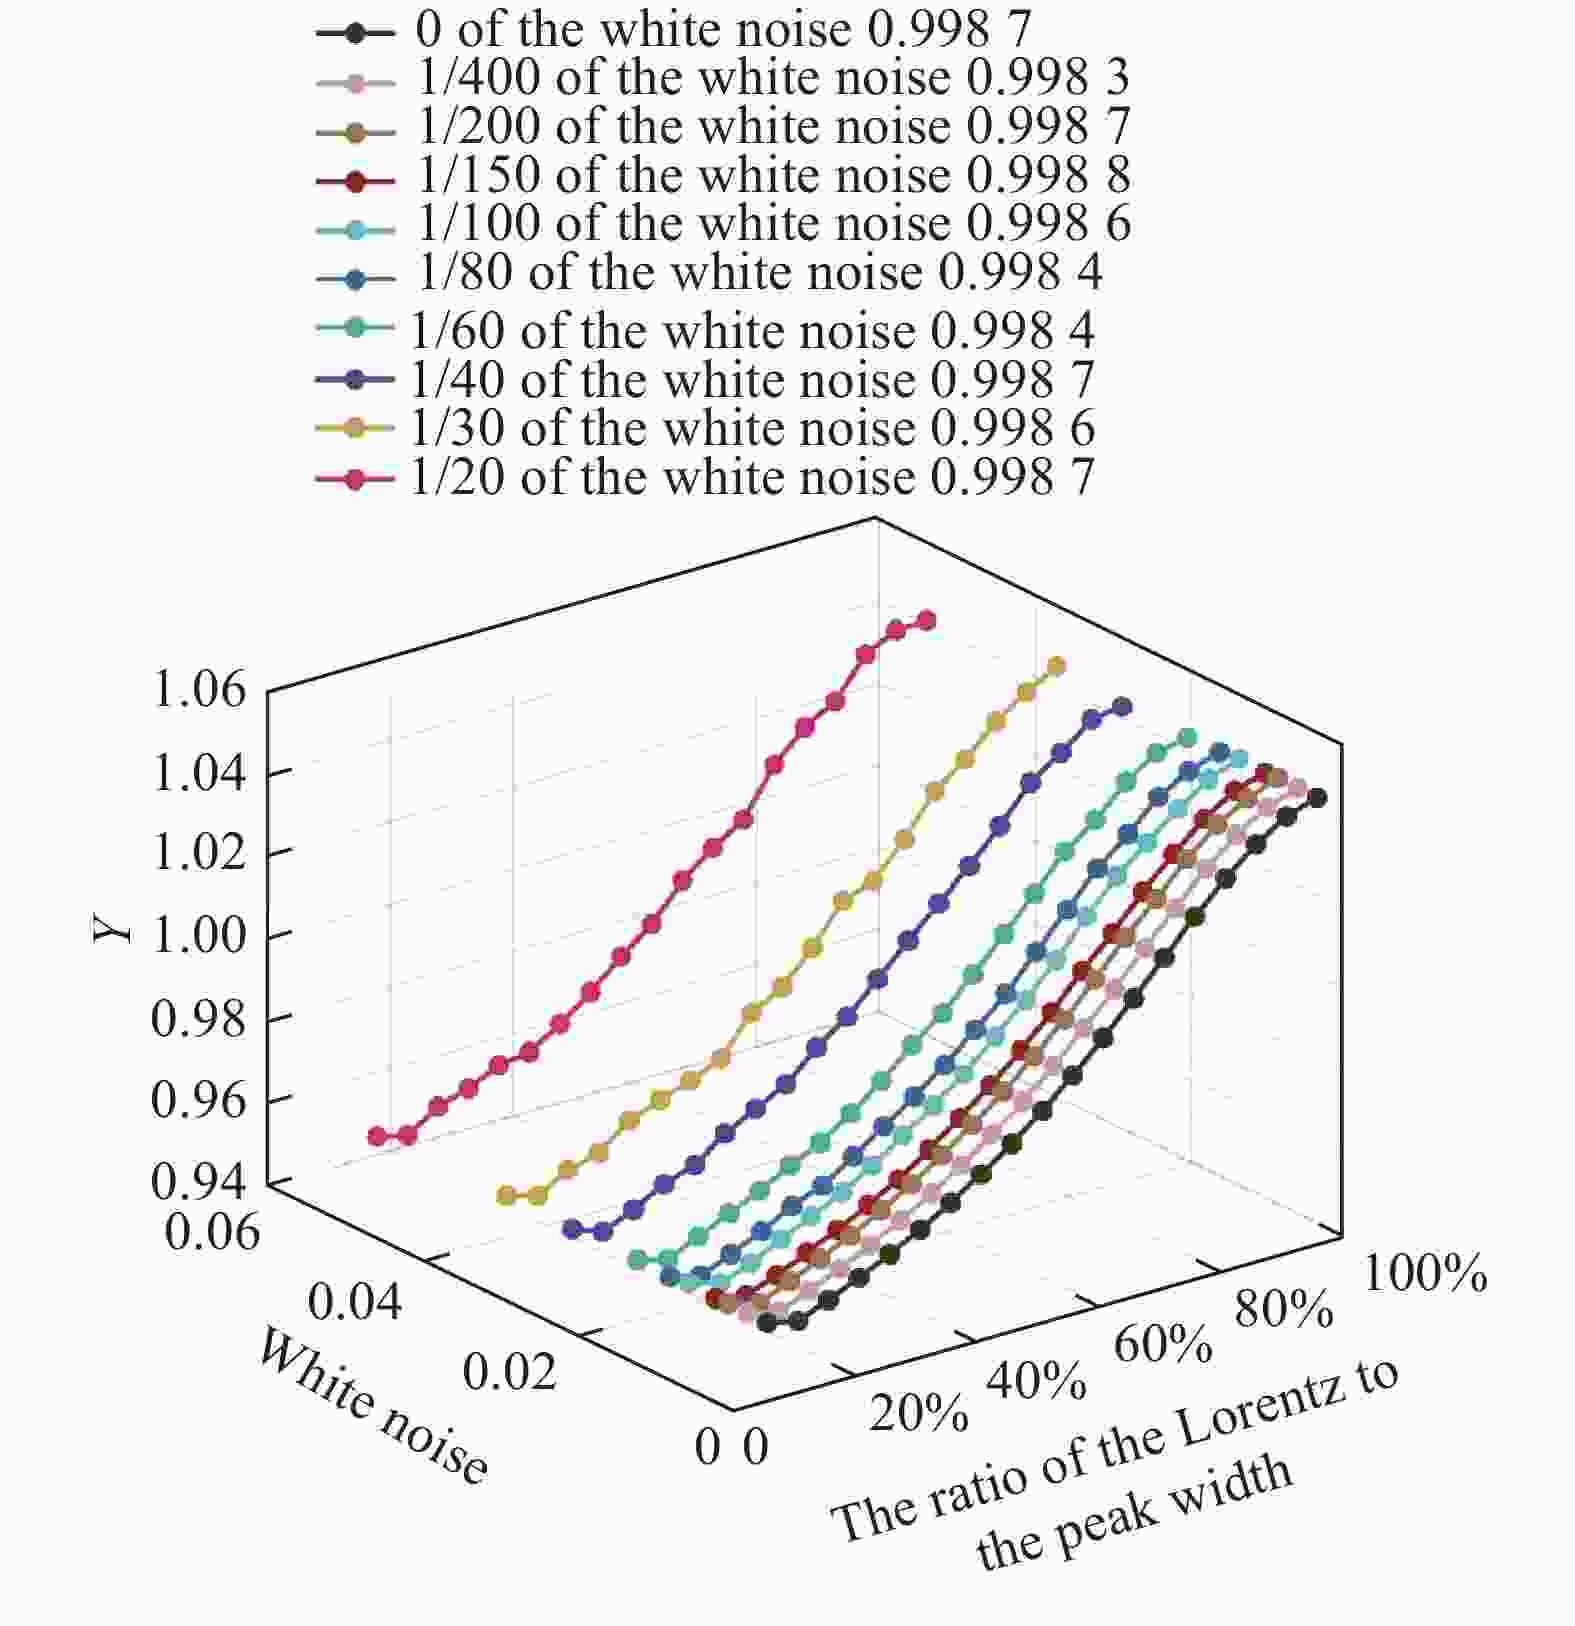
图 4 加不同幅值系数白噪声后压强与Y的曲线对比图
Figure 4. Curve comparison of pressure and Y after adding white noise with different amplitude coefficients
由于白噪声具有随机性的特点,故考虑白噪声后,图像会有白噪声的无规律波动,但整体上压强与Y仍满足三阶拟合关系。
-
在实际情况下会有背景干扰的影响。向二阶Voigt信号加上背景干扰,将结果进行函数拟合,通过Y值分析背景干扰对仿真信号的影响。
用正弦函数仿真背景干扰,分别分析幅值、频率的变化对曲线拟合度的影响。
-
保持背景干扰的频率和相位不变,研究幅值变化对拟合度的影响,如图5所示,幅值分别取峰高的5%、10%、15%、20%、30%、40%、60%时,可以看出Y与压强的拟合曲线都有很好的三阶拟合关系,幅值变化对压强与Y的拟合曲线没有影响。

图 5 频率为信号频率的0.1倍时,加不同幅值背景干扰后压强与Y的曲线对比图
Figure 5. When the frequency is 0.1 times the signal frequency, the curve comparison of pressure and Y after adding background interference of different amplitudes
-
取背景干扰的幅值为信号峰高的10%,频率分别为信号频率的0.2、0.4、0.6、0.8、1、1.2、1.4、1.6、1.8、2。加不同频率的背景干扰后,压强与Y的拟合曲线如图6所示。
由图6可知,不同频率下压强与Y的拟合曲线都有较高的三阶拟合度,曲线整体有上下的波动。由此说明背景干扰的频率变化对压强与Y的拟合曲线的拟合度无影响。

图 6 加不同频率的背景干扰后压强与Y的曲线对比图
Figure 6. Curve comparison of the pressure and Y after adding background interference of different frequencies
-
在已有的压强测量方法中,主要包括峰宽检测与2f/4f幅值检测。用上述Voigt函数,对压强和谱线峰宽、二次谐波与四次谐波幅值之比的数学模型进行仿真分析。仿真结果与Gauss/Lorentz拟合度之比相近,两种特征值与压强的拟合结果均为三阶,且在固定激光器线宽、噪声与背景的干扰下,三阶拟合度仍能保持在0.998 0以上。
为比较文中提出的Gauss/Lorentz拟合度之比与峰宽、2f/4f幅值面对不同噪声与背景干扰下的抗干扰能力,对生成的同一谱线,加不同噪声与背景,用标准差评价其特征值的起伏程度,结果如表1所示。
由于Gauss/Lorentz拟合度之比的计算过程中,整条谱线的所有点都参与拟合计算,而峰宽和2f/4f幅值的特征值由部分特征点计算得到,易受到各种因素的影响。因而在抗干扰能力方面,Gauss/Lorentz拟合度之比优于峰宽和2f/4f幅值,例如在背景频率变化干扰中,特征值能够保持相对稳定,如图7所示。
表 1 同一谱线三种特征值在不同噪声与背景下的标准差
Table 1. The standard deviation of three eigenvalues of the same spectral line in different noise and background
Influencing factors Noise changes Background amplitude changes Background frequency changes The ratio of the fitting of Gauss and Lorentz 0.000 868 8 0.054 38 0.005 514 Peak width 0.011 28 0.168 9 0.071 97 Amplitude of 2f/4f 0.001 194 0.070 07 0.026 55 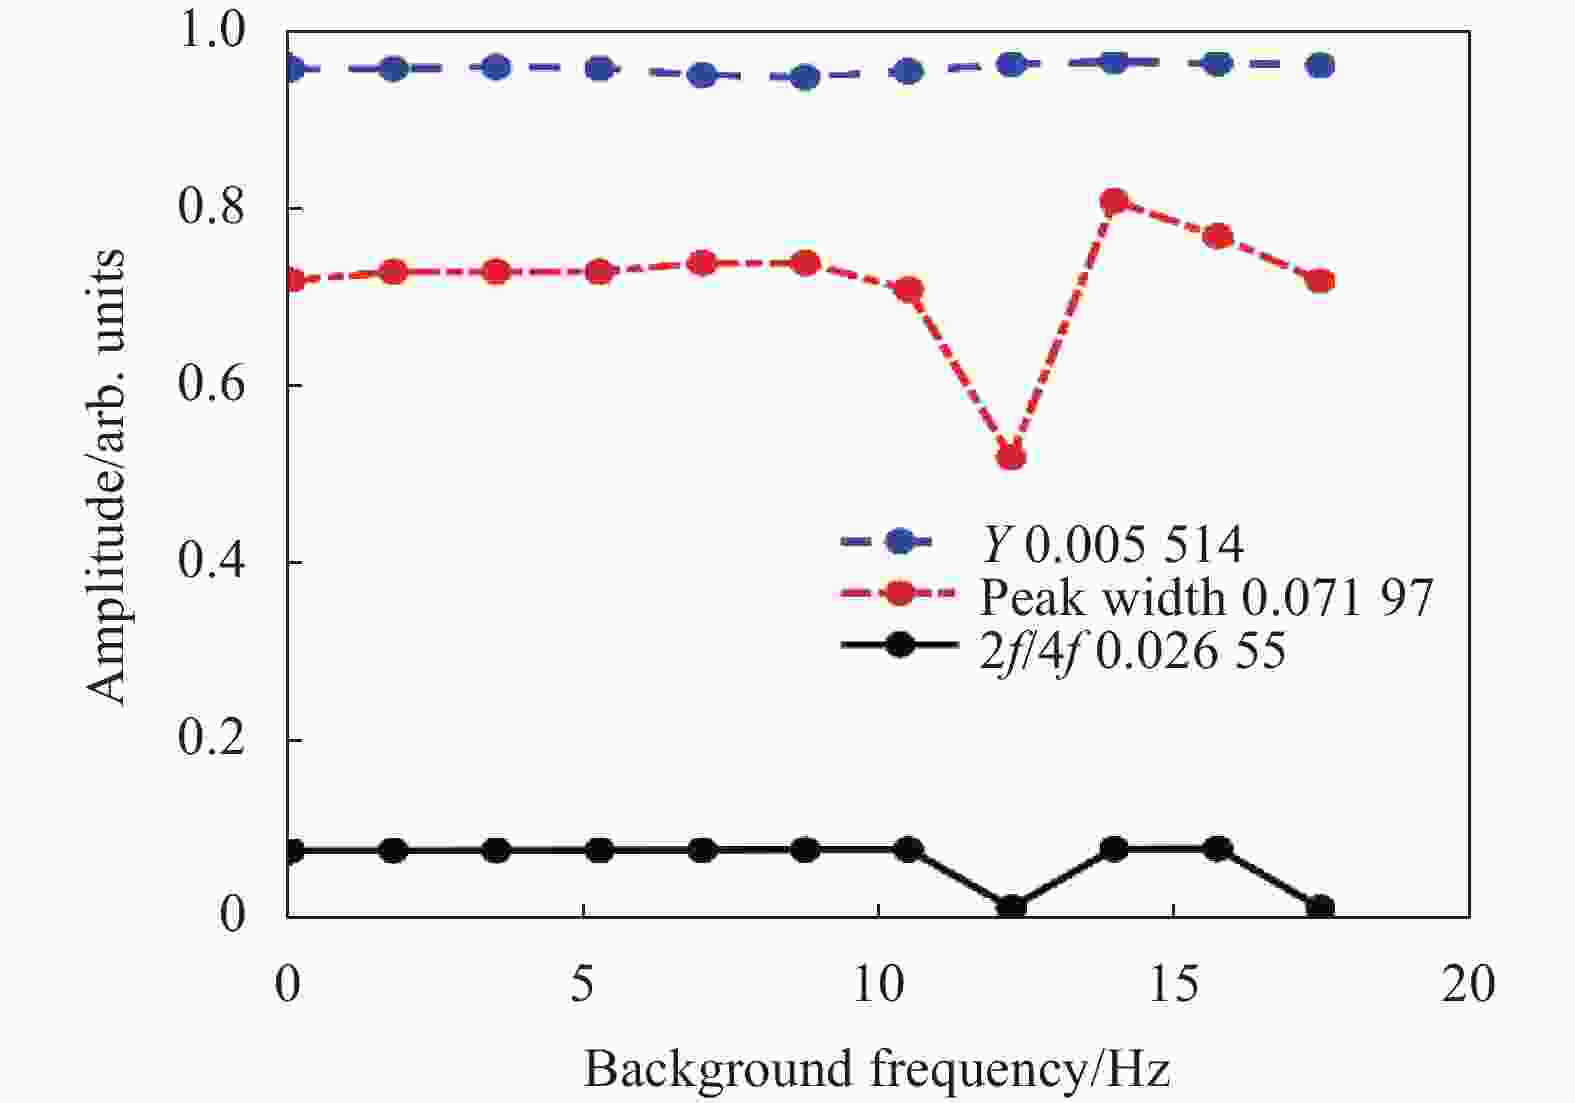
图 7 背景频率变化对数学模型的影响
Figure 7. The effect of background frequency changes on mathematical models
-
该节通过卷积方式得到的二阶导数信号仿真吸收谱线的二次谐波,通过改变Gauss/Lorentz比例关系仿真压强变化,建立Gauss/Lorentz拟合度之比于压强的数学模型,并对激光器线宽、噪声、背景干扰的影响进行分析。仿真结果表明,Gauss/Lorentz拟合度之比于压强存在三阶拟合关系,不受激光器线宽、噪声、背景干扰的影响,并且在拟合度相近的情况下,相比峰宽和2f/4f幅值表现出更好的抗噪声、背景干扰的能力于稳定性。
-
在25 ℃室温条件下,通过TLAS系统采集得到CO2气体在30、40、50、60、70、80、90、100、120、140、160、180、200、220、240 kPa时的数据,分别进行Gauss函数拟合和Lorentz函数拟合,其中50 kPa和180 kPa时的曲线如图8所示。

图 8 不同压强下的Gauss、Lorentz拟合曲线
Figure 8. Gauss fitting and Lorentz fitting curves under different pressures
由图8可知,随着压强的增加,曲线由接近Gauss函数拟合变为接近Lorentz函数拟合,与仿真结果和分析结果一致。
实验选取1 580 nm位置的CO2的吸收谱线。通过TLAS系统采集得到压强范围为30~240 kPa时对应的数据,对数据进行Gauss函数拟合以及Lorentz函数拟合,求出拟合度之比Y,实验结果如图9所示。
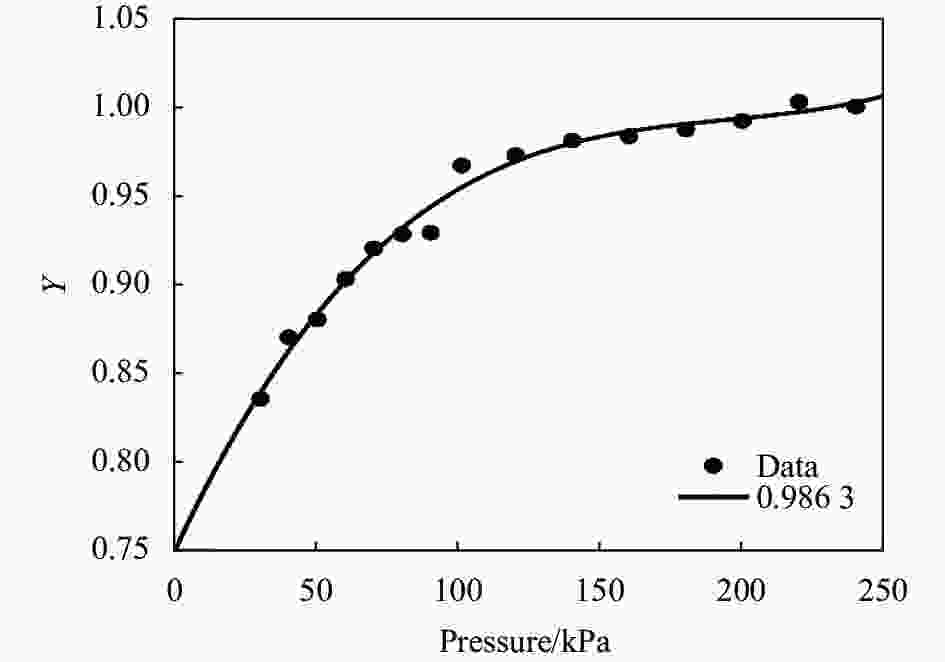
图 9 实测压强与Y的拟合曲线
Figure 9. The fitting curve of measured pressure and Y
由图9可知,气体检测实验的三阶拟合度为0.986 3,经过多次实验的平均拟合度均在0.985 0以上。因受到实际因素的影响导致略低于仿真值0.998 7,但拟合趋势一致,符合仿真分析结果。
-
为了建立更加有效的压强检测方法,基于谱线展宽原理,以Gauss函数半高宽和Lorentz函数半高宽比例关系模拟压强变化,用Voigt函数描述吸收谱线的线型。建立了理想情况、激光器线宽、白噪声、背景干扰下压强与拟合度之比Y的数学模型。通过仿真分析,压强与Y满足三阶拟合关系,不受激光器线宽、白噪声、背景干扰,且能在动态噪声、背景干扰下保持稳定,在压强检测方面优于传统模型。采用CO2吸收谱线进行实验验证,分析实验数据得到的曲线拟合度略低,但曲线拟合趋势一致,说明了建立的数学模型的有效性。文中方法在压强测量方面有一定的理论意义与使用价值,为压强检测提供了新思路。
Research on harmonic detection pressure inversion based on Gauss/Lorentz line fitting ratio (invited)
-
摘要: 调谐激光吸收光谱(TLAS)技术具有非接触、抗干扰、高灵敏度等优势,可对气体进行浓度、温度、压强的测量。目前已有的压强检测模型中多以谱线的有限特征点进行提取与计算,存在易受干扰、测量误差较大的问题,因而有必要建立新的抗干扰、稳定性强的压强检测模型。针对此问题,文中根据吸收线宽的气体压力测量方法,提出了低压与高压范围内压强与谱线线型拟合函数的数学模型。结合谱线展宽原理,对不同压强下的二次谐波吸收线进行仿真研究。通过改变Gauss线型函数和Lorentz线型函数的半高宽比例关系模拟压强变化,分析信号拟合度的变化趋势,仿真结果表明,在理想情况以及激光器线宽、白噪声、背景干扰影响下,Gauss/Lorentz线型拟合度之比与压强之间存在三阶拟合关系,拟合度均保持在0.998 0以上,且与传统模型相比在动态噪声和背景干扰下具有更好的稳定性。最后对CO2气体1 580 nm位置的实测信号进行处理,实验结果表明,实际检测谱线Gauss/Lorentz线型拟合度之比与压强之间的三阶拟合度为0.986 3,略低于仿真的拟合度0.998 7,符合仿真分析结果。文中提出的方法可以根据吸收谱线的拟合比曲线反演气体压强,为气体压强检测提供了解决方案。Abstract:
Objective Tuned laser absorption spectroscopy (TLAS) technology has advantages such as non-contact, anti-interference, and high sensitivity, which can be used for gas concentration, temperature, and pressure measurement. In the existing pressure detection models, limited feature points of spectral lines are mostly extracted and calculated, which can lead to problems such as susceptibility to interference in measurement results and significant measurement errors. Therefore, it is necessary to establish a new anti-interference and stable pressure detection model. To solve this problem, a mathematical model was proposed for fitting the pressure and spectral line shape function within the low and high pressure ranges based on the gas pressure measurement method of absorption line width. Methods Simulation research on the second harmonic absorption lines under different pressures was conducted based on the principle of spectral line broadening. In order to simulate the pressure changes by adjusting the Gauss/Lorentz halfwidth ratio, the second-order derivative signal was obtained by convolution of Gauss and Lorentz functions to simulate the second harmonic of the absorption spectral line. By establishing a mathematical model of the Gauss/Lorentz line fitting ratio and pressure, the fitting relationship between the two was obtained under ideal conditions and the influence of laser line width, white noise, and background interference. The comparative analysis on the stability of the fitting ratio with eigenvalues used to calculate pressure in existing models such as the peak width and 2f/4f amplitude under dynamic noise and background interference were conducted. Finally, the measured signal at 1 580 nm of CO2 gas was processed to verify the simulation results. Results and Discussions The simulation results show that under ideal conditions and the influence of laser linewidth, white noise, and background interference, there is a third-order fitting relationship between the Gauss/Lorentz line fitting ratio and pressure, and the fitting degree remains above 0.998 0 (Fig.3-6). Compared with traditional models, it has better stability under dynamic noise and background interference (Tab.1). The experimental results show that the third-order fit between the Gauss/Lorentz line fitting ratio of the actual detection spectral line and the pressure is 0.986 3 (Fig.9), slightly lower than the simulated fit of 0.998 7 (Fig.2), which is consistent with the simulation analysis results. Conclusions In order to establish a more effective pressure detection method, based on the principle of spectral line broadening, the pressure change is simulated using the ratio of Gauss function half width to Lorentz function half width, and the Voigt function is used to describe the absorption spectral line shape. A mathematical model was established for the pressure to fitting ratio under ideal conditions, laser linewidth, white noise, and background interference. Through simulation analysis, the relationship between pressure and fitting ratio satisfies a third-order fitting relationship, which is not only affected by laser linewidth, white noise, and background interference, but also maintain stability under dynamic noise and background interference, which exhibits advantages in pressure detection compared to traditional models. The experimental validation was carried out using CO2 absorption spectra. The curve fitting obtained from analyzing the experimental data was slightly lower, but its trend was consistent, which indicated the effectiveness of the established mathematical model. The proposed method has certain theoretical significance and practical value in pressure measurement, providing new ideas for pressure detection. -
图 1 仿真曲线:(a) Lorentz原函数占总峰宽比例5%;(b) Lorentz原函数占总峰宽比例95%
Figure 1. Simulation curve: (a) The original Lorentz function accounts for 5% of the total peak width; (b) The original Lorentz function accounts for 95% of the total peak width
图 3 加激光器线宽后压强与Y的曲线对比图
Figure 3. Curve comparison of pressure and Y after adding the laser linewidth
图 4 加不同幅值系数白噪声后压强与Y的曲线对比图
Figure 4. Curve comparison of pressure and Y after adding white noise with different amplitude coefficients
图 5 频率为信号频率的0.1倍时,加不同幅值背景干扰后压强与Y的曲线对比图
Figure 5. When the frequency is 0.1 times the signal frequency, the curve comparison of pressure and Y after adding background interference of different amplitudes
图 6 加不同频率的背景干扰后压强与Y的曲线对比图
Figure 6. Curve comparison of the pressure and Y after adding background interference of different frequencies
图 7 背景频率变化对数学模型的影响
Figure 7. The effect of background frequency changes on mathematical models
图 8 不同压强下的Gauss、Lorentz拟合曲线
Figure 8. Gauss fitting and Lorentz fitting curves under different pressures
表 1 同一谱线三种特征值在不同噪声与背景下的标准差
Table 1. The standard deviation of three eigenvalues of the same spectral line in different noise and background
Influencing factors Noise changes Background amplitude changes Background frequency changes The ratio of the fitting of Gauss and Lorentz 0.000 868 8 0.054 38 0.005 514 Peak width 0.011 28 0.168 9 0.071 97 Amplitude of 2f/4f 0.001 194 0.070 07 0.026 55  下载: 导出CSV
-
[1] 李哲, 张志荣, 孙鹏帅, 等. 利用TDLAS技术的多点甲烷气体全量程监测[J]. 红外与激光工程, 2017, 46(09): 243-249. doi: 10.3788/IRLA201746.0917009 Li Zhe, Zhang Zhirong, Sun Pengshuai, et al. Multi-point full range monitoring of methane based on TDLAS technology [J]. Infrared and Laser Engineering, 2017, 46(9): 0917009. (in Chinese) doi: 10.3788/IRLA201746.0917009 [2] 贾良权, 刘文清, 刘建国, 等. 温度和压强变化对二次谐波反演结果的影响[J]. 中国激光, 2014, 41(12): 266-273. doi: 10.3788/CJL201441.1215004 Jia Liangquan, Liu Wenqing, Liu Jianguo, et al. Effect of temperature and pressure changes on the second harmonic inversion results [J]. Chinese Journal of Lasers, 2014, 41(12): 15004. (in Chinese) doi: 10.3788/CJL201441.1215004 [3] 陈舟, 陶少华, 杜翔军, 等. 温度和压强的变化对谱线线型峰值的影响[J]. 光谱学与光谱分析, 2013, 33(02): 312-315. doi: 10.3964/j.issn.1000-0593(2013)02-0312-04 Chen Zhou, Tao Shaohua, Du Xiangjun, et al. Accurate calculation of spectral line profiles by considering influence of varying pressure and temperature in a gas [J]. Spectroscopy and Spectral Analysis, 2013, 33(2): 312-315. (in Chinese) doi: 10.3964/j.issn.1000-0593(2013)02-0312-04 [4] 李金义, 樊鸿清, 田鑫丽, 等. 大气环境条件下波长调制光谱无标测量的压强修正[J]. 光谱学与光谱分析, 2020, 40(05): 1407-1412. doi: 10.3964/j.issn.1000-0593(2020)05-1407-06 Li Jinyi, Fan Hongqing, Tian Xinli, et al. Pressure correction for calibration-free measurement of wavelength modulation spectroscopy in atmospheric environment [J]. Spectroscopy and Spectral Analysis, 2020, 40(5): 1407-1412. (in Chinese) doi: 10.3964/j.issn.1000-0593(2020)05-1407-06 [5] 吕晓静, 翁春生, 李宁. 高压环境下1.58μm波段CO2吸收光谱特性分析[J]. 物理学报, 2012, 61(23): 240-246. Lü Xiaojing, Weng Chunsheng, Li Ning. The analysis of CO2 absorption spectrum characteristics near 1.58 µm at high pressure [J]. Acta Phys Sin, 2012, 61(23): 240-246. (in Chinese) [6] 张博涵, 杨军, 魏伟, 等. 基于TDLAS直接吸收法的气体压力测量技术研究[J]. 计测技术, 2021, 41(05): 100-107. doi: 10.11823 j.issn.1674-5795.2021.05.11 Zhang Bohan, Yang Jun, Wei Wei, et al. Research on gas pressure measurement technology based on TDLAS direct absorption method [J]. Metrology and Measurement Technology, 2021, 41(5): 100-107. (in Chinese) doi: 10.11823j.issn.1674-5795.2021.05.11 [7] 段金虎, 金星, 王广宇, 等. 基于直接吸收光谱测量气体的压强[J]. 物理实验, 2016, 36(04): 7-11. doi: 1005-4642(2016)04-0007-05 Duan Jinhu, Jin Xing, Wang Gangyu, et al. Measuring gas pressure based on direct absorption spectroscopy [J]. Physics Experimentation, 2016, 36(4): 7-11. (in Chinese) doi: 10.19655/j.cnki.1005-4642.2016.04.002 [8] 屈东胜, 洪延姬, 王广宇, 等. 利用波长调制光谱技术测量高温环境中的气体压强、温度和H2O组分浓度[J]. 光谱学与光谱分析, 2017, 37(05): 1339-1344. doi: 10.3964/j.issn.1000-0593(2017)05-1339-06 Qu Dongsheng, Hong Yanji, Wang Guangyu, et al. Wavelength-modulation spectroscopy for measurements of gas pressure, temperature and H2O concentration in high-temperature environment [J]. Spectroscopy and Spectral Analysis, 2017, 37(5): 1339-1344. (in Chinese) doi: 10.3964/j.issn.1000-0593(2017)05-1339-06 [9] Cai Tingdong, Wang Guishi, Cao Zhensong, et al. Sensor for headspace pressure and H2O concentration measurements in closed vials by tunable diode laser absorption spectroscopy [J]. Optics and Lasers in Engineering, 2014, 58: 48-53. doi: 10.1016/j.optlaseng.2013.12.005 [10] Sur Ritobrata, Sun Kai, Jeffries Jay B, et al. Scanned-wavelength-modulation-spectroscopy sensor for CO, CO2, CH4 and H2O in a high-pressure engineering-scale transport-reactor coal gasifier [J]. Fuel, 2015, 150: 102-111. doi: 10.1016/j.fuel.2015.02.003 [11] 曹亚南, 王贵师, 谈图, 等. 基于可调谐二极管激光吸收光谱技术的密闭玻璃容器中水汽浓度及压力的探测[J]. 物理学报, 2016, 65(08): 134-139. doi: 10.7498/aps.65.084202 Cao Yanan, Wang Guishi, Tan Tu, et al. Concentration and pressure measurement of water vapor in sealed glass containers based on tunable diode laser absorption spectroscopy [J]. Acta Phys Sin, 2016, 65(8): 134-139. (in Chinese) doi: 10.7498/aps.65.084202 [12] 李恒宽, 朴亨, 王鹏, 等. 基于近红外吸收光谱技术的高精度CO2检测系统的研制[J]. 红外与激光工程, 2023, 52(03): 115-121. doi: 10.3788/IRLA20210828 Li Hengkuan, Piao Heng, Wang Peng, et al. Development of high precision CO2 detection system based on near infrared absorption spectroscopy [J]. Infrared and Laser Engineering, 2023, 52(3): 20210828. (in Chinese) doi: 10.3788/IRLA20210828 [13] 吕文静, 李红莲, 李文铎, 等. TDLAS技术调制参量的优化及实验研究[J]. 激光技术, 2021, 45(03): 336-343. doi: 10.7510/jgjs.issn.1001-3806.2021.03.013 Lü Wenjing, Li Honglian, Li Wenduo, et al. Optimization and experimental research on modulation parameters of TDLAS technology [J]. Laser Technology, 2021, 45(3): 336-343. (in Chinese) doi: 10.7510/jgjs.issn.1001-3806.2021.03.013 [14] 禹迎春, 王晗, 王志敏, 等. 基于QCL-TDLAS的NH3浓度测量仿真研究[J]. 应用光学, 2020, 41(06): 1255-1261. doi: 10.5768/JAO202041.0603006 Yu Yingchun, Wang Han, Wang Zhimin, et al. Simulation study of NH3 concentration measurement based on QCL-TDLAS [J]. Journal of Applied Optics, 2020, 41(6): 0603006. (in Chinese) doi: 10.5768/JAO202041.0603006 [15] 赵成龙, 黄丹飞, 刘智颖, 等. 开放型TDLAS-WMS技术CO2痕量气体检测[J]. 光子学报, 2022, 51(02): 333-342. doi: 10.3788/gzxb20225102.0230001 Zhao Chenglong, Huang Danfei, Liu Zhiying, et al. Measurement of trace CO2 concentration with open-path TDLAS-WMS technology [J]. Acta Photonica Sinica, 2022, 51(2): 0230001. (in Chinese) doi: 10.3788/gzxb20225102.0230001 [16] 云玉新, 吕天光, 韩洪, 等. 气体红外吸收特性受压强与温度的影响分析[J]. 红外与激光工程, 2011, 40(06): 992-996. Yun Yuxin, Lv Tianguang, Han Hong, et al. Effects of pressure and temperature on gaseous infrared absorption properties [J]. Infrared and Laser Engineering, 2011, 40(6): 992-996. (in Chinese) [17] Spearrin R M, Schultz I A, Jeffries J B, et al. Laser absorption of nitric oxide for thermometry in high-enthalpy air [J]. Measurement Science and Technology, 2014, 25(12): 125103. doi: 10.1088/0957-0233/25/12/125103 [18] Goldenstein Christopher S, Jeffries Jay B, Hanson, Ronald K. Diode laser measurements of linestrength and temperature-dependent lineshape parameters of H2O-, CO2-, and N-2-perturbed H2O transitions near 2 474 and 2 482 nm [J]. Journal of Quantitative Spectroscopy & Radiative Transfer, 2013, 130: 100-111. doi: 10.1016/j.jqsrt.2013.06.008 -

 点击查看大图

计量
- 文章访问数: 73
- HTML全文浏览量: 15
- PDF下载量: 26
- 被引次数: 0

