


-
武装直升机在现代海、陆、空立体化战争中具有重要的纽带地位,具有攻击目标种类多、机动性强、隐蔽性好和火力覆盖面广的特点[1-2]。随着红外探测技术的发展,武装直升机受红外制导武器的威胁日益加剧。排气系统是武装直升机最主要的红外辐射发射源,包括机身外蒙皮、排气尾焰以及其他可视高温壁面[3-4]。为武装直升机排气系统加装红外抑制器是目前广泛采用的红外抑制手段,可以有效降低3~5 μm和8~14 μm波段的红外辐射强度[5-6]。一体化红外抑制器借助波瓣构型利用排气动能引射环境冷气实现混合降温,并充分利用直升机旋翼下洗气流降低红外辐射,其弯曲设计的混合管构型及机身外蒙皮也实现了对排气内腔高温部件的遮挡[7]。如科曼奇RAH-66隐身侦察武装直升机采用了与抑制器一体化设计的红外抑制器,冷气通过上方进气口吸入,与发动机排气混合后经抑制器下腹的狭长缝隙排出,再经旋翼下洗气流吹散,使排气温度和可视壁面温度明显降低,从而提高武装直升机的红外隐身性能[8]。在此基础上,国内外学者从提升引射冷气量,强化热掺混效率,遮挡机身内部高温部件等方面对一体化红外抑制器展开了一系列研究[9-11],旨在保证武装直升机具有良好气动性能的同时有效降低排气系统的红外辐射强度。Presz和Werle提出了多级引射的概念,研究表明,在小面积比的排气出口布设波瓣具有短程、高效掺混的优点[12]。任利锋等[13]发现混合管出口采用对排波瓣较同排波瓣更利于排气的强化混合。陈庚等[14]的研究表明,混合管出口采用波瓣型面相比采用矩形型面的二元混合管整体引射性能最大提高了19.2%,混合管壁温也显著降低,证明了排气出口段采用二级引射结构的有效性。郑禛等[15]发现增大混合管出入口面积比可以提高混合管引射系数和总压恢复系数,但会降低热混合效率;采用波瓣出口可以显著提升进入机身内下洗气流流量以及模型的热混合效率,但会降低总压恢复系数。蒋坤宏等[16]提出对弯曲混合管加装遮挡罩可有效降低外壁面最高温度及其红外辐射强度峰值。
以上研究表明,抑制器混合管排气出口采用波瓣构型不仅可以有效遮挡混合管高温内腔,还能引射抑制器内的旋翼下洗气流,强化排气与冷气的掺混,从而降低排气的红外辐射强度。但是以往的研究工作未曾考虑直升机的前飞来流与抑制器排气的相互作用,前飞时的三股流耦合(前飞来流、排气流和旋翼下洗气流)与悬停时的两股流耦合(排气流和旋翼下洗气流)所表现出的流动、混合特征差异。
就此,文中在模型实验的验证下,仿真分析了不同前飞来流速度下排气出流方向对混合管排气特性的影响;同时,针对抑制器顶、底部难以解决的红外辐射抑制问题,采取了在红外抑制器下洗气流进口加装弯曲型导流片和在分布式排气波瓣的下游加装辐射遮挡隔板的方法,以降低抑制器顶、底部红外辐射强度,并探讨了可视壁面的温度分布和抑制器红外辐射强度的分布,为直升机排气系统的全方位隐身优化设计提供应用基础。
-
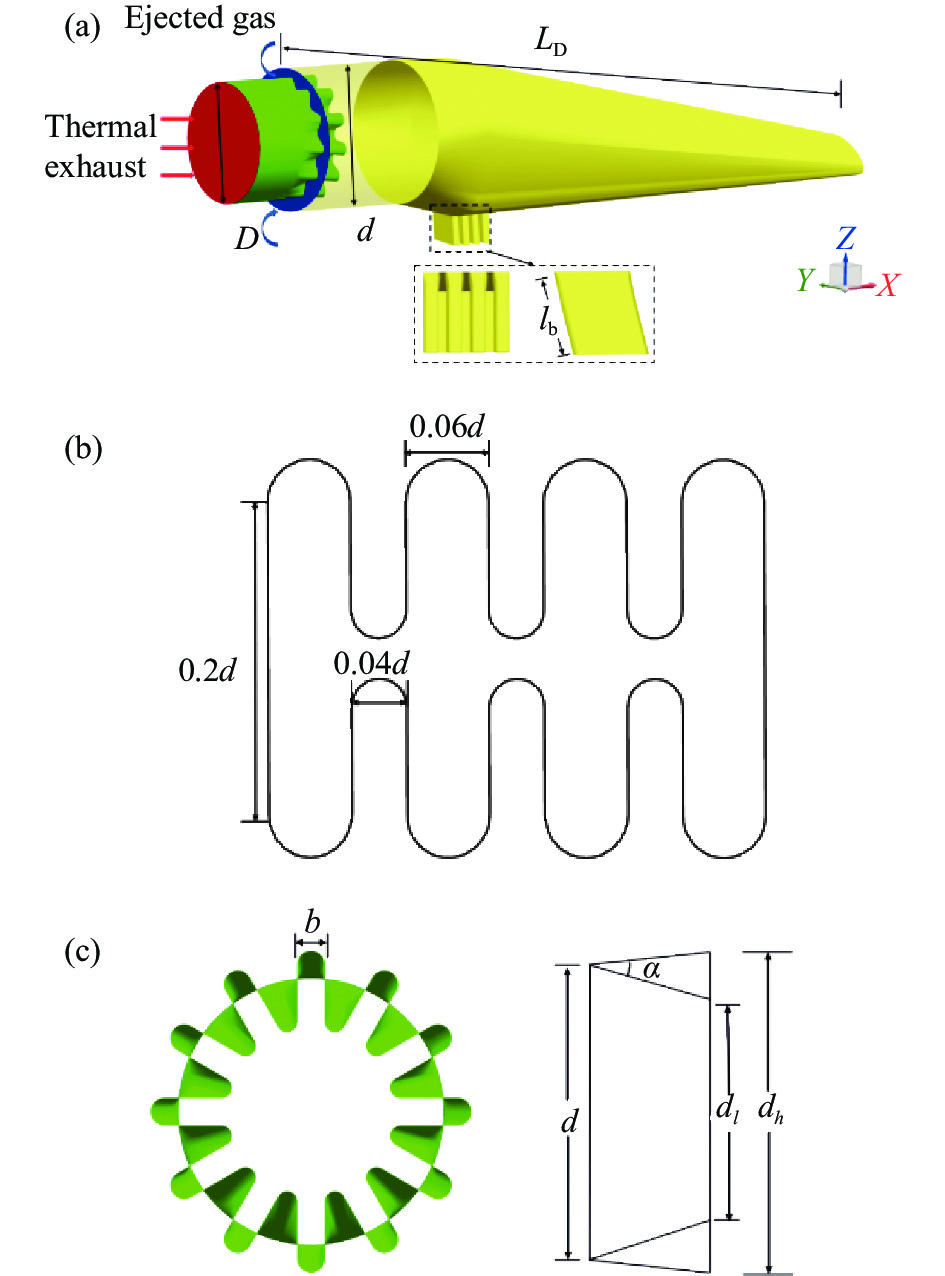
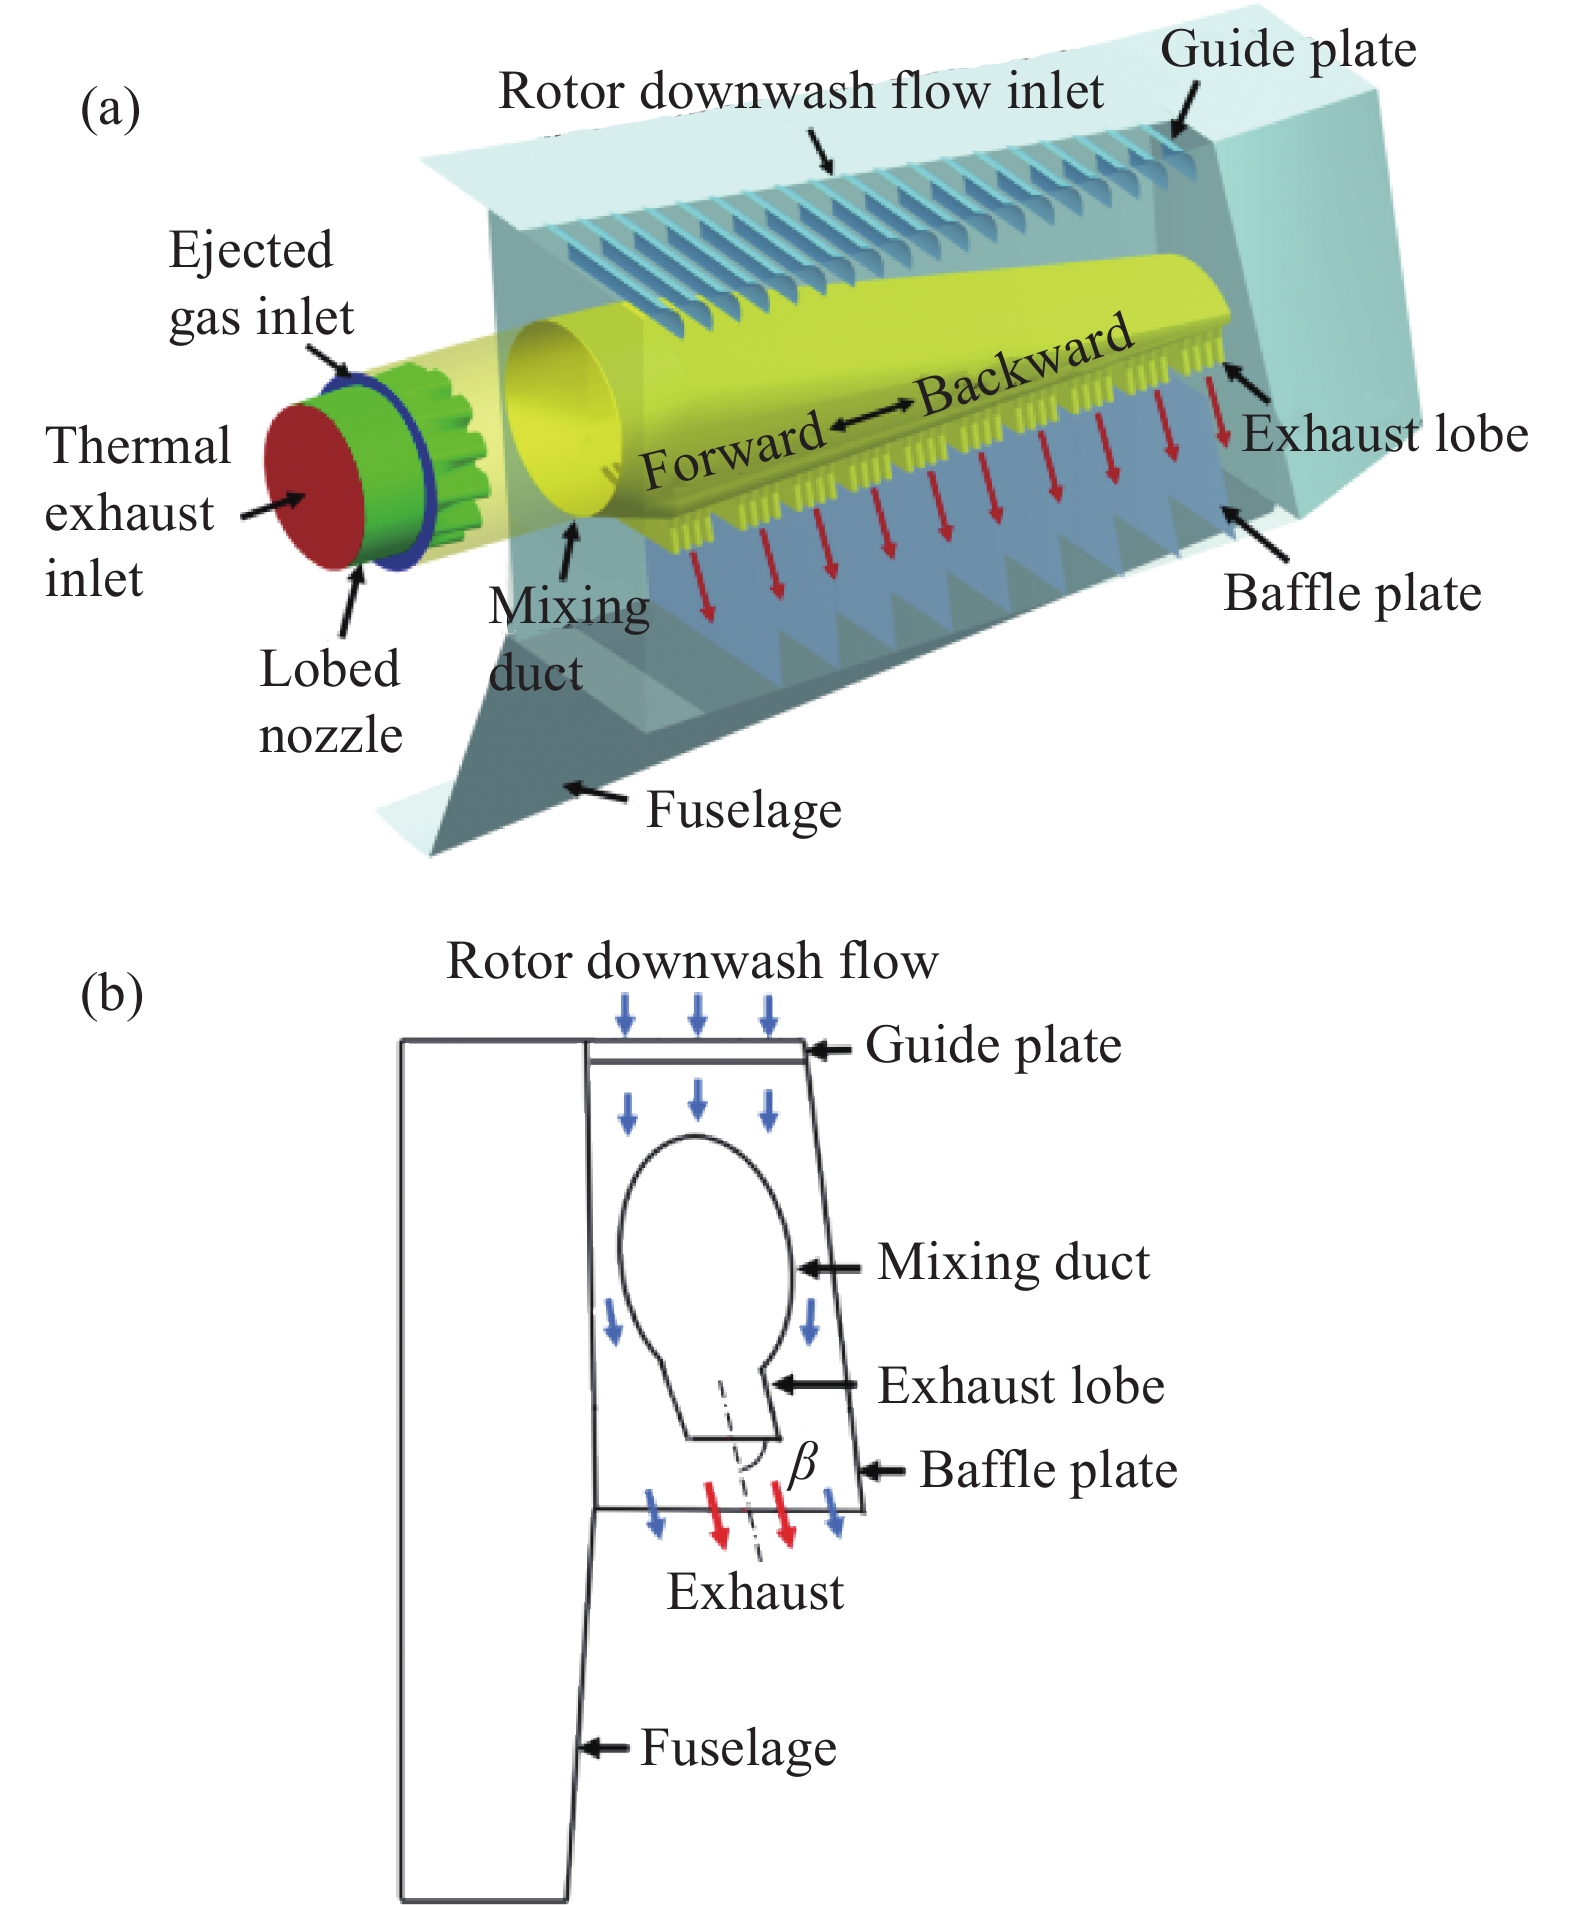
图1(a)是与抑制器一体化设计的红外抑制器结构示意图,抑制器由波瓣喷管、弯曲混合管、10个分布式排气波瓣(沿混合管轴向由前至后分别命名为1~10号排气波瓣)、下洗气流进口导流片和排气下游隔板等组成。排气波瓣的侧向排气偏转角β约为80°,见图1(b)。发动机涡轮后的热排气经波瓣喷管进入弯曲混合管中,利用排气动能引射环境冷气形成一级引射,旋翼下洗气流经导流片从抑制器顶部入口流入抑制器舱内对混合管进行冷却,混合管内经掺混后的热气在流出排气波瓣时再次抽吸抑制器内部的下洗气流形成二级引射,再经抑制器侧面排气出口排出。

图 1 (a) 一体化红外抑制器组成;(b) 抑制器内部横截面流动
Figure 1. (a) Infrared-suppressor-integrated composition; (b) Internal cross-sectional flow of suppressor
图2显示了排气系统的部分组成。如图2(a),混合管进口直径d为200 mm,轴向长度LD为10d。排气波瓣的波瓣长度lb均为0.35d,出口截面参数见图2(b)。主喷管采用进口直径D为0.8d的波瓣喷管,12个波瓣沿径向均匀排布,瓣宽b为0.1d,波瓣径向扩张角α为23°,出口处波谷直径dl为0.6d,波峰直径dh为0.9d,如图2(c)所示。

图 2 (a) 排气系统部分结构;(b) 排气波瓣出口截面;(c) 引射波瓣参数
Figure 2. (a) Local schematic of exhaust system structure; (b) Exhaust lobe outlet section; (c) Ejector lobe parameters
在混合管结构参数和10个排气波瓣出口面积不变的基础上,文中改变混合管10个排气波瓣的后向排气偏转角γ,排气下游隔板的倾斜角度与之保持一致,如图3(a)所示,将γ为90°、75°、60°和45°的一体化红外抑制器模型分别记为模型A、B、C和D。
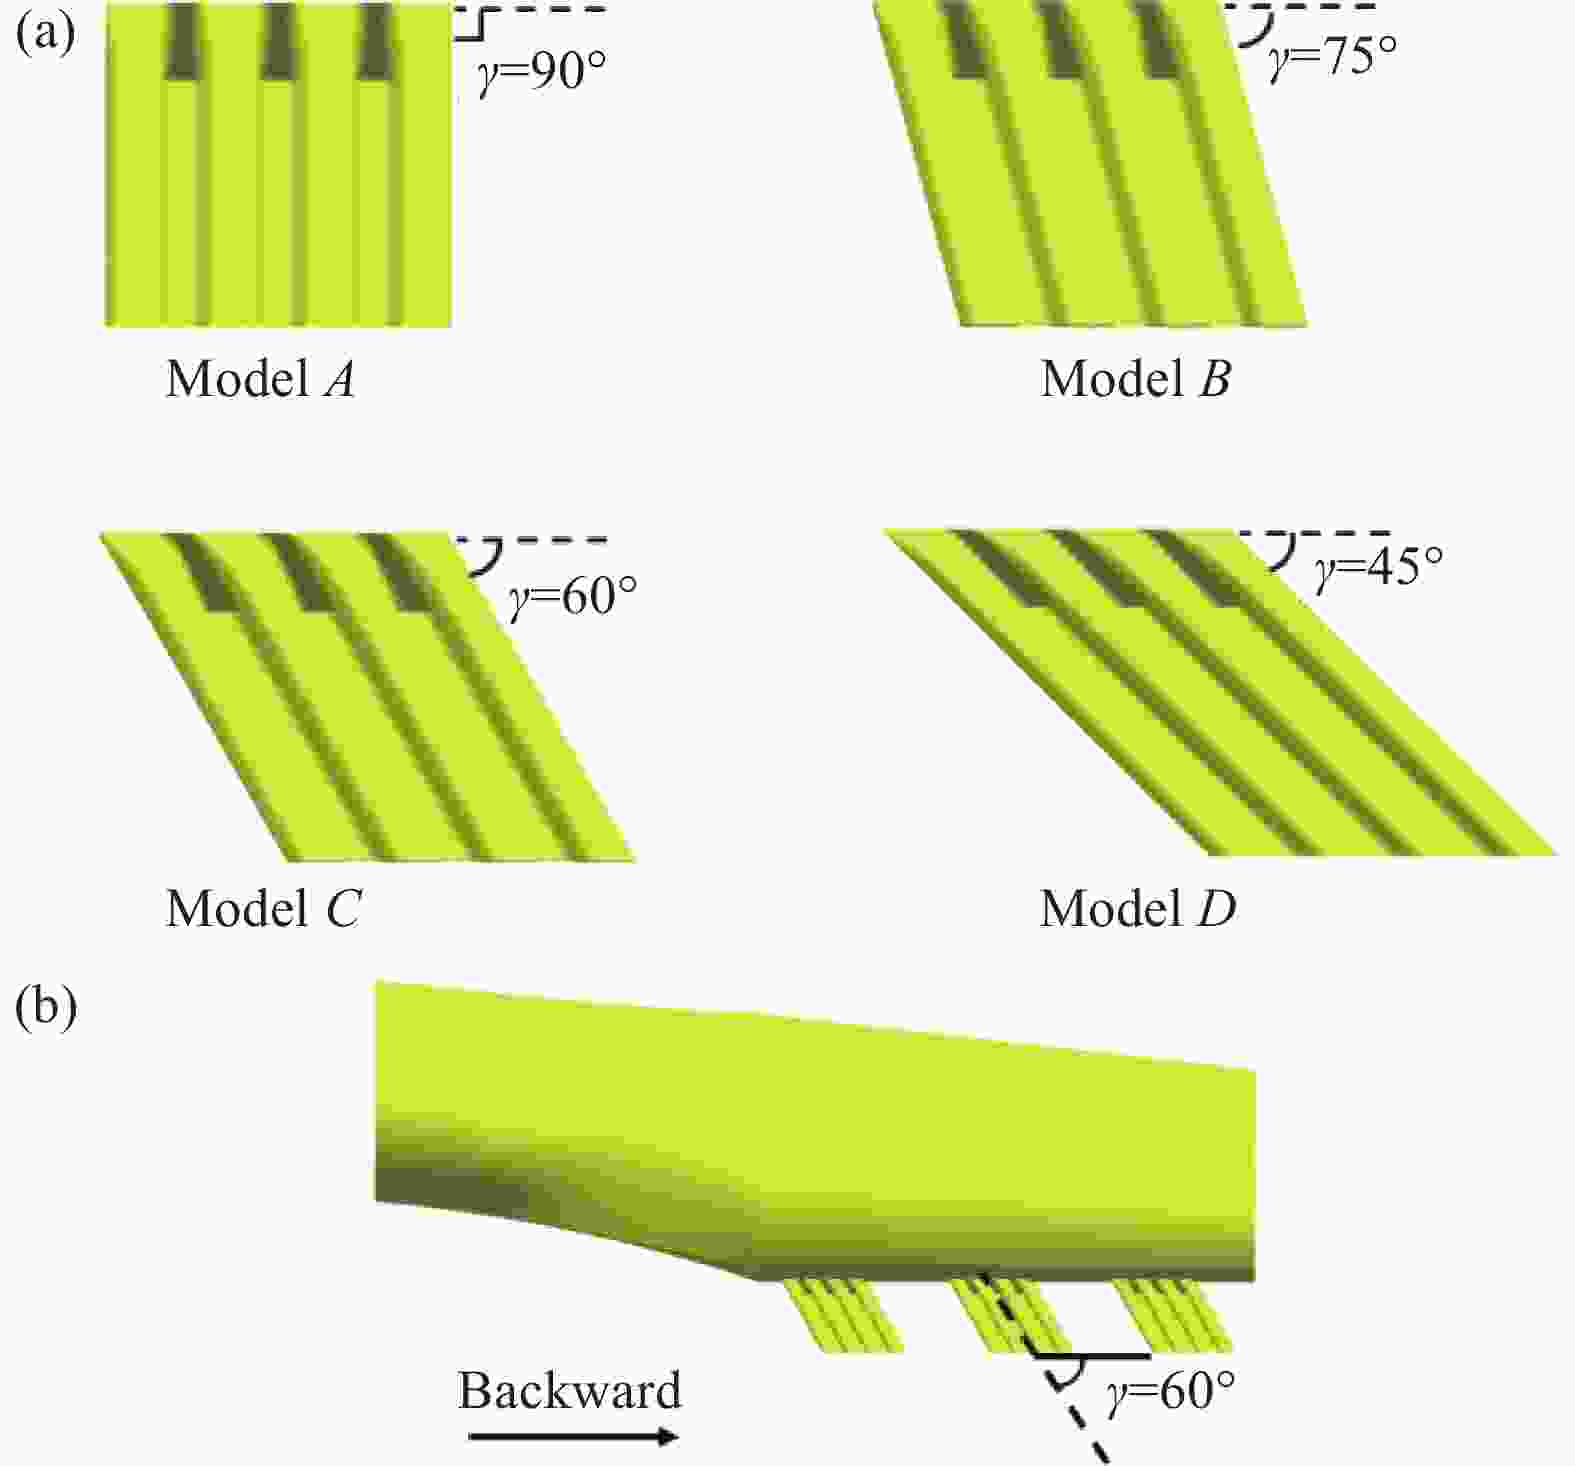
图 3 (a) 排气波瓣角度示意;(b) 混合管和带偏转角的波瓣局部示意图
Figure 3. (a) Exhaust lobe angle diagram; (b) Local schematic of mixing duct and lobes with deflection angle
-
考虑到地面模型实验和有前飞来流时边界条件的差异性,故分别建立计算域和给定计算边界。
针对地面模型实验进行数值模拟,结合实际实验环境,在模型外侧选取足够大的区域作为外场,如图4所示,其外场长、宽、高分别为:Le=18 m,We=10 m,He=6 m,外场边界设置为压力出口,压力为标准大气压101 325 Pa,温度为环境温度297 K。其中,底部为地面,将其视为朗伯体,反射率为0.25。与实验一致,构建了图4所示的模拟旋翼下洗气流,实验中,下洗气流由鼓风机提供,矩形出口长和宽分别为1.3 m和0.3 m。

图 4 地面实验时计算域示意图
Figure 4. Schematic of the computational domain in ground experiment
针对有模拟前飞来流时进行数值仿真,假定飞行高度500 m,计算域如图5所示,其外场长、宽、高分别为:L0=11 m,W0=7.2 m,H0=8.4 m。在模型上方设置矩形下洗气流进口面,长、宽分别为2.0、0.7 m,可完全覆盖抑制器的下洗气流进口,采用速度进口边界,设置速度为20 m/s。模拟前飞来流进口面设为速度进口,其余外场边界设置为压力出口,压力为95461 Pa,温度为环境温度285 K。

图 5 有模拟前飞来流时计算域示意图
Figure 5. Schematic of the computational domain with forward flow
鉴于抑制器及其内部结构不规则,在靠近抑制器的流场采用非结构化网格,而外流场较大,采用结构化网格以节省网格数量。在波瓣喷管和排气波瓣等位置进行局部网格加密处理。为了保证计算结果与网格数量无关,进行了多套网格分析,如表1所示,确定地面模型实验时计算域网格数约为1400万。有模拟前飞来流时计算域网格数约为1600万。
表 1 不同网格数下地面实验和有前飞来流时波瓣喷管的引射系数
Table 1. Ejection coefficient of lobed nozzle in ground experiment and with simulated forward flow under different grid numbers
Grid number (million) In Ground experiment With simulated forward flow 8 0.046 0.175 10 0.048 0.175 12 0.048 0.177 14 0.049 0.178 16 0.049 0.179 18 0.049 0.179 -
数值模拟时,设定的排气主流进口流量和温度与实验时保持一致,即0.5 kg/s和873 K。假设发动机排气完全燃烧,燃气中的氮气、二氧化碳和水蒸气质量占比分别为0.706、0.209和0.085,由于排气速度低,故设置为不可压理想气体。引射气流来自外界环境,组成成分为氮气和氧气,质量占比分别为0.756和0.244,引射气流入口设置为压力进口边界。固体壁面采用流体无滑移的流固耦合面,计算时考虑壁面的对流与辐射换热,需要说明的是,对抑制器红外辐射强度进行计算时,铝制壁面(如抑制器蒙皮)处于3~5 μm波段和8~14 μm波段的红外发射率不同,3~5 μm波段发射率设为0.6,8~14 μm波段发射率设为0.2,不锈钢制壁面(如混合管和排气波瓣)在3~5 μm波段和8~14 μm波段的发射率均设为0.25。湍流模型选用SST (Shear stress transfer)k-ω两方程模型[17]。启用组分输运方程以获得不同组分流体掺混后的空间分布特性,流动传热与组分输运方程中对流项和扩散项采用二阶迎风差分格式离散,压力与速度耦合采用SIMPLEC算法,使用离散坐标辐射模型(DO模型)求解辐射换热。
使用正反射线追踪法[18]计算抑制器模型3~5 μm和8~14 μm的红外辐射强度值。图6显示了探测点的分布位置,地面实验模拟中的探测点位于横截面0°方向40 m处,有前飞来流模拟中探测点分布于横截面和纵截面与模型距离200 m处。计算中忽略大气传输的影响,计算值反映了目标本身的红外辐射特性。

图 6 探测点分布位置
Figure 6. Distribution of detection positions
-
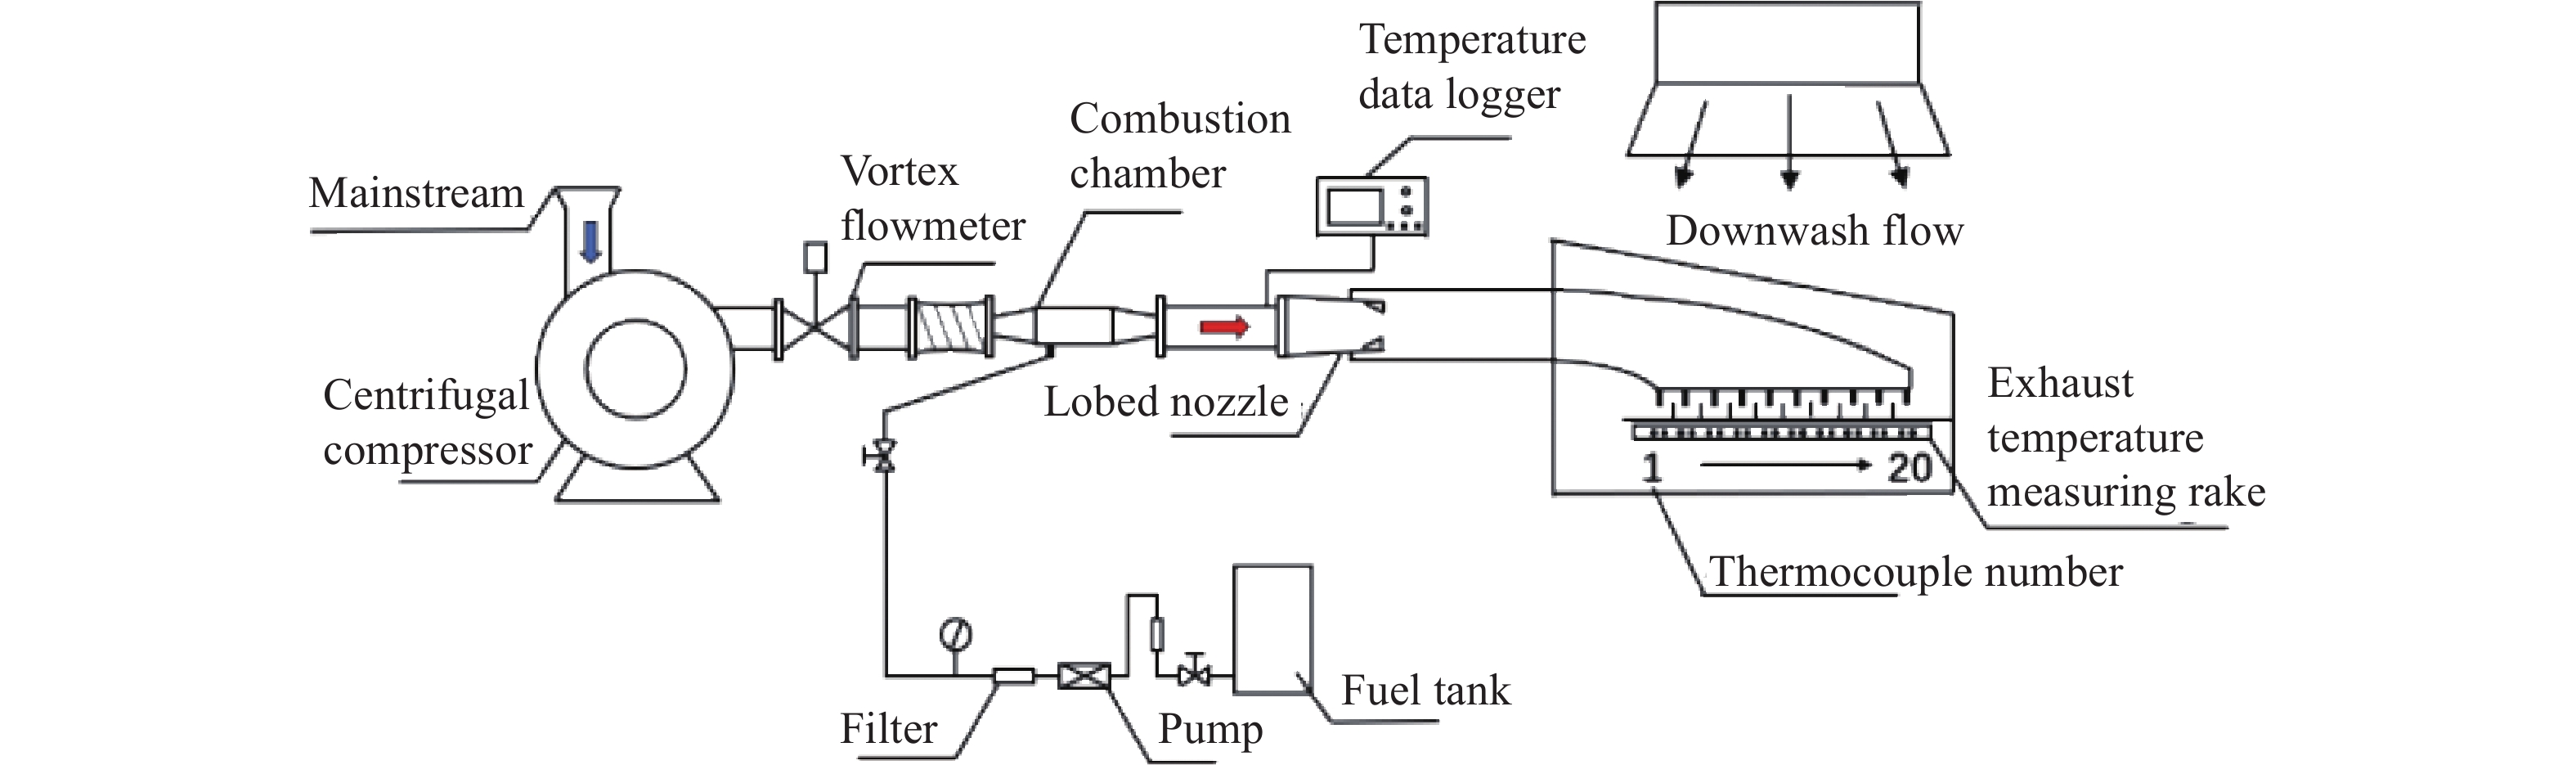
实验系统由主流气路系统、下洗流气路系统、燃油系统、一体化红外抑制器模型实验件和温度、压力测试系统组成,如图7所示,由离心式压气机提供的主流进入单管燃烧室,经旋流器与燃油系统泵入的航空煤油混合雾化,再由火花塞放电点燃后形成高温燃气,流入燃烧室的整流稳定段;燃气在稳定段中混合均匀后进入波瓣喷管,稳定段管道上布设有热电偶,用于测量波瓣喷管进口温度;在主流流量一定时,可以通过调节燃油量来控制主流温度;旋翼下洗气流使用低压鼓风机模拟,方向向下吹向抑制器。

图 7 实验系统示意图
Figure 7. Schematic diagram of experimental system
实验共布置了两组热电偶,分别测量排气温度和混合管外侧壁面温度,通过多路温度测试仪采集温度:混合管外侧壁面热电偶共布设10个,在各排气波瓣上缘约3 cm处;测量排气温度的热电偶共20个,每个排气波瓣下游均有2个热电偶。
-
图8展示了主流温度873 K、流量0.5 kg/s,下洗气流速度0 m/s和20 m/s时混合管外侧壁面各测点温度的实验值和仿真值的对比。温度的不确定度与热电偶测温的不确定度和温度数据采集装置的不确定度相关。实验用k分度热电偶在20~600 ℃温度范围内测温不确定度为±0.73%;温度采集装置的不确定度在±0.12%以内。合成不确定度为±0.74%。随着探测点位置的后移,混合管外侧壁面温度逐渐减小。壁面温度的仿真计算结果与实验数据最大差距不超过6%,误差主要来自于模型加工、热电偶测量等。壁面温度数值计算结果和实验测量结果的分布规律较为吻合。

图 8 实验测量与仿真计算的混合管外侧壁面轴向测点温度分布
Figure 8. Experimental measurement and numerical simulation of axial temperature distribution on external wall of mixing duct
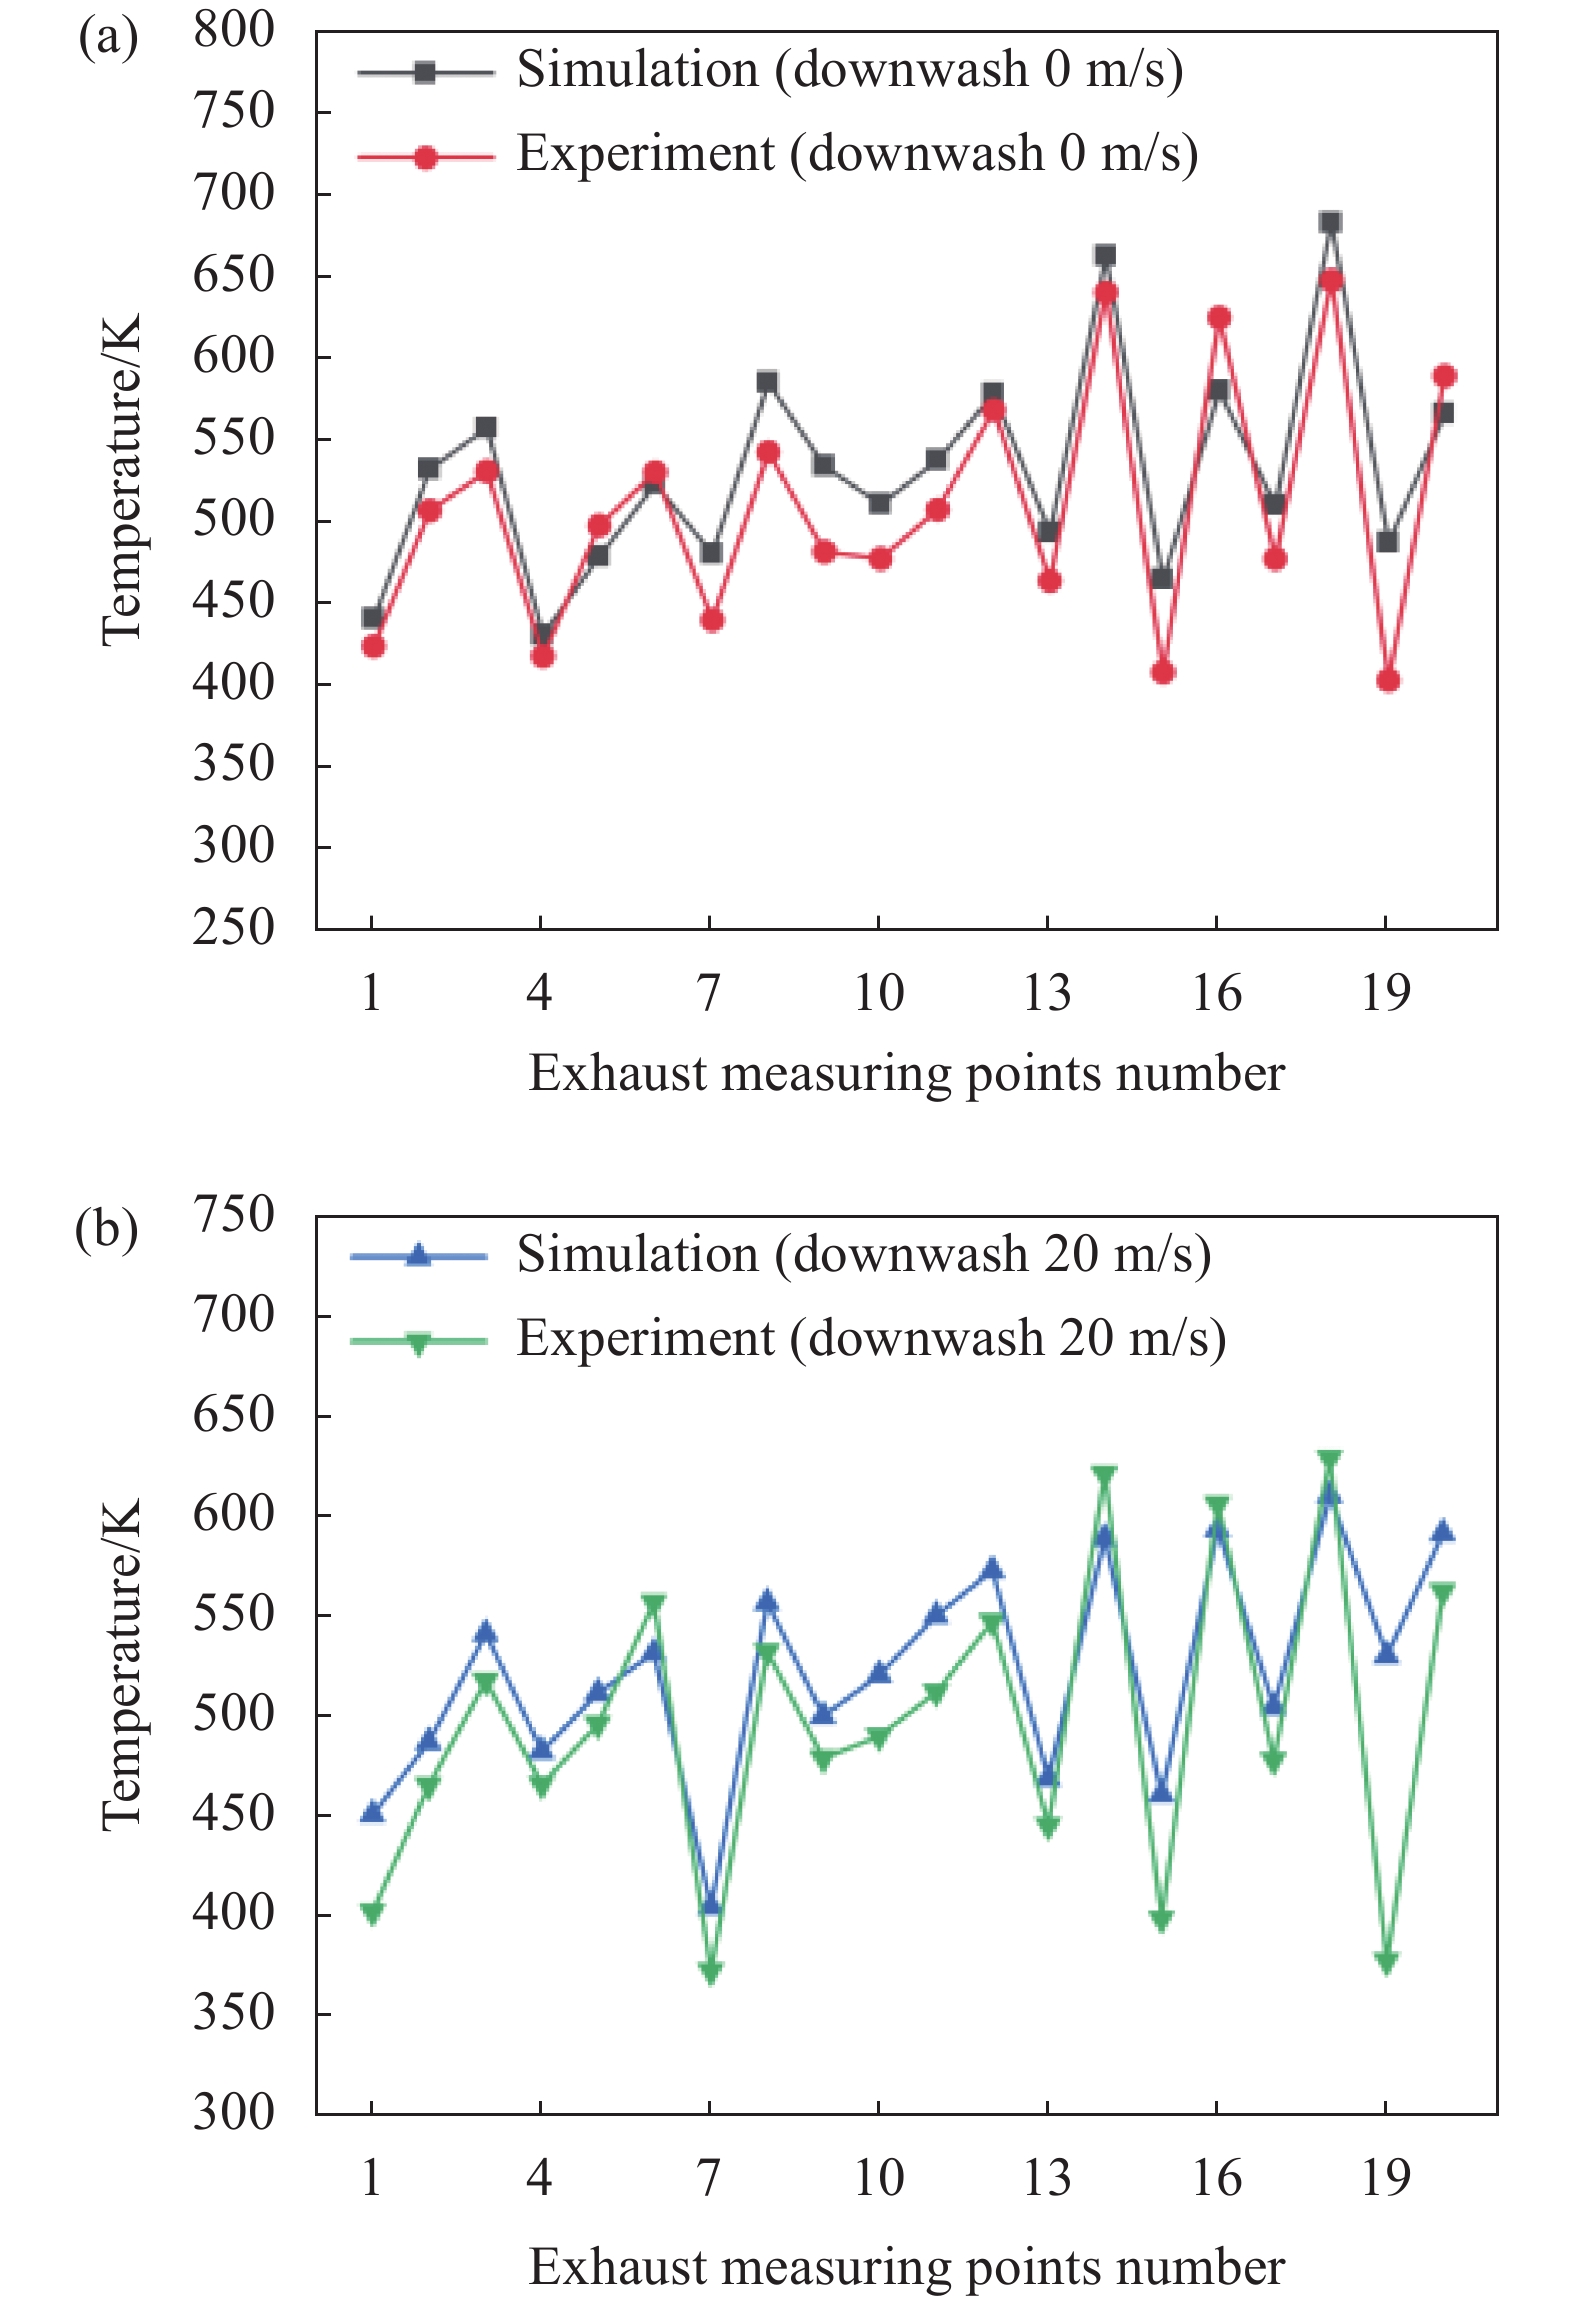
图9为主流温度873 K、流量0.5 kg/s,下洗气流速度0 m/s和20 m/s时排气温度实验值和仿真值的对比。加入下洗气流后,在同一测点位置排气温度降低,个别测点温度升高是下洗气流吹散排气所致。仿真值取排气波瓣出口下游12 cm截面位置温度,各排气波瓣下游处,冷气均包裹着热气从抑制器侧面排气出口流出,排气核心区温度高,靠近隔板处的气流温度低,在排气方向的横截面上温度梯度大,而测点温度由其与热排气核心高温区的相对位置决定,所以排气温度无明显规律,相邻的测点间温度差异也较大,剔除个别误差大的测点,排气温度数值模拟结果与实验结果的误差基本不超过10%。

图 9 (a) 下洗气流速度0 m/s时排气温度;(b) 下洗气流速度20 m/s时排气温度
Figure 9. (a) Exhaust temperature (downwash flow 0 m/s); (b) Exhaust temperature (downwash flow 20 m/s)
表2给出了横截面0°方向一体化红外抑制器红外辐射强度仿真值和实验值的对比。实验中使用VSR红外光谱辐射计测量抑制器红外辐射光谱,光谱积分后的辐射强度不确定度与仪器的时间漂移误差、被积波段长度、校准源的发射率、温度误差和视场面积有关[19]。光谱辐射计工作不稳定性导致的时间漂移误差在30 min内可以忽略不计,而文中实验中单个测试所需时间为15 min左右。文中采用的校准源为标定用黑体,其发射率为0.98±0.01,温度误差为±0.1 ℃,根据实验测试时辐射计的视距推算得到视场面积约为7 m2,根据文献[19]中的计算方法,计算出3~5 μm和8~14 μm波段,辐射强度测量的不确定度分别为±3%和±5%。实验测得的红外辐射强度较数值计算结果高,可能是在下洗气流和高温排气的共同作用下,光谱辐射计视场内实验件支架温度上升所致。对比数值计算结果与实验结果可知,3~5 μm和8~14 μm波段的红外辐射强度仿真值与实验值误差分别在9%和6%以内,所采用的红外辐射计算方法具有可信度和一定的预测精度。
表 2 横截面0°方向实验测量和仿真计算的红外辐射强度
Table 2. Experimental measurement and numerical simulation of infrared radiation intensity in cross-sectional direction at 0° angle
Status 3-5 μm/
W·sr−18-14 μm/
W·sr−1Experiment
(downwash 0 m/s)5.2 33.6 Experiment
(downwash 20 m/s)4.0 30.9 Simulation
(downwash 0 m/s)5.0 32.5 Simulation
(downwash 20 m/s)3.7 29.3 综合以上结果可知,实验与数值模拟结果的误差满足工程计算需求,文中对于气体流动和红外辐射的计算方法是合理可行的。
-
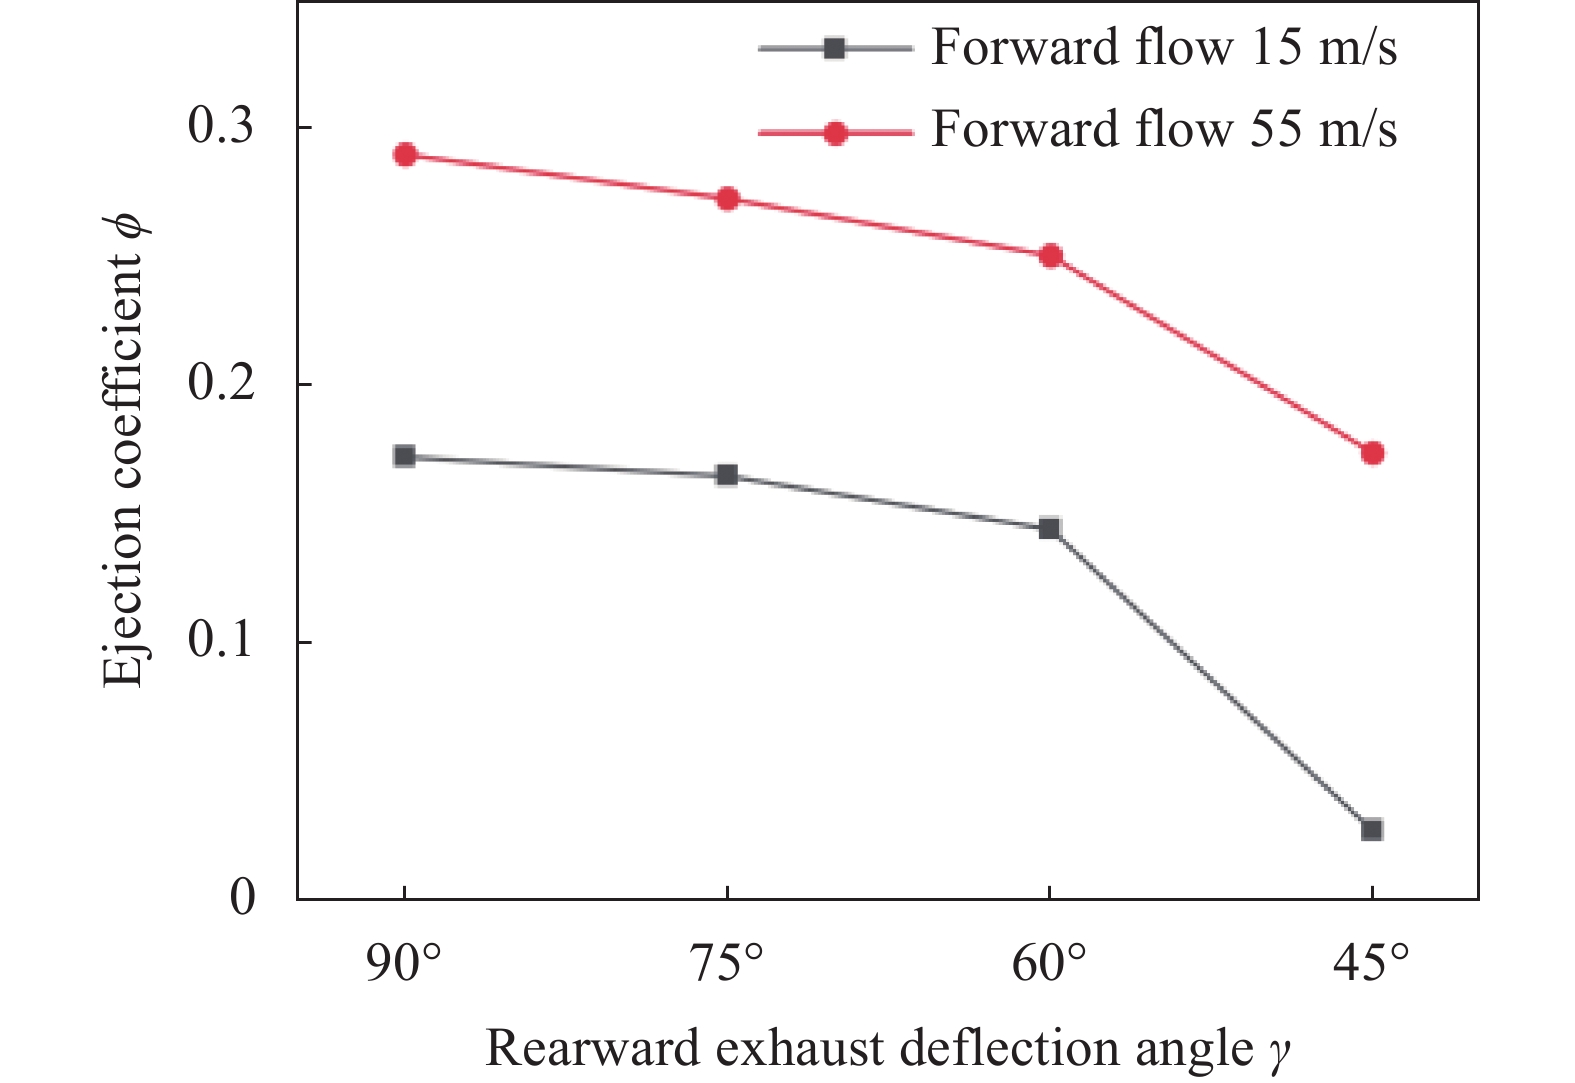
衡量混合管气动性能的参数主要有引射系数和总压恢复系数等。引射系数是波瓣喷管引射冷却次流质量流量和热排气主流质量流量之比,其定义为:
$$ \varPhi =\frac{{m}_{se}}{{m}_{in}} $$ (1) 式中:$ {m}_{se} $为引射次流的质量流量;$ {m}_{in} $为排气主流质量流量,单位均为kg/s。
在不同前飞来流速度下各模型的引射系数变化见图10。结果表明:γ一定时,随着前飞来流速度的提高,引射系数明显上升。前飞来流速度一定,γ减小时,引射系数呈现下降趋势,这是因为尽管排气波瓣出口面积不变,但流通面积较模型A有所减小,导致混合管内流动受阻,降低了引射能力。在前飞来流速度较低时引射系数下降更为显著:前飞来流速度为55 m/s时,模型D的引射系数为模型A的60%,前飞来流速度为15 m/s时,模型D的引射系数仅为模型A的16%。
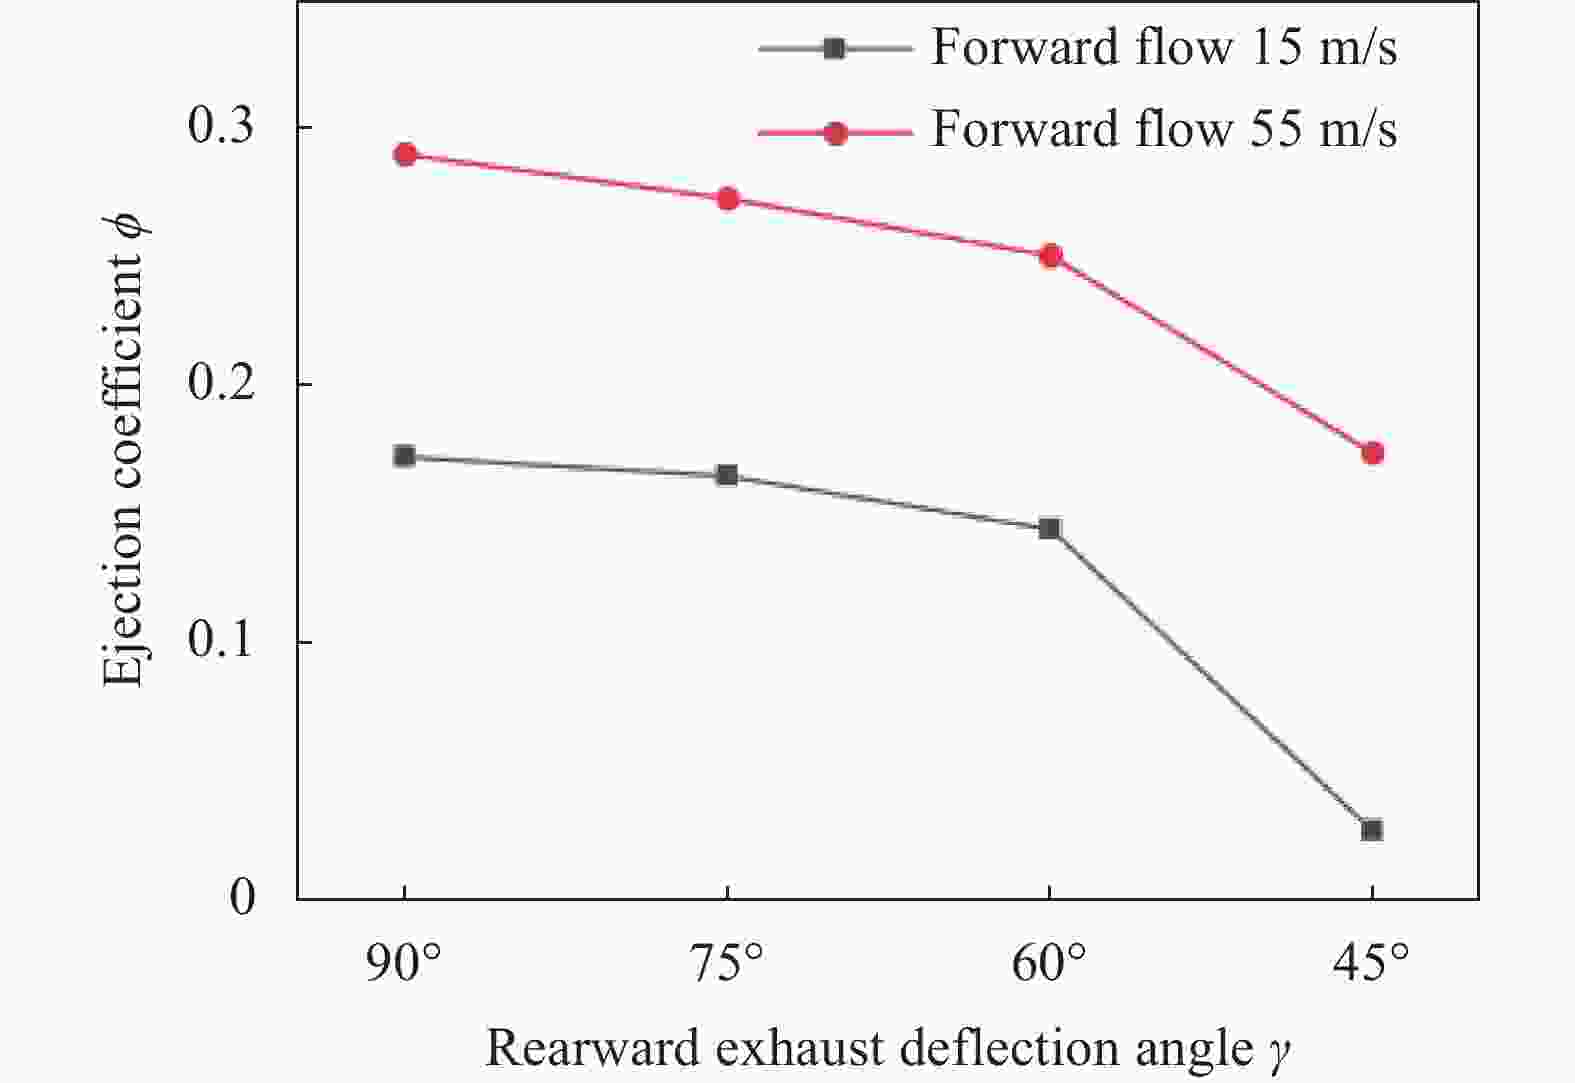
图 10 不同前飞来流速度下各模型的引射系数
Figure 10. Ejection coefficient under different forward flow velocities of modes
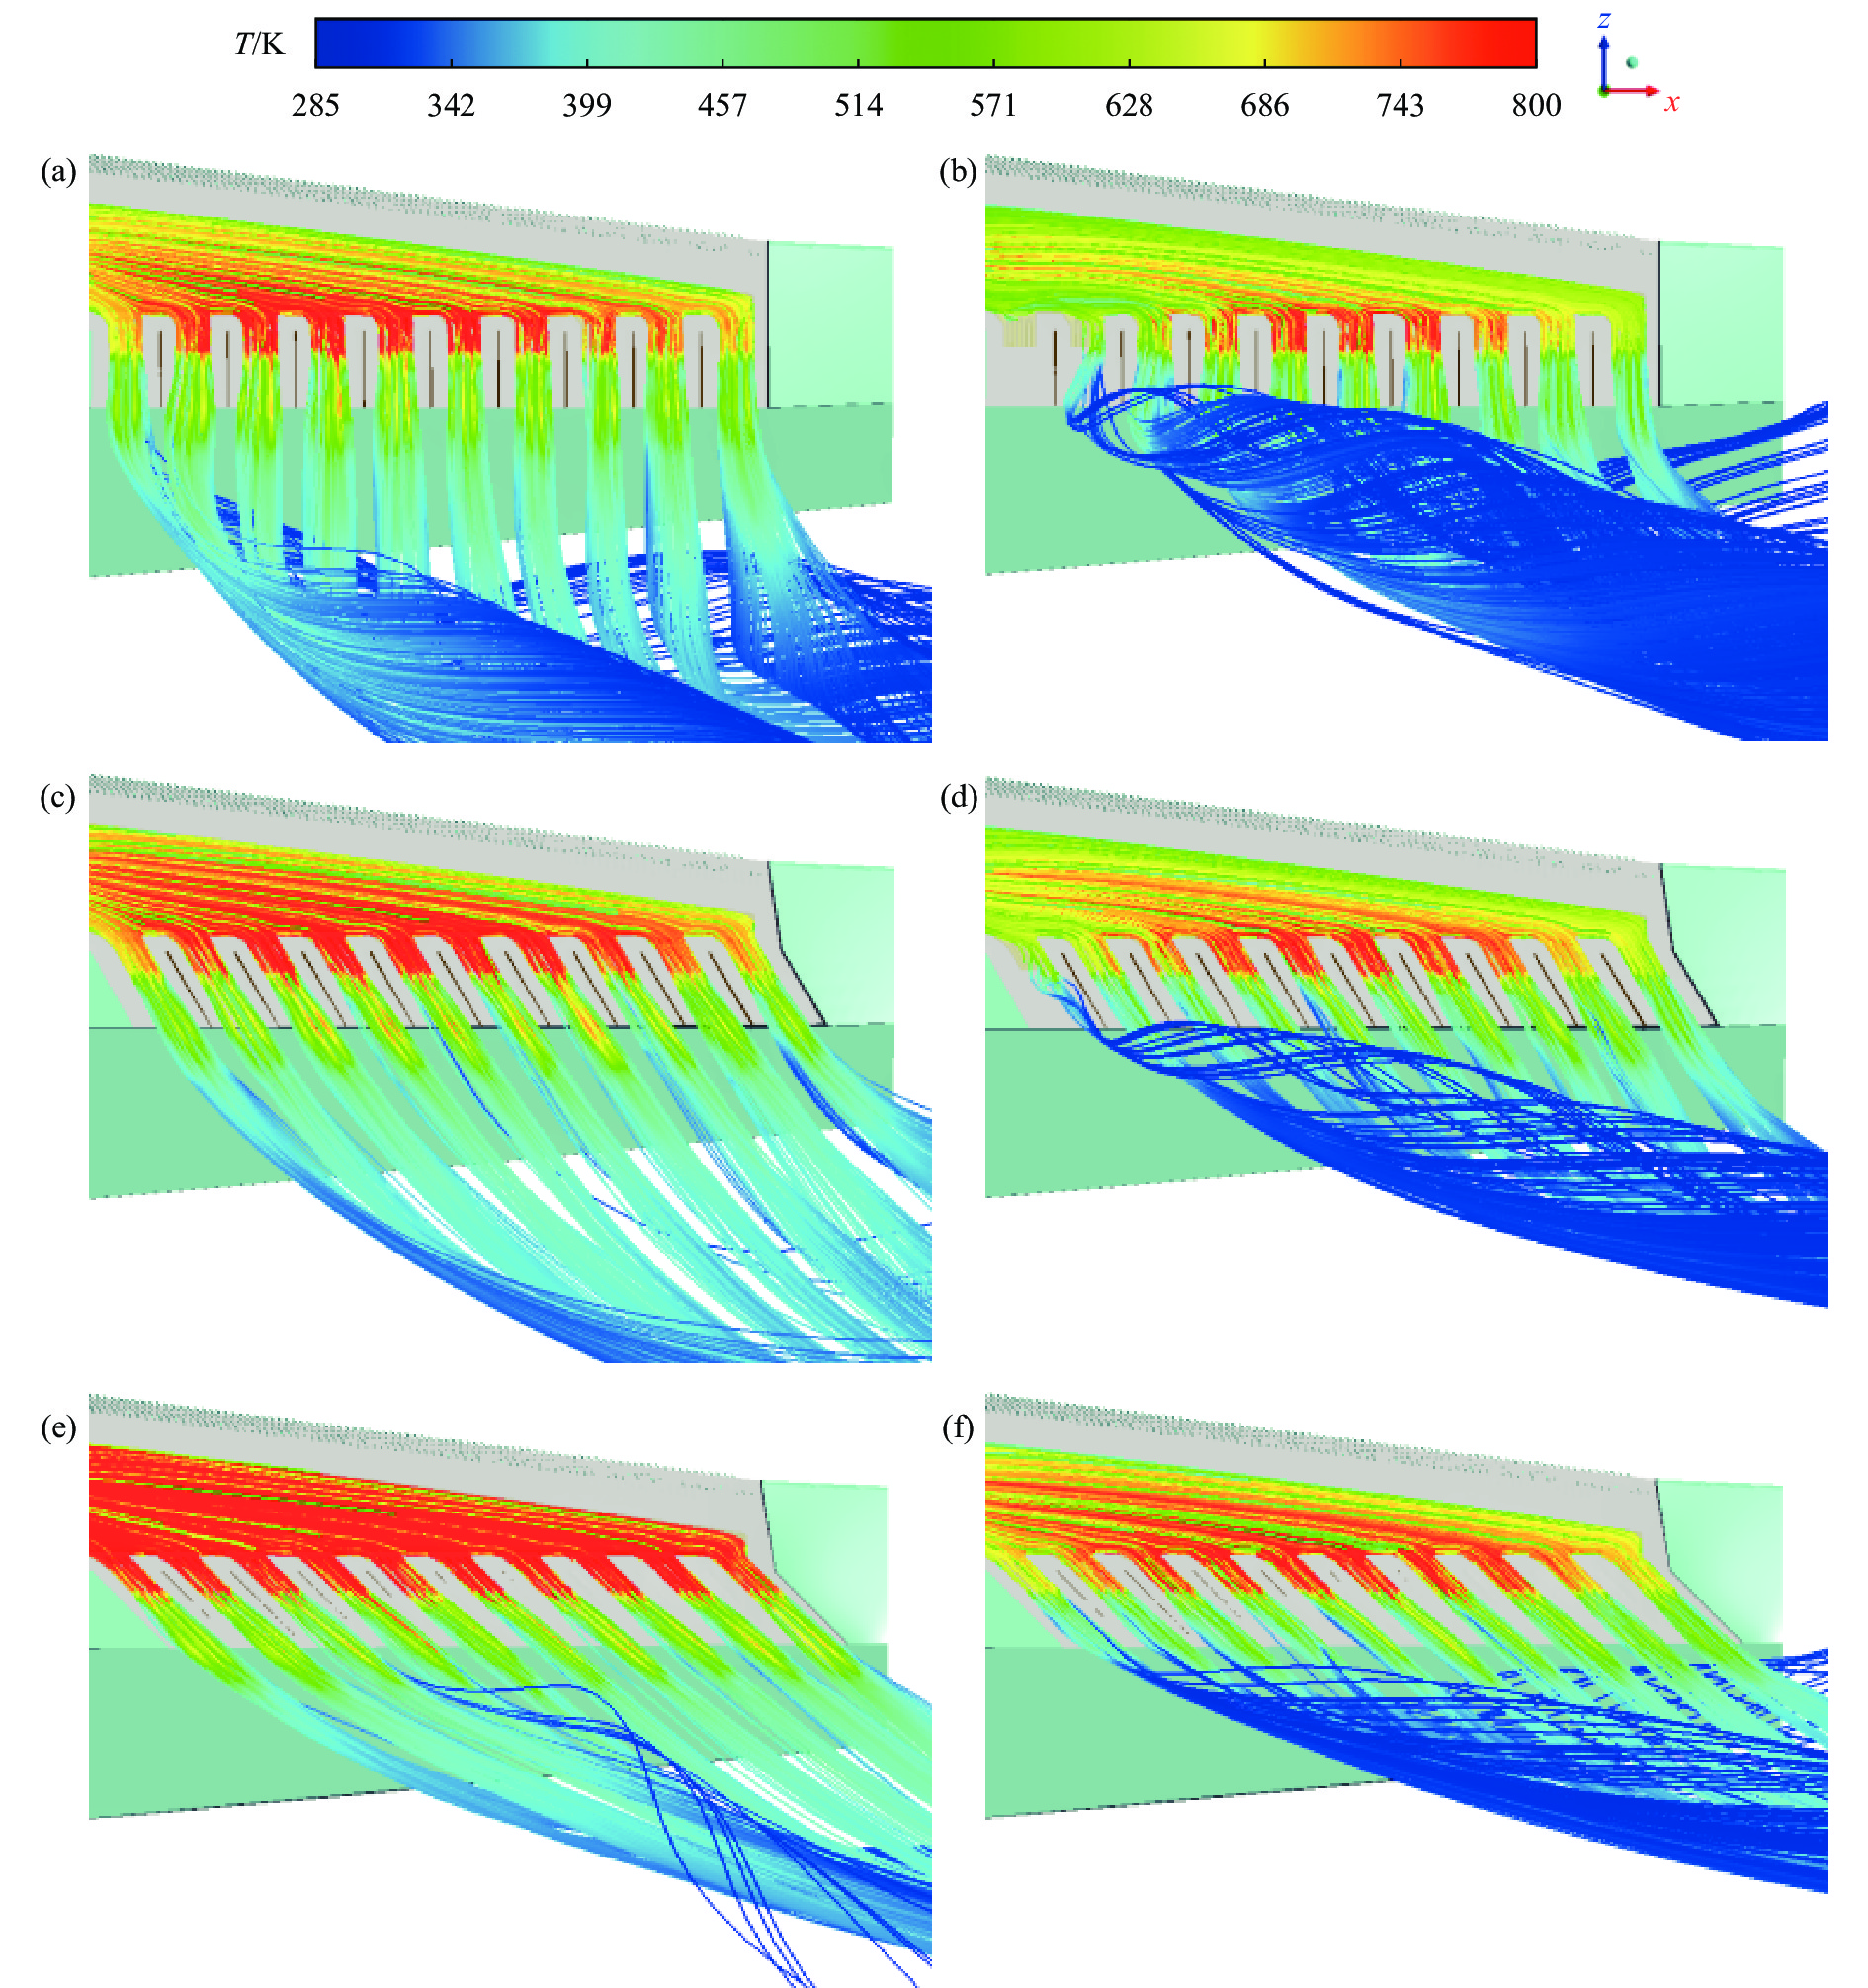
图11以高温燃气主流出口和引射气流进口为起始面显示了混合管内的流线,展现了模型A、C和D主流和引射次流的流动和温度分布情况。贴近混合管内壁的冷气流包裹着热气,无法较好的掺混,导致沿混合管轴向的排气温度分布不均匀,混合管前后端的排气温度比中间低。热气通过排气波瓣后对抑制器内下洗气流进行二级引射,两次掺混冷却后排气温度进一步下降,排气在发展过程中未冲击在隔板上,二次掺混冷却后的热气从抑制器侧面排气出口流出后,被前飞来流第三次冷却,并在前飞来流裹挟下远离抑制器。γ一定,前飞来流速度由15 m/s增大至55 m/s时,以模型A为例,如图11(a)、(b)所示,混合管内引射冷气量明显增多,证实了图10中引射系数的提高,但1号排气波瓣排气受阻,热气在混合管中后段堆积。前飞来流速度55 m/s时,随着γ的减小,排气不畅的情况得以改善,但不同前飞来流速度下,引射冷气量均随着γ的减小而减少,排气温度升高。

图 11 不同前飞来流速度下混合管内排气流动与温度分布:(a) 前飞15 m/s模型A;(b) 前飞55 m/s模型A;(c) 前飞15 m/s模型C;(d) 前飞55 m/s模型C;(e) 前飞15 m/s模型D;(f) 前飞55 m/s模型D
Figure 11. Flow and temperature distribution of exhaust in mixing duct under different forward flow velocities: (a) Forward flow 15 m/s model A; (b) Forward flow 55 m/s model A; (c) Forward flow 15 m/s model C; (d) Forward flow 55 m/s model C; (e) Forward flow 15 m/s model D; (f) Forward flow 55 m/s model D
总压恢复系数σ是衡量混合管内流动损失和整体阻力水平的无量纲特征参数,表达式为:
$$ \sigma =\frac{\displaystyle\sum {m}_{outi}×{P}_{outi}}{{m}_{in}×{P}_{in}+{m}_{se}×{P}_{se}} $$ (2) 式中:$ {m}_{outi} $表示各排气波瓣的热排气质量流量;$ {P}_{in} $、$ {P}_{se} $、$ {P}_{outi} $分别表示主流进口、引射次流进口、各排气波瓣出口的总压值。
不同前飞来流速度下各模型引射系数的变化见图12,结果表明:γ一定,前飞来流速度的提高时各模型总压恢复系数均有所降低,这是因为前飞来流速度增大后引射冷气量提高,强化了冷气与主流的掺混,带来更大的动压损失,从而降低了总压恢复系数。前飞来流速度一定,γ的减小时,总压恢复系数呈现先增大后减小的变化规律,因为γ的减小改善了排气流动,增大了流通面积,降低了混合管内气体的流速,但同时在排气波瓣出口面积不变的条件下,排气波瓣横截面积随γ减小而变小,使混合管内排气的流速提高,流动损失增大。不同巡航速度下,B和C模型的总压恢复系数均高于A模型,模型D总压恢复系数均为最低,结合图11可知尽管其有效改善了1号波瓣排气出口的排气流通情况,增大了排气面积,但排气面积增加的幅度小于γ减小所导致流通面积减少的幅度,导致管内排气流速提高,总压恢复系数随排气流速的提高减小。

图 12 不同前飞来流速度下各模型的总压恢复系数
Figure 12. Total pressure recovery coefficient under different forward flow velocities of modes
为分析混合管内静压分布规律,以10个分布式排气波瓣中轴线为准,截取一个倾斜剖面,图13为混合管内剖面位置示意图。

图 13 混合管内剖面位置
Figure 13. Position of the cross section in mixing duct
图14显示了不同前飞来流速度下模型A、C和D混合管内剖面位置的静压和流线分布情况。混合管中热流滞止处的静压较高,如排气波瓣迎流驻点处,混合管末端等。混合管中热流速度较高处静压较低,如排气波瓣出口。γ一定时,随着前飞来流速度的提高,管内静压升高。前飞来流速度一定时,随着γ的减小,流通面积减小,管内静压整体有所增大,排气波瓣出口处的低压区缩小甚至消失。前飞速度为55 m/s时,观察模型A的1号排气波瓣出口处:冷气倒灌入混合管内,流经混合管底部壁面后从2号排气波瓣流出,且排气与倒灌冷气在此形成高压滞止区。模型C未在1号排气波瓣出口发生倒流,混合管内静压水平与原模型接近;但模型D的流通面积过小,管内静压陡增,结合上文可知其总压恢复系数降低,混合管的气动性能反而变差。
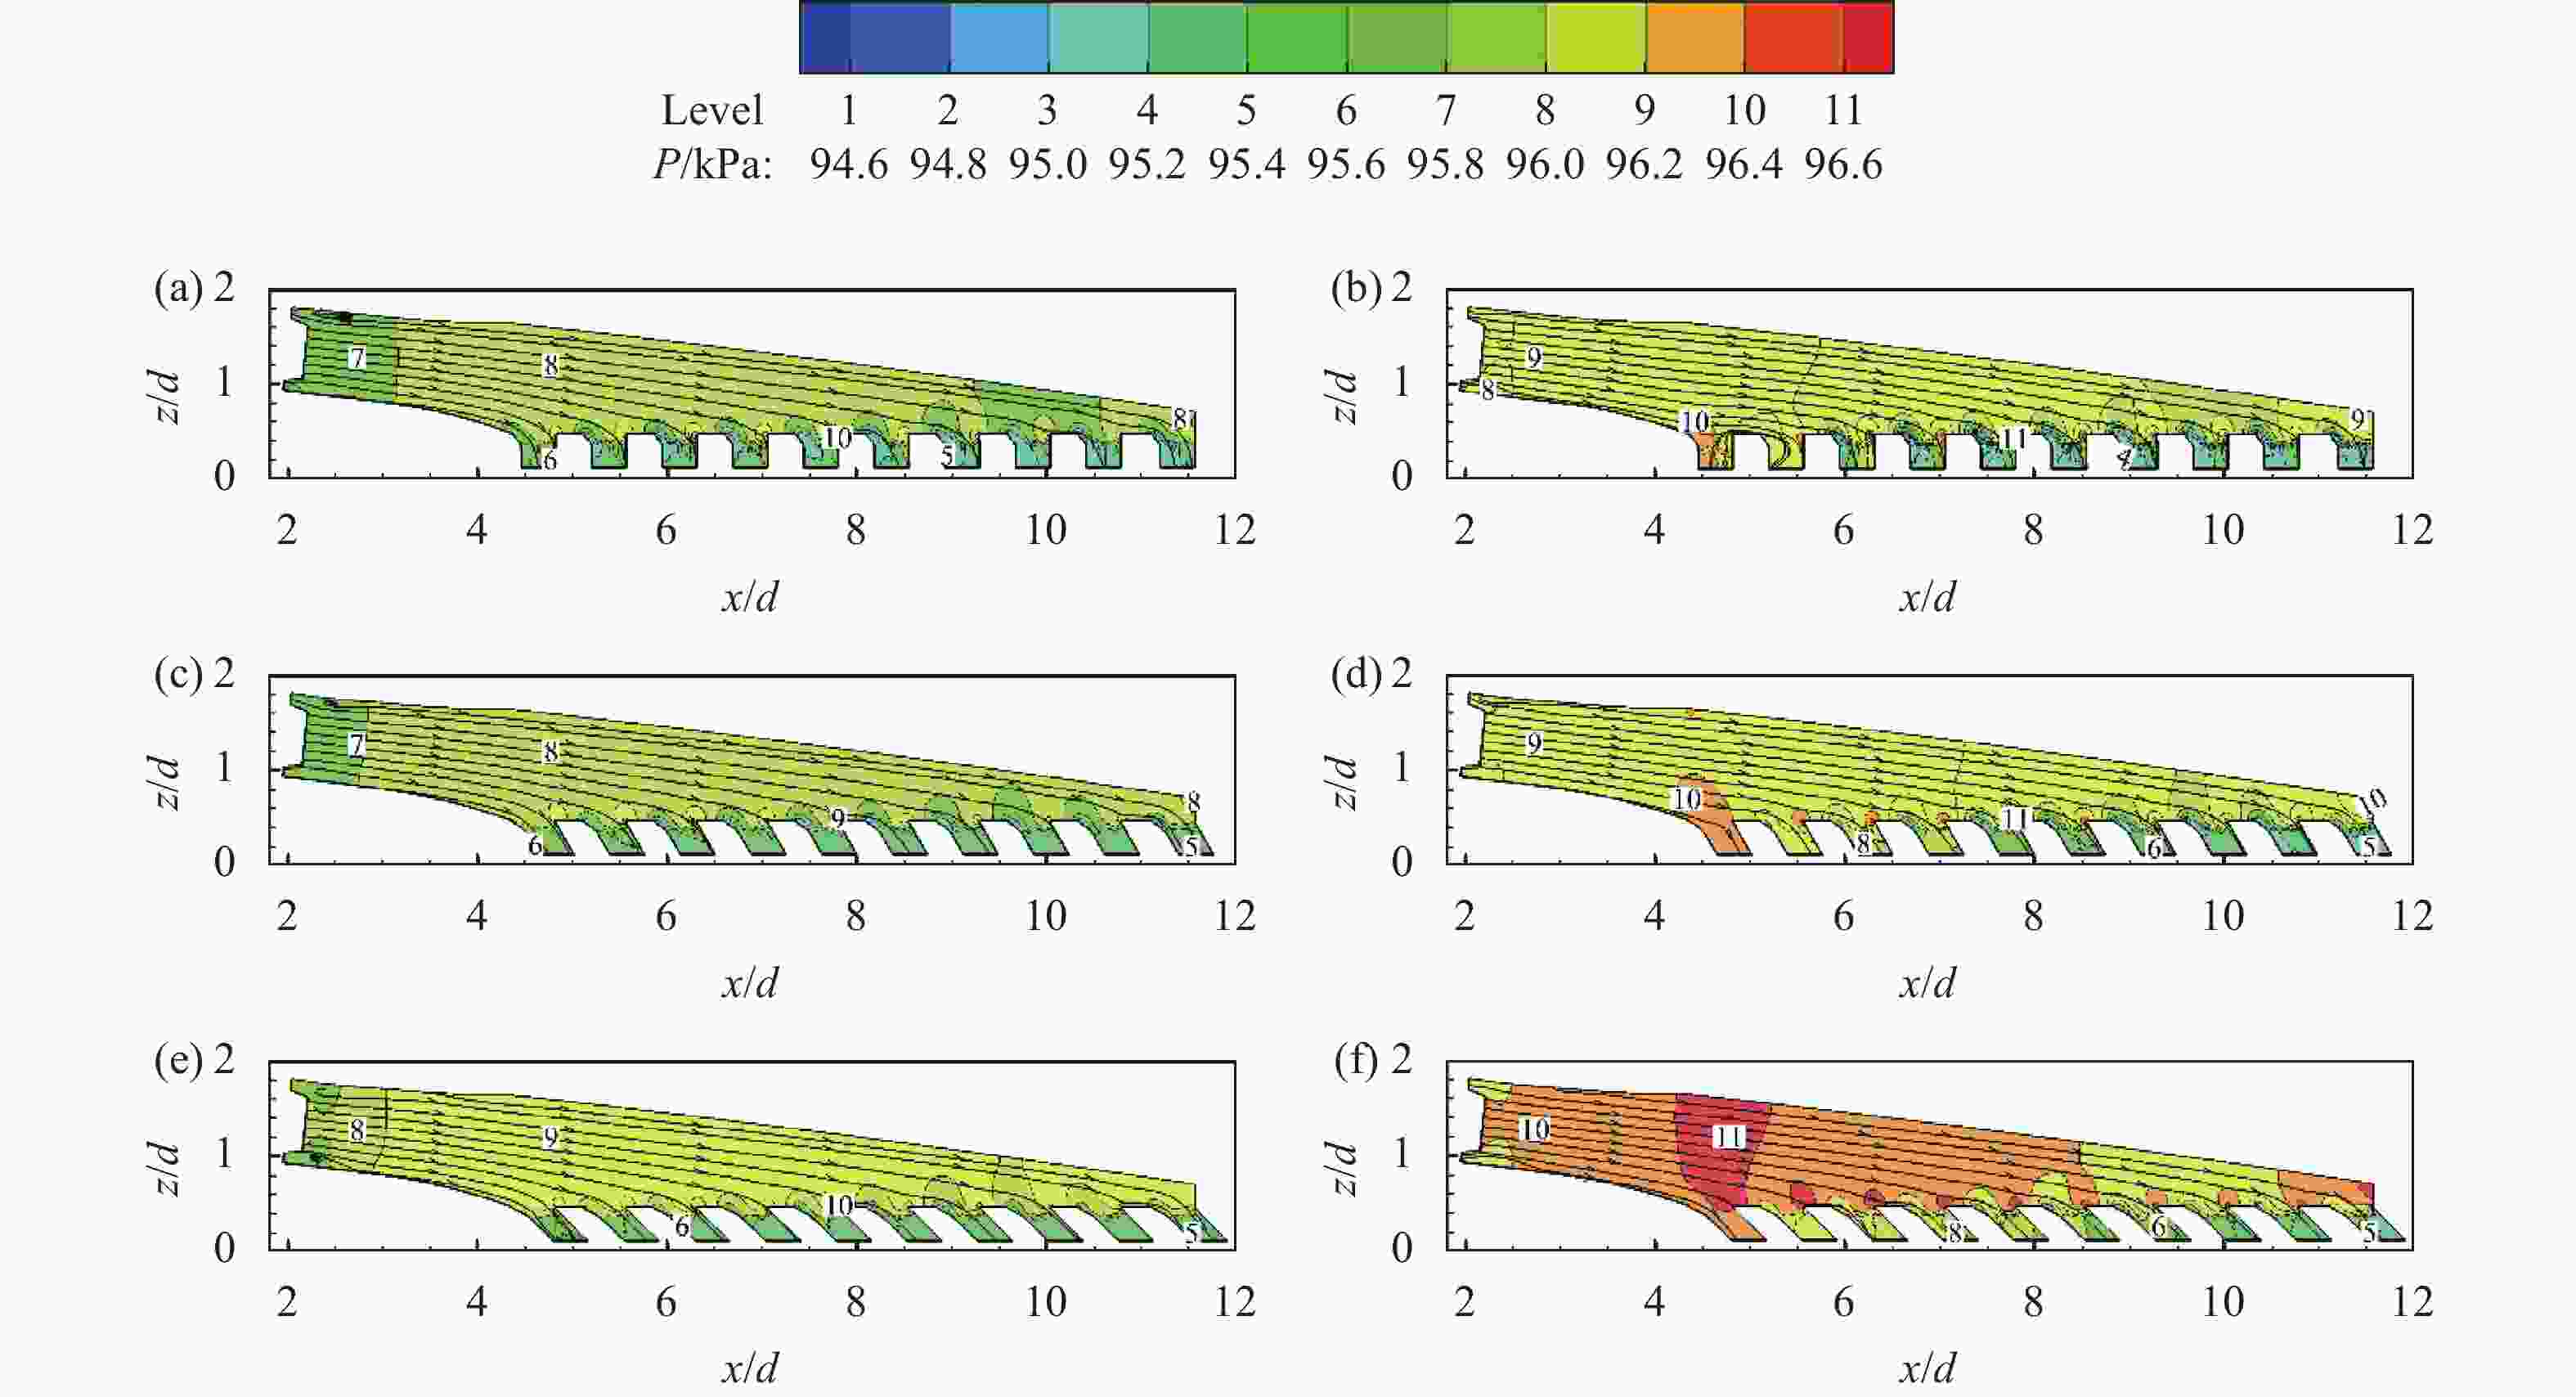
图 14 不同前飞来流速度下混合管内截面的静压和流线分布:(a) 前飞15 m/s模型A;(b) 前飞55 m/s模型A;(c) 前飞15 m/s模型C;(d) 前飞55 m/s模型C;(e) 前飞15 m/s模型D;(f) 前飞55 m/s模型D
Figure 14. Static pressure and streamlines distribution in the cross section of mixing duct under different forward flow velocities: (a) Forward flow 15 m/s model A; (b) Forward flow 55 m/s model A; (c) Forward flow 15 m/s model C; (d) Forward flow 55 m/s model C; (e) Forward flow 15 m/s model D; (f) Forward flow 55 m/s model D
-
图15展示了不同前飞来流速度下进入抑制器内下洗气流质量流量$ {m}_{un} $的变化情况。结果表明:γ一定时,随着前飞来流速度的提高,进入各模型抑制器内的下洗气流质量流量均有增大,在γ为90°、75°、60°和45°时,下洗气流质量流量的提升幅度分别为79.6%、79.39%、84.84%和71.53%。前飞来流速度一定时,随着γ的减小,下洗气流与倾斜隔板间的夹角增大,流动阻碍增大,导致其流量减小。

图 15 不同前飞来流速度下进入各模型的下洗气流质量流量
Figure 15. Mass flow rate of downwash flow entering models under different forward flow velocities
图16为不同前飞来流速度下模型A、C和D外蒙皮的温度分布云图。外蒙皮温度与环境温度相差在20 K以内,引射段蒙皮内侧缺乏下洗气流换热,温度高于排气段蒙皮。γ一定,提高前飞来流速度既能强化与蒙皮的对流换热,又能增大引射冷气量,从而降低混合管壁面温度以减少热辐射,降低外蒙皮温度。对于模型A,前飞来流速度55 m/s时,抑制器内下洗气流受前飞来流封堵,且热排气受到前飞来流冲击发生偏转,导致排气出口处局部蒙皮温度升高;由于排气被前飞来流冲散,冷却后的排气作用于排气下游外蒙皮,导致了排气下游局部蒙皮温度高出环境近20 K。前飞来流速度一定时,随着γ减小引射冷气量减少,混合管温度逐渐升高,辐射量的增加导致外蒙皮温度上升。其中模型D过小的γ使排气斜向上偏移,结合图15知进入抑制器内的下洗气流减少,下洗气流对排气的“下压”作用减弱,被前飞来流冲散后向两侧发展的排气作用于排气下游蒙皮的位置偏上。整体而言,随着γ减小抑制器外蒙皮局部高温区的面积先减小后增大。

图 16 不同前飞来流速度下外蒙皮温度分布:(a) 前飞15 m/s模型A;(b) 前飞55 m/s模型A;(c) 前飞15 m/s模型C;(d) 前飞55 m/s模型C;(e) 前飞15 m/s模型D;(f) 前飞55 m/s模型D
Figure 16. Temperature distribution of external skin under different forward flow velocities: (a) Forward flow 15 m/s model A; (b) Forward flow 55 m/s model A; (c) Forward flow 15 m/s model C; (d) Forward flow 55 m/s model C; (e) Forward flow 15 m/s model D; (f) Forward flow 55 m/s model D
图17给出了不同前飞来流速度下模型A、C和D底部排气段可视壁面的温度分布云图,可视部分主要包含了混合管、排气波瓣和外蒙皮。γ一定时,结合上文可知得益于引射和下洗冷气量的提升,提高前飞来流速度使混合管壁面的温度降低了约150 K,但混合管底部壁面因受混合管遮挡,下洗气流无法直接冲刷到,其温度仍较高。前飞来流速度一定时,γ减小导致引射和下洗量均减小,混合管温度升高,但倾斜的排气下游隔板对内部高温壁面的遮挡面积逐渐增大,其中模型D内部壁面被全部遮挡,内部高温壁面不可视。
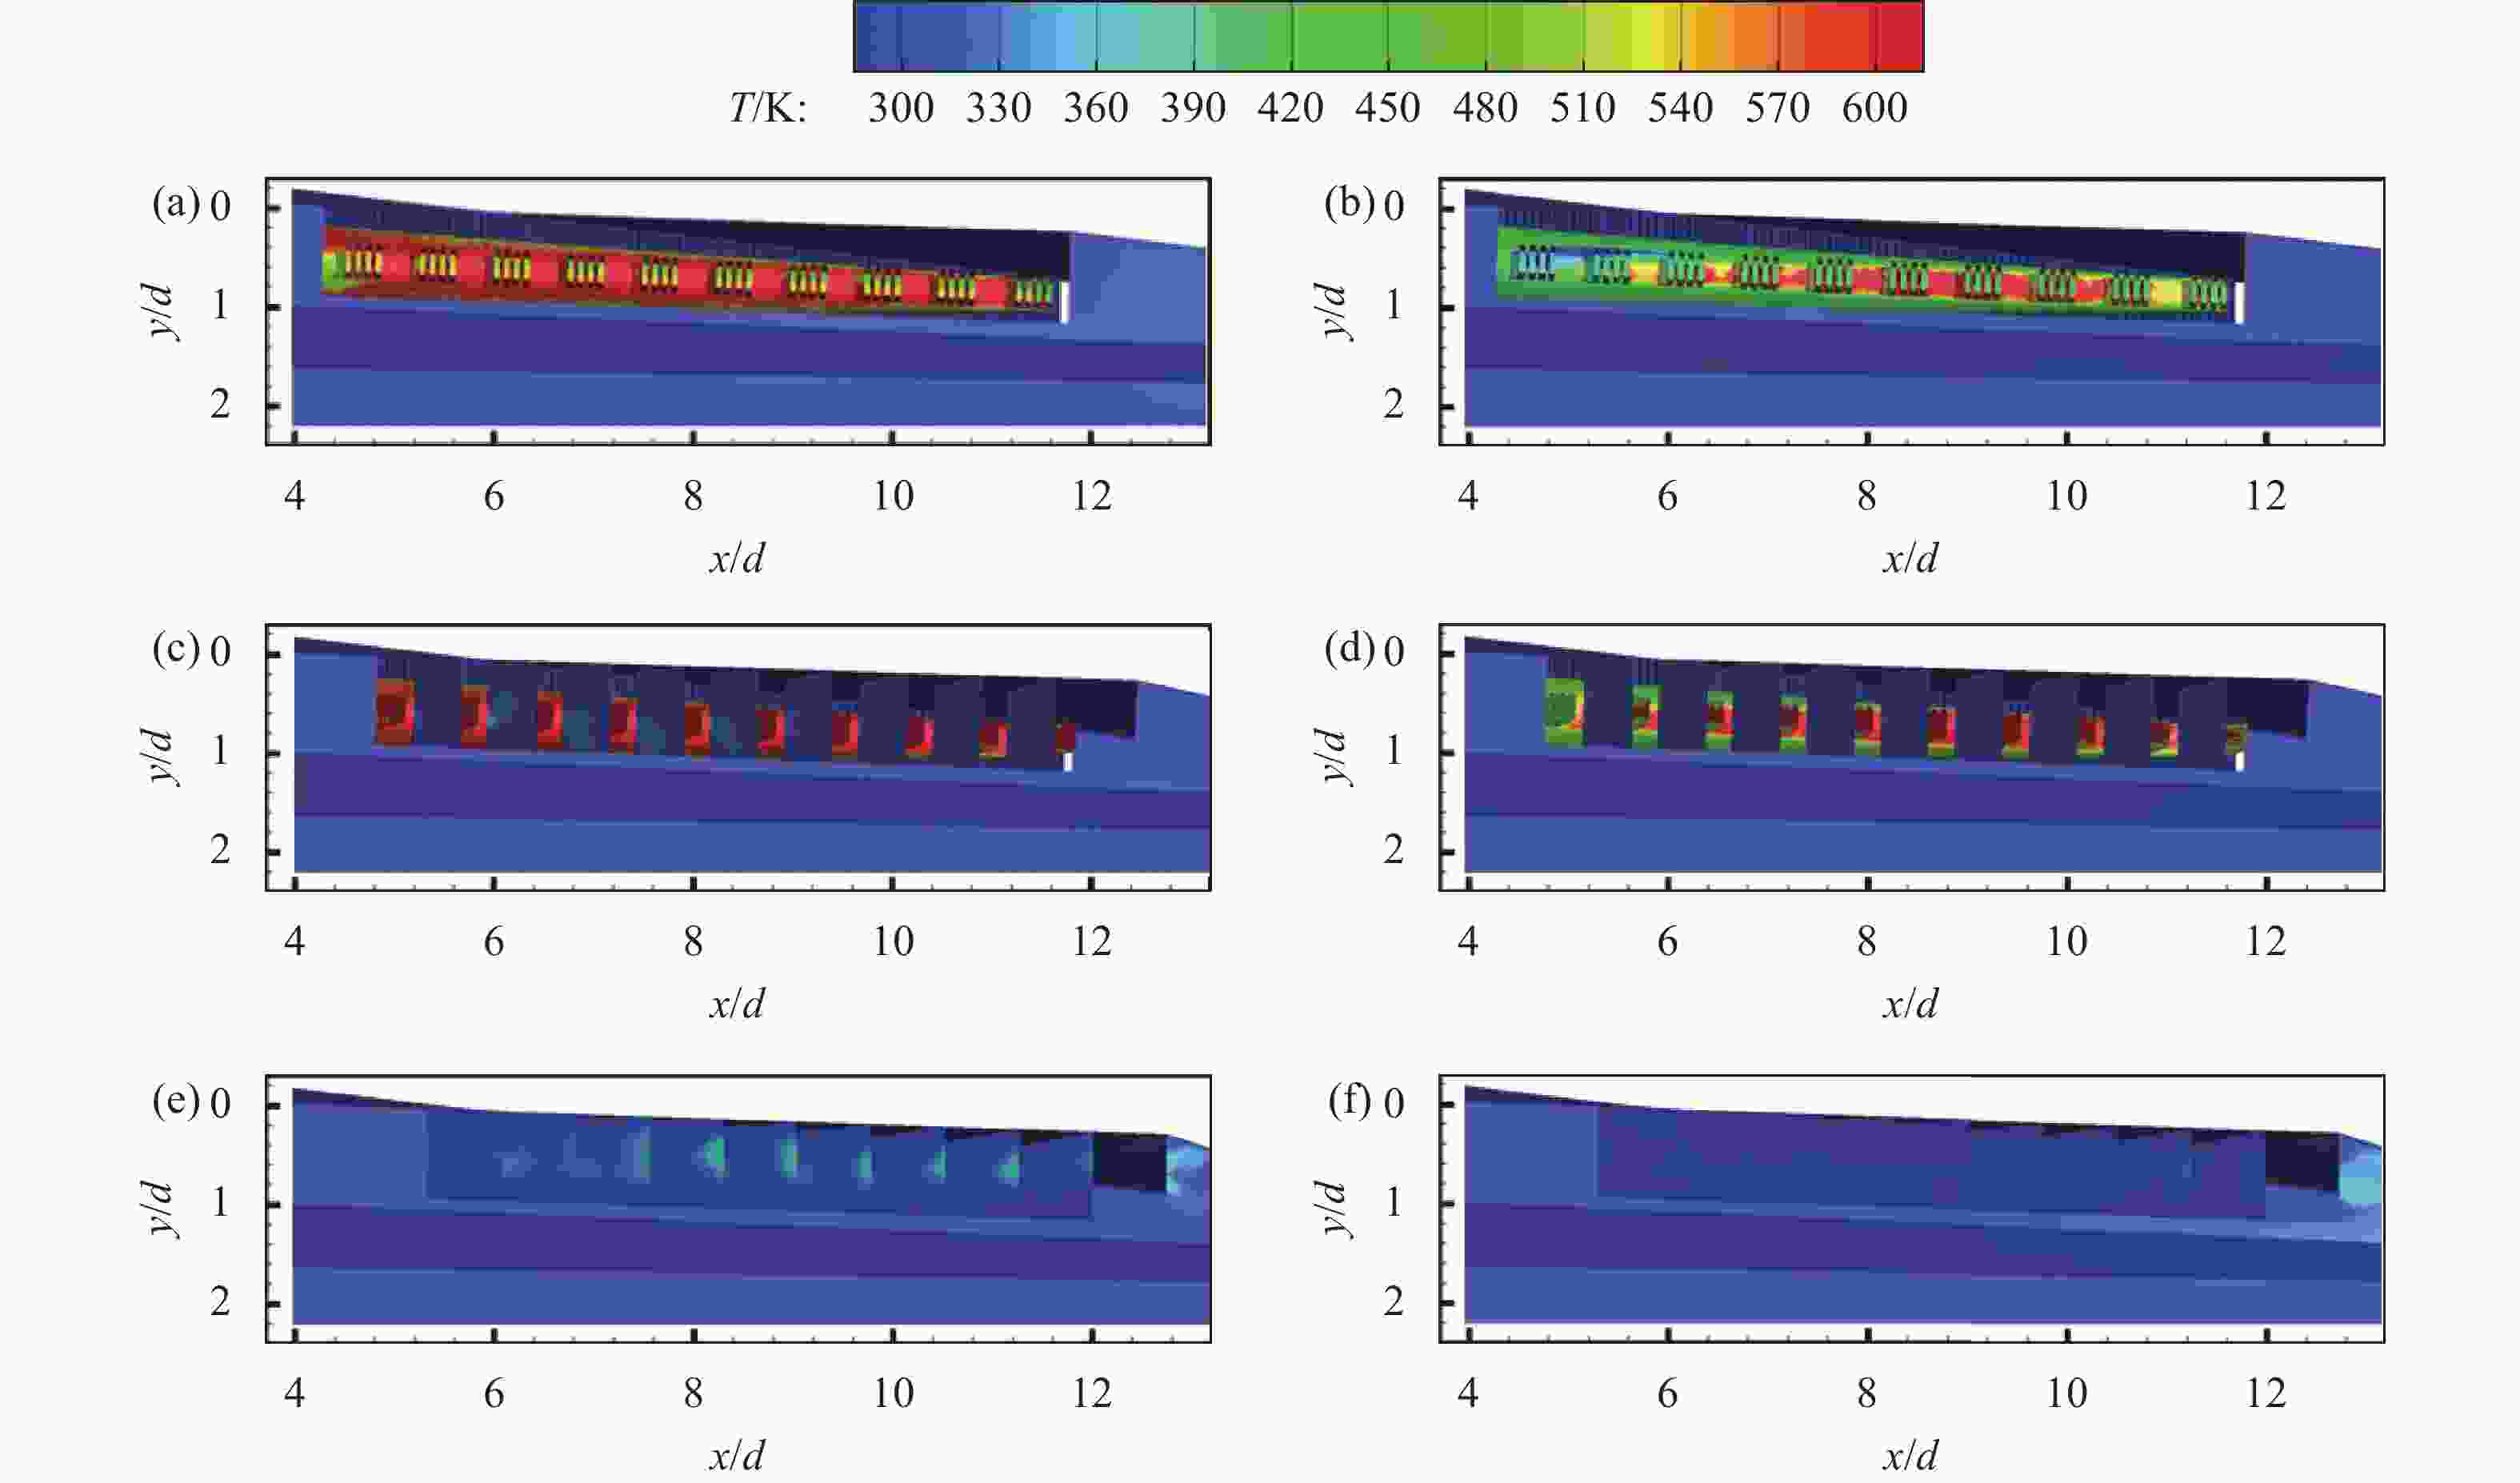
图 17 不同前飞来流速度下底部排气段可视壁面温度分布:(a) 前飞15 m/s模型A;(b) 前飞55 m/s模型A;(c) 前飞15 m/s模型C;(d) 前飞55 m/s模型C;(e) 前飞15 m/s模型D;(f) 前飞55 m/s模型D
Figure 17. Visible wall temperature distribution in exhaust section under different forward flow velocities at the bottom of models: (a) Forward flow 15 m/s model A; (b) Forward flow 55 m/s model A; (c) Forward flow 15 m/s model C; (d) Forward flow 55 m/s model C; (e) Forward flow 15 m/s model D; (f) Forward flow 55 m/s model D
-
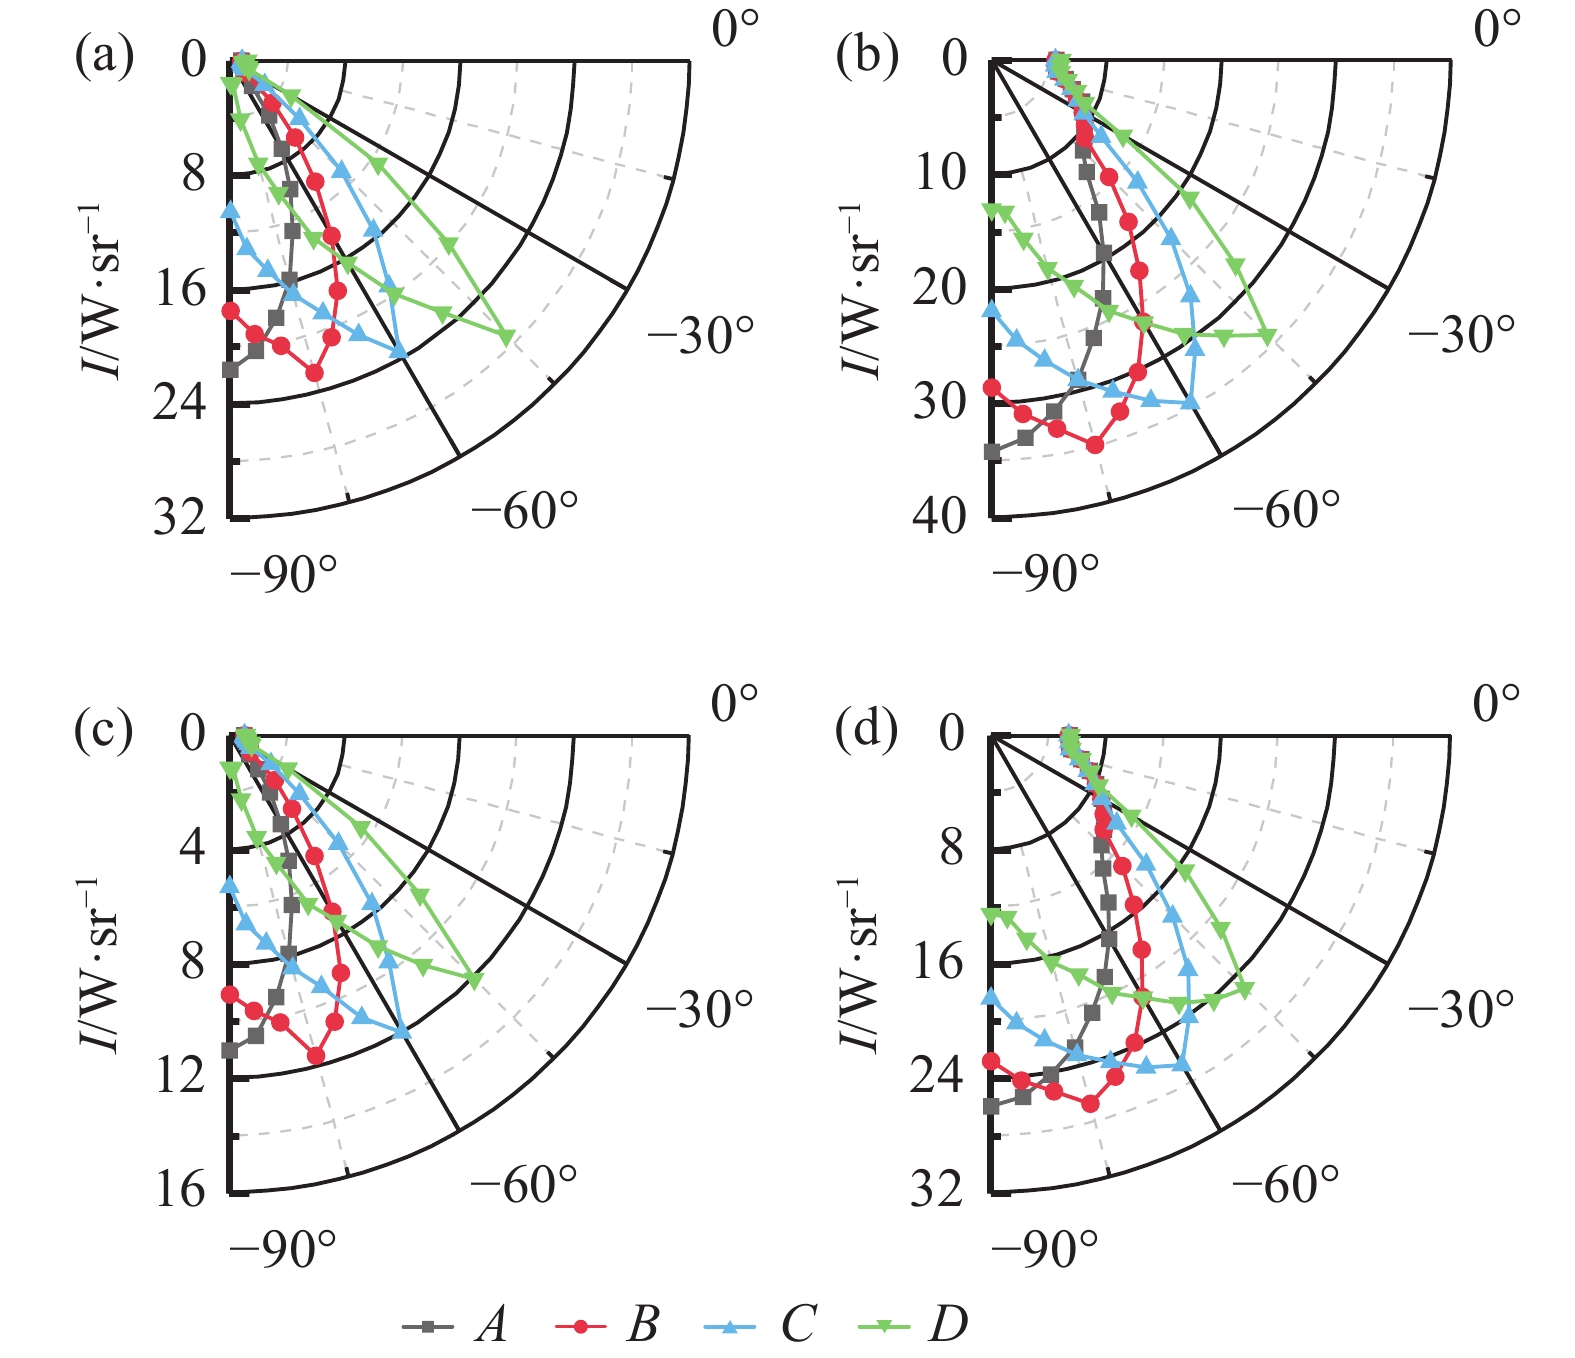
图18为不同前飞来流速度下各模型在横截面上3~5 μm和8~14 μm波段的红外辐射强度分布。依据红外辐射来源分为外蒙皮、排气和内部可视壁面辐射,由维恩位移定律知温度较低时红外辐射峰值将向长波偏移,相同发射面积下3~5 μm红外辐射强度将小于8~14 μm红外辐射强度,故低温外蒙皮是8~14 μm波段红外辐射的主要来源。抑制器下洗气流进口存在导流片,顶部视角下内部高温混合管壁面被遮挡,所以红外辐射强度明显低于底部视角。γ一定时,提高前飞来流速度增大了引射冷气量,3~5 μm波段红外辐射强度峰值降低约50%,8~14 μm波段红外辐射强度峰值降低约20%,且在90°~40°和−50°~−90°内红外辐射强度降低幅度明显高于40°~−50°,证明提高前飞来流速度是依靠降低排气和内部壁面温度来降低红外辐射强度的。前飞来流速度一定时,在90°~40°内可从引射气流进口探测到高温混合管,γ减小时混合管温度上升,红外辐射强度增大。在40°~−50°内高温内壁面不可视,红外辐射取决于气体辐射和外蒙皮辐射。在−50°~−90°内随着探测角度的减小,内部可视面积增大,红外辐射强度不断提高。模型A、B和C的红外辐射强度峰值随γ减小而减小,因为γ减小时隔板对内部高温壁面的遮挡程度增大,结合图17(e)、(f)可知在底部视角下模型D的隔板将内部壁面全部遮挡,其红外辐射强度显著低于其他模型。

图 18 不同前飞来流速度下横截面红外辐射强度分布: (a) 前飞15 m/s时3~5 μm波段;(b) 前飞15 m/s时8~14 μm波段;(c) 前飞55 m/s时3~5 μm波段;(d) 前飞55 m/s时8~14 μm波段;
Figure 18. Infrared radiation intensity distribution on cross section under different forward flow velocities: (a) Forward flow 15 m/s 3-5 μm band; (b) Forward flow 15 m/s 8-14 μm band; (c) Forward flow 55 m/s 3-5 μm band; (d) Forward flow 55 m/s 8-14 μm band
图19为不同前飞来流速度下各模型在纵截面上3~5 μm和8~14 μm波段的红外辐射强度分布。γ一定,前飞来流速度提高时,纵截面上不同波段红外辐射强度与横截面下降幅度相同。前飞来流速度一定时,各模型的红外辐射强度在纵截面的分布呈纺锤形,在正对喷口的较窄角度范围内(约30°)红外辐射强度较高,表现出较强的指向性。

图 19 不同前飞来流速度下纵截面红外辐射强度分布: (a) 前飞15 m/s时3~5 μm波段;(b) 前飞15 m/s时8~14 μm波段;(c) 前飞55 m/s时3~5 μm波段;(d) 前飞55 m/s时8~14 μm波段;
Figure 19. Infrared radiation intensity distribution on longitudinal section under different forward flow velocities: (a) Forward flow 15 m/s 3-5 μm band; (b) Forward flow 15 m/s 8-14 μm band; (c) Forward flow 55 m/s 3-5 μm band; (d) Forward flow 55 m/s 8-14 μm band
由于不同前飞来流速度下红外辐射强度的变化规律基本相同,所以仅提取前飞来流速度55 m/s时的红外辐射源(排气、内部高温壁面、外蒙皮),以揭示各辐射源对抑制器总红外辐射强度的贡献。
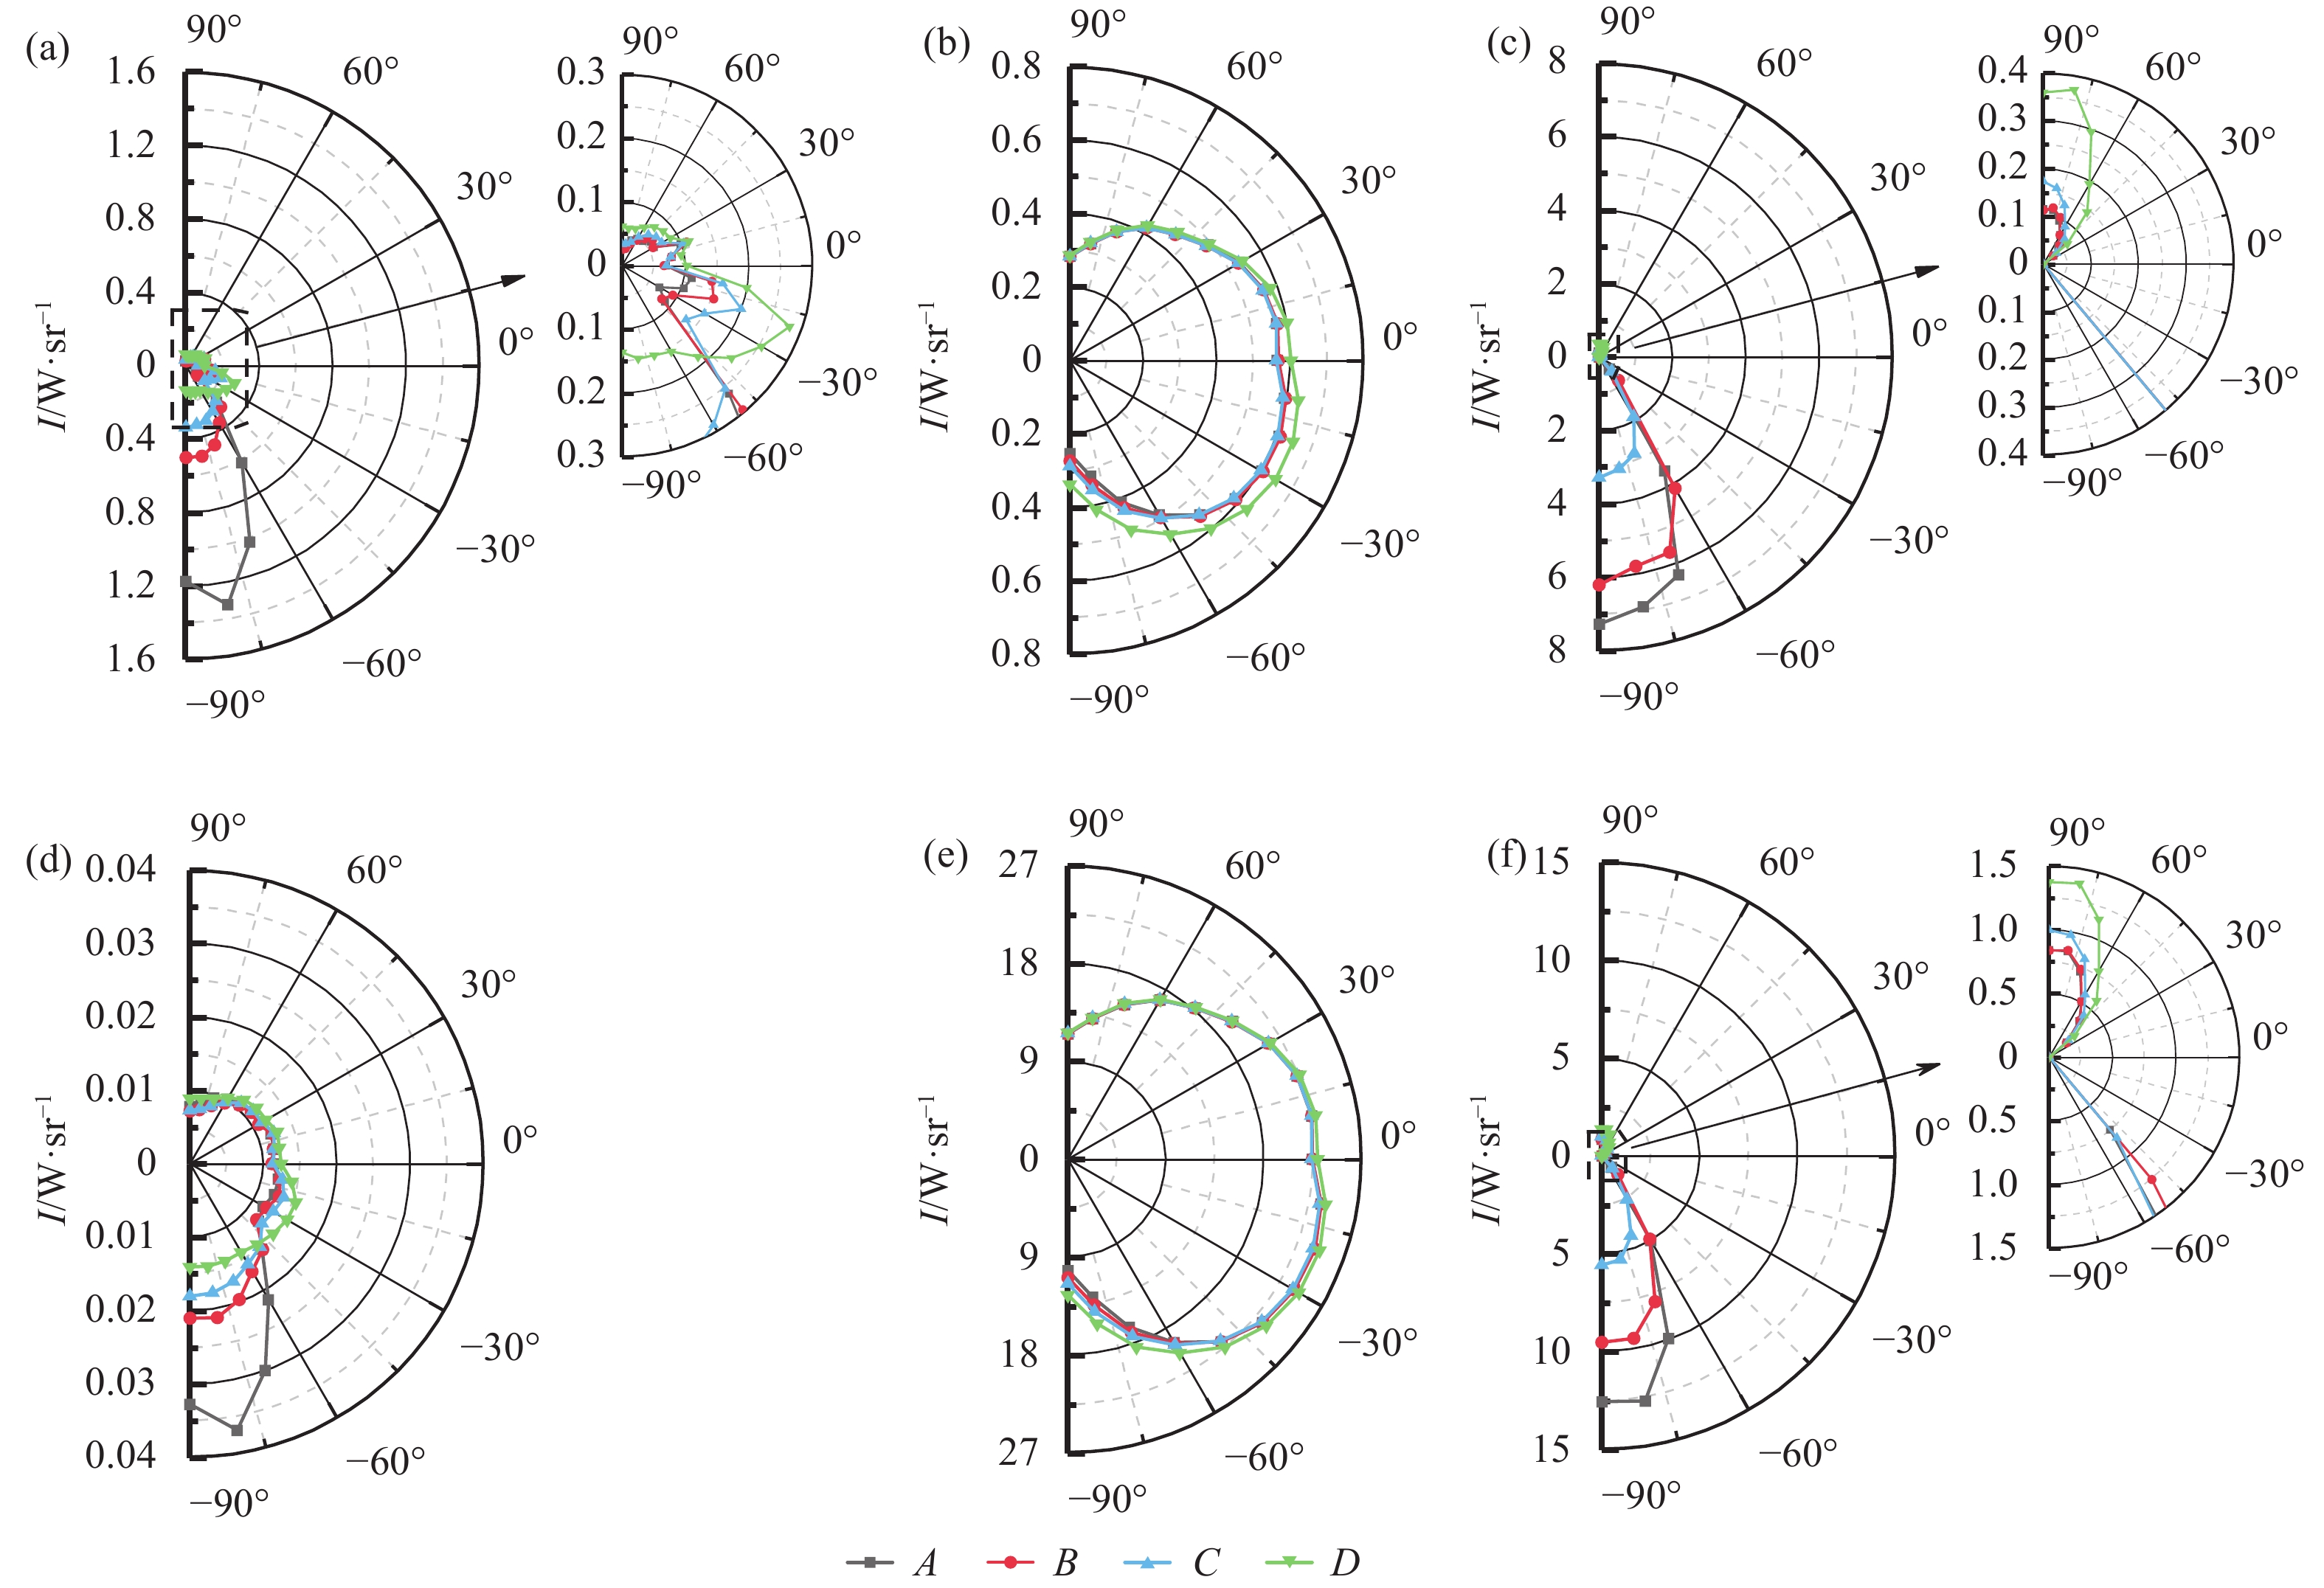
图20展示了前飞来流速度55 m/s时各模型横截面上3~5 μm和8~14 μm波段各红外辐射源的红外辐射强度分布情况。在3~5 μm波段,排气对辐射强度的贡献微弱,仅在90°~−60°内辐射较高;各模型外蒙皮辐射强度变化规律类似,其中模型D外蒙皮温度较高,红外辐射强度高于其他模型;各模型内壁面在30°~−40°内不可视,结合上文知模型D的混合管温度最高,所以在90°~60°范围内红外辐射强度是其他模型的2倍以上。在8~14 μm波段,排气的红外辐射可以忽略,外蒙皮是主要辐射源,仅在−60°~−90°内模型A、B和C内壁面可视,此时抑制器外蒙皮与内壁面红外辐射强度量级相当。

图 20 前飞来流55 m/s时横截面各辐射源的红外辐射强度分布:(a) 3~5 μm波段排气;(b) 3~5 μm波段外蒙皮;(c) 3~5 μm可视内壁面;(d) 8~14 μm波段排气;(e) 8~14 μm波段外蒙皮;(f) 8~14 μm波段可视内壁面
Figure 20. Infrared radiation intensity distribution from different sources on cross section under forward flow velocity is 55 m/s: (a) 3-5 μm band exhaust; (b) 3-5 μm band external skin; (c) 3-5 μm band inner wall; (d) 8-14 μm band exhaust; (e) 8-14 μm band external skin; (f) 8-14 μm band inner wall
-
文中通过数值模拟和红外辐射计算,研究了不同前飞来流速度下某型一体化红外抑制器遮挡和混合管排气波瓣后向排气偏转角γ对混合管气动性能、抑制器可视壁面温度分布和红外辐射分布特性的影响,所得结论如下:
1)前飞来流速度提高时,主要依靠降低排气和内部壁面温度来降低各波段的红外辐射强度,前飞来流速度从15 m/s提升至55 m/s时,抑制器红外辐射强度峰值在3~5 μm波段降低约50%,在8~14 μm波段降低约20%;抑制器外蒙皮温度有所降低,但在排气与前飞来流相互作用下,抑制器排气下游外蒙皮局部会形成高于环境温度20 K左右的高温区,随着γ的减小高温区面积先减小后增大。
2) γ减小带来的利弊效果相互平衡后决定了其对混合管气动性能的影响:减小γ可以消除前端排气出口被前飞来流的封堵和冷气倒灌入混合管内的现象,从而增大流通面积,提高了总压恢复系数;但在排气波瓣出口面积不变时,其横截面积随γ减小而减小,导致排气系统的引射系数降低,混合管内静压升高,总压恢复系数减小。
3)对抑制器的下洗气流进口加装弯曲导流片可以对内部高温混合管进行遮挡,从而有效降低抑制器顶部的红外辐射强度,3~5 μm和8~14 μm波段的红外辐射强度分别约为底部视角下的10%和50%。在抑制器底部视角,随着γ的减小,排气下游隔板对高温壁面的遮挡程度变大,模型B、C和D在3~5 μm波段的红外辐射强度峰值较模型A分别下降约17.7%、41.5%和78.4%。由于隔板的遮挡作用,在纵截面上各模型红外辐射强度的分布存在明显的指向性,仅在30°的小范围内表现出较高辐射水平,整体分布呈现纺锤形规律。
4)通过研究抑制器各红外辐射源对3~5 μm和8~14 μm波段红外辐射强度分布的贡献可知:得益于排气系统采用两级波瓣构型对排气进行二级引射冷却,排气与冷气掺混后温度较低,对3~5 μm波段红外辐射强度的贡献远小于内部高温可视壁面,在8~14 μm波段其红外辐射强度可忽略不计。3~5 μm波段红外辐射强度主要来源于内部高温壁面辐射,而8~14 μm波段由内部高温壁面和抑制器蒙皮的红外辐射强度共同决定。
5)对比文中提出的四种一体化红外抑制器模型,模型D在抑制器底部视角下红外辐射强度最小,但其混合管气动性能不佳,混合管壁面温度较高,导致除底部视角外的其他方向红外辐射均高于其他模型。模型C综合性能最优,在保证混合管有良好气动性能的同时,有效减小了外蒙皮的局部高温区,抑制器底部红外隐身效果仅次于模型D,在各个探测角度上均有良好的红外隐身表现。
Effects of infrared-suppressor-integrated exhaust outflow on its aerodynamic and infrared radiation characteristics
-
摘要: 经地面模型实验验证,数值仿真展示了一体化红外抑制器排气出流、模拟旋翼下洗气流和模拟前飞来流相互作用下的流动和换热特征,通过改变排气出流角度和模拟前飞来流速度,计算分析一体化红外抑制器引射、混合特性以及红外辐射强度空间分布的变化规律。仿真结果表明:模拟的前飞来流与排气出流相互作用后会造成局部排气不畅,前飞来流甚至倒灌入红外抑制器内,从而引起抑制器壁面局部高温,增加了抑制器整体红外辐射强度;改变排气角度可将之改善,且存在气动和红外辐射特性兼顾的最佳角度。前飞来流速度从15 m/s提高到55 m/s,抑制器内部高温壁面温度降低,抑制器红外辐射强度峰值在3~5 μm波段降低约50%,在8~14 μm波段降低约20%。红外抑制器的下洗气流进口加装弯曲导流片可以对内部混合管高温壁面进行遮挡,有效降低顶部视角的红外辐射强度。最佳排气角度下,利用排气下游隔板的遮挡,正对抑制器排气出口方向(底部视角)上的3~5 μm和8~14 μm波段红外辐射峰值分别降低约50%和33%。Abstract:
Objective The armed helicopter is in the blind area of radar detection when performing low-altitude missions, but more attention should be paid to the threat of infrared guided weapons. Integrated into the rear fuselage of the helicopter, the infrared suppressor offers excellent stealth capabilities due to its small spatial footprint and the ability of rapid mixing and cooling at short distances. Over the past decades, significant progress has been made in understanding the mechanisms of infrared suppression, enhancing the performance of the suppressor in the areas such as cold-air injection, cold-hot flow mixing, and obscuration of high-temperature components. However, the infrared stealth effectiveness of the suppressor from the top and bottom perspectives has always been suboptimal, necessitating the search for optimal suppressor structures for further improvement. Furthermore, during the helicopter cruising, the suppressor exhaust is inevitably affected by the forward flow. Therefore, it is essential to study the performance of the infrared suppressor under the coupled conditions of forward flow, thermal exhaust, and rotor downwash. Methods In this study, an integrated physical model of the infrared suppressor is constructed, which includes the outer skin and the exhaust system (Fig.1). On the basis of the verification of ground model experiment, the simulation of forward flow and variations in the exhaust flow angle are added to assess how these changes affect the flow dynamics, heat transfer, and spatial distribution of infrared radiation intensity within the suppressor. The infrared radiation intensity was calculated using forward-backward ray-tracing method. Results and Discussions The results of ground experimental measurement and simulation calculation meet the error requirements, proving the calculation method in this paper is feasible. The increase of the forward flow velocity will increase the ejection coefficient of the lobed nozzle (Fig.10), but will reduce the total pressure recovery coefficient of the exhaust system (Fig.12), and the exhaust of the suppressor is blocked at higher forward flow velocity (Fig.11). Reducing the backward deflection angle γ can solve the problem of poor exhaust, thereby increasing the flow area and improving the total pressure recovery coefficient. However, when the outlet area of the exhaust lobe is constant, its cross-sectional area decreases with the decrease of γ, resulting in a decrease in the ejection coefficient of the exhaust system, an increase in the static pressure in the mixing tube, and a decrease in the total pressure recovery coefficient. When the forward flow velocity increases, the infrared radiation of each band is mainly reduced by reducing the exhaust and internal wall temperature. The installation of a curved deflector at the downwash flow inlet of the suppressor can block the internal high-temperature mixing tube and effectively reduce the infrared radiation intensity at the top of the suppressor (Fig.18). The radiation shielding baffle at the downstream of the exhaust on the longitudinal section makes the suppressor show a high radiation level only in a small range of 30° (Fig.19). Conclusions The balance of the advantages and disadvantages brought by changing the backward deflection angle γ of the exhaust lobe determines its influence on the aerodynamic performance of the mixing tube. The external skin downstream of the suppressor exhaust will form a high temperature zone higher than the ambient temperature of about 20 K, and the area of the high temperature zone decreases first and then increases with the decrease of γ. The infrared radiation intensity in the 3-5 μm band is mainly derived from the internal high temperature wall, while the 8-14 μm band is determined by the internal high temperature wall and the external skin. When the forward flow velocity increases from 15 m/s to 55 m/s, the peak infrared radiation intensity of the suppressor decreases by about 50% in the 3-5 μm band and about 20% in the 8-14 μm band. In general, when γ is 60°, the mixing tube has good aerodynamic performance, the local high temperature zone of the external skin is the smallest, and it has good infrared stealth performance at all detection angles. -
图 1 (a) 一体化红外抑制器组成;(b) 抑制器内部横截面流动
Figure 1. (a) Infrared-suppressor-integrated composition; (b) Internal cross-sectional flow of suppressor
图 2 (a) 排气系统部分结构;(b) 排气波瓣出口截面;(c) 引射波瓣参数
Figure 2. (a) Local schematic of exhaust system structure; (b) Exhaust lobe outlet section; (c) Ejector lobe parameters
图 3 (a) 排气波瓣角度示意;(b) 混合管和带偏转角的波瓣局部示意图
Figure 3. (a) Exhaust lobe angle diagram; (b) Local schematic of mixing duct and lobes with deflection angle
图 8 实验测量与仿真计算的混合管外侧壁面轴向测点温度分布
Figure 8. Experimental measurement and numerical simulation of axial temperature distribution on external wall of mixing duct
图 9 (a) 下洗气流速度0 m/s时排气温度;(b) 下洗气流速度20 m/s时排气温度
Figure 9. (a) Exhaust temperature (downwash flow 0 m/s); (b) Exhaust temperature (downwash flow 20 m/s)
图 10 不同前飞来流速度下各模型的引射系数
Figure 10. Ejection coefficient under different forward flow velocities of modes
图 11 不同前飞来流速度下混合管内排气流动与温度分布:(a) 前飞15 m/s模型A;(b) 前飞55 m/s模型A;(c) 前飞15 m/s模型C;(d) 前飞55 m/s模型C;(e) 前飞15 m/s模型D;(f) 前飞55 m/s模型D
Figure 11. Flow and temperature distribution of exhaust in mixing duct under different forward flow velocities: (a) Forward flow 15 m/s model A; (b) Forward flow 55 m/s model A; (c) Forward flow 15 m/s model C; (d) Forward flow 55 m/s model C; (e) Forward flow 15 m/s model D; (f) Forward flow 55 m/s model D
图 12 不同前飞来流速度下各模型的总压恢复系数
Figure 12. Total pressure recovery coefficient under different forward flow velocities of modes
图 14 不同前飞来流速度下混合管内截面的静压和流线分布:(a) 前飞15 m/s模型A;(b) 前飞55 m/s模型A;(c) 前飞15 m/s模型C;(d) 前飞55 m/s模型C;(e) 前飞15 m/s模型D;(f) 前飞55 m/s模型D
Figure 14. Static pressure and streamlines distribution in the cross section of mixing duct under different forward flow velocities: (a) Forward flow 15 m/s model A; (b) Forward flow 55 m/s model A; (c) Forward flow 15 m/s model C; (d) Forward flow 55 m/s model C; (e) Forward flow 15 m/s model D; (f) Forward flow 55 m/s model D
图 15 不同前飞来流速度下进入各模型的下洗气流质量流量
Figure 15. Mass flow rate of downwash flow entering models under different forward flow velocities
图 16 不同前飞来流速度下外蒙皮温度分布:(a) 前飞15 m/s模型A;(b) 前飞55 m/s模型A;(c) 前飞15 m/s模型C;(d) 前飞55 m/s模型C;(e) 前飞15 m/s模型D;(f) 前飞55 m/s模型D
Figure 16. Temperature distribution of external skin under different forward flow velocities: (a) Forward flow 15 m/s model A; (b) Forward flow 55 m/s model A; (c) Forward flow 15 m/s model C; (d) Forward flow 55 m/s model C; (e) Forward flow 15 m/s model D; (f) Forward flow 55 m/s model D
图 17 不同前飞来流速度下底部排气段可视壁面温度分布:(a) 前飞15 m/s模型A;(b) 前飞55 m/s模型A;(c) 前飞15 m/s模型C;(d) 前飞55 m/s模型C;(e) 前飞15 m/s模型D;(f) 前飞55 m/s模型D
Figure 17. Visible wall temperature distribution in exhaust section under different forward flow velocities at the bottom of models: (a) Forward flow 15 m/s model A; (b) Forward flow 55 m/s model A; (c) Forward flow 15 m/s model C; (d) Forward flow 55 m/s model C; (e) Forward flow 15 m/s model D; (f) Forward flow 55 m/s model D
图 18 不同前飞来流速度下横截面红外辐射强度分布: (a) 前飞15 m/s时3~5 μm波段;(b) 前飞15 m/s时8~14 μm波段;(c) 前飞55 m/s时3~5 μm波段;(d) 前飞55 m/s时8~14 μm波段;
Figure 18. Infrared radiation intensity distribution on cross section under different forward flow velocities: (a) Forward flow 15 m/s 3-5 μm band; (b) Forward flow 15 m/s 8-14 μm band; (c) Forward flow 55 m/s 3-5 μm band; (d) Forward flow 55 m/s 8-14 μm band
图 19 不同前飞来流速度下纵截面红外辐射强度分布: (a) 前飞15 m/s时3~5 μm波段;(b) 前飞15 m/s时8~14 μm波段;(c) 前飞55 m/s时3~5 μm波段;(d) 前飞55 m/s时8~14 μm波段;
Figure 19. Infrared radiation intensity distribution on longitudinal section under different forward flow velocities: (a) Forward flow 15 m/s 3-5 μm band; (b) Forward flow 15 m/s 8-14 μm band; (c) Forward flow 55 m/s 3-5 μm band; (d) Forward flow 55 m/s 8-14 μm band
图 20 前飞来流55 m/s时横截面各辐射源的红外辐射强度分布:(a) 3~5 μm波段排气;(b) 3~5 μm波段外蒙皮;(c) 3~5 μm可视内壁面;(d) 8~14 μm波段排气;(e) 8~14 μm波段外蒙皮;(f) 8~14 μm波段可视内壁面
Figure 20. Infrared radiation intensity distribution from different sources on cross section under forward flow velocity is 55 m/s: (a) 3-5 μm band exhaust; (b) 3-5 μm band external skin; (c) 3-5 μm band inner wall; (d) 8-14 μm band exhaust; (e) 8-14 μm band external skin; (f) 8-14 μm band inner wall
表 1 不同网格数下地面实验和有前飞来流时波瓣喷管的引射系数
Table 1. Ejection coefficient of lobed nozzle in ground experiment and with simulated forward flow under different grid numbers
Grid number (million) In Ground experiment With simulated forward flow 8 0.046 0.175 10 0.048 0.175 12 0.048 0.177 14 0.049 0.178 16 0.049 0.179 18 0.049 0.179  下载: 导出CSV
表 2 横截面0°方向实验测量和仿真计算的红外辐射强度
Table 2. Experimental measurement and numerical simulation of infrared radiation intensity in cross-sectional direction at 0° angle
Status 3-5 μm/
W·sr−18-14 μm/
W·sr−1Experiment
(downwash 0 m/s)5.2 33.6 Experiment
(downwash 20 m/s)4.0 30.9 Simulation
(downwash 0 m/s)5.0 32.5 Simulation
(downwash 20 m/s)3.7 29.3
下载: 导出CSV
-
[1] Mahulikar S P, Sonawane H R, Rao G A. Infrared signature studies of aerospace vehicles [J]. Progress in Aerospace Sciences, 2007, 43(7-8): 218-245. doi: 10.1016/j.paerosci.2007.06.002 [2] Rao G A, Mahulikar S P. Integrated review of stealth technology and its role in airpower [J]. The Aeronautical Journal, 2002, 106(1066): 629-642. doi: 10.1017/S0001924000011702 [3] Sonawane H R, Mahulikar S P. Tactical air warfare: Generic model for aircraft susceptibility to infrared guided missiles [J]. Aerospace Science and Technology, 2011, 15(4): 249-260. doi: 10.1016/j.ast.2010.07.008 [4] Rao G A, Mahulikar S P. New criterion for aircraft susceptibility to infrared guided missiles [J]. Aerospace Science and Technology, 2005, 9(8): 701-712. doi: 10.1016/j.ast.2005.07.005 [5] Mahulikar S P, Prasad H S S, Potnuru S K. Infrared signature suppression of helicopter engine duct based on" conceal and camouflage" [J]. Journal of Propulsion and Power, 2008, 24(3): 613-618. doi: 10.2514/1.28636 [6] 宋新波, 吕雪艳, 章建军. 飞机红外隐身技术研究[J]. 激光与红外, 2012, 42(1): 3-7. doi: 10.3969/j.issn.1001-5078.2012.01.001 Song Xinbo, Lv Xueyan, Zhang Jianjun. Study on the infrared stealth technology of plane [J]. Laser & Infrared, 2012, 42(1): 3-7. (in Chinese) doi: 10.3969/j.issn.1001-5078.2012.01.001 [7] Rogalski A. Competitive technologies of third generation infrared photon detectors [J]. Opto-electronics Review, 2006, 14(1): 84-98. doi: 10.1117/12.666882 [8] 王先炜, 孙中海, 匡传树. RAH-66 直升机红外抑制器剖析[J]. 直升机技术, 2008, 37(2): 23-28. doi: 10.3969/j.issn.1673-1220.2008.02.005. Wang Xianwei, Sun Zhonghai, Kuang Chuanshu. The anatomy of RAH-66 helicopter infrared suppressor [J]. Helicopter Technique, 2008, 37(2): 23-28. (in Chinese) doi: 10.3969/j.issn.1673-1220.2008.02.005 [9] Skebe S, Paterson R, Barber T. Experimental investigation of three-dimensional forced mixer lobe flow fields [C]//1st National Fluid Dynamics Conference, 1988: 3785. [10] Zaman K, Wang F Y, Georgiadis N J. Noise, turbulence, and thrust of subsonic freejets from lobed nozzles [J]. AIAA Journal, 2003, 41(3): 398-407. doi: 10.2514/2.1990 [11] 王同辉, 王先炜, 张靖周, 等. 直升机红外抑制器遮挡罩间距对红外辐射特性的影响[J]. 航空动力学报, 2009, 24(7): 1493-1499. doi: CNKI:SUN:HKDI.0.2009-07-011. Wang Tonghui, Wang Xianwei, Zhang Jingzhou, et al. Effect of covering shelter on infrared radiation characteristics of helicopter infrared radiation suppressor [J]. Journal of Aerospace Power, 2009, 24(7): 1493-1499. (in Chinese) [12] Presz W, Werle M. Multi-stage mixer/ejector systems [C]//38 th AIAA/ASME/SAE/ASEE Joint Propulsion Conference & Exhibit, 2002: 4064. [13] 任利锋, 张靖周, 王先炜, 等. 直升机后机身内埋式红外抑制器隐身性能分析[J]. 红外与激光工程, 2011, 40(11): 2091-2097. doi: 10.3969/j.issn.1007-2276.2011.11.005. Ren Lifeng, Zhang Jingzhou, Wang Xianwei, et al. Analysis of stealth properties on IR radiation suppressor embed inside helicopter rear airframe [J]. Infrared and Laser Engineering, 2011, 40(11): 2091-2097. (in Chinese) doi: 10.3969/j.issn.1007-2276.2011.11.005 [14] 陈庚, 谭晓茗, 单勇, 等. 二元弯曲混合管出口结构参数对红外抑制器气动和辐射特性的影响[J]. 红外与激光工程, 2015, 44(6): 1704-1711. doi: 10.3969/j.issn.1007-2276.2015.06.005. Chen Geng, Tan Xiaoming, Shan Yong, et al. Impacts of two-dimensional curved mixing duct exit geometric parameters on flow dynamics and infrared radiation characteristics for IR suppressor [J]. Infrared and Laser Engineering, 2015, 44(6): 1704-1711. (in Chinese) doi: 10.3969/j.issn.1007-2276.2015.06.005 [15] Zheng Zhen. Research on structure of mixing duct in helicopter infrared suppressor[D]. Nanjing: Nanjing University of Aeronautics and Astronautics, 2020. (in Chinese) [16] 蒋坤宏, 张靖周, 单勇, 等. 一体化红外抑制器遮挡和出口修型对抑制器表面温度和红外辐射特性的影响[J]. 航空学报, 2020, 41(2): 152-162. doi: 10.7527/S1000-6893.2019.23497. Jiang Kunhong, Zhang Jingzhou, Shan Yong, et al. Effects of sheltering and outlet shaping on surface temperature and infrared radiation characteristics of rear airframe with an intedrating infrared suppressor [J]. Acta Aeronautica et Astronautica Sinica, 2020, 41(2): 152-162. (in Chinese) doi: 10.7527/S1000-6893.2019.23497 [17] Yang Zhongyao, Zhang Jingzhou, Shan Yong. Effects of forward-flight speed on plume flow and infrared radiation of IRS-integrating helicopter [J]. Chinese Journal of Aeronautics, 2022, 35(3): 155-168. (in Chinese) doi: 10.1016/j.cja.2021.07.037 [18] Pan Chengxiong, Zhang Jingzhou, Shan Yong. Modeling and analysis of helicopter thermal and infrared radiation [J]. Chinese Journal of Aeronautics, 2011, 24(05): 558-567. doi: 10.1016/S1000-9361(11)60065-4 [19] Liu J. Investigation on infrared signatures of axisymmetric vectoring exhaust nozzle and effectiveness evaluation of aircraft infrared stealth[D]. Nanjing: Nanjing University of Aeronautics and Astronautics, 2017. (in Chinese) -

 点击查看大图
计量
- 文章访问数: 78
- HTML全文浏览量: 19
- PDF下载量: 29
- 被引次数: 0

