


 下载:
下载:


-
随着现代光学技术的飞速发展,光学系统在军事侦察、天文光学等领域的应用越来越广泛,为了确保光学系统的成像质量满足要求,系统中的各光学元件在全频段均需达到高精度。子孔径拼接干涉检测作为一种有效的光学检测技术[1],因其具有拓展干涉仪的横向和纵向动态范围;无需其他辅助元件即可实现对大口径平面、球面、非球面的面形检测;成本低、分辨率高等优势对各个领域的检测应用研究有着十分重要的意义。在对光学元件进行检测的过程中,由于其表面缺陷和实际加工过程中所产生的残差,导致其表面矢高的实际分布和理论面形之间存在不同程度的偏差。想要准确地获得光学元件的面形偏差,就要求检测仪器能在空间频率上反映其加工误差。由于仪器传递函数(Instrument Transfer Function, ITF)能够准确反映出干涉仪在空间频率上的响应特征,被列为一项重要指标。
20世纪90年代,美国Zygo、Wyko公司及Peter Z T等人率先提出制造标准位相台阶板,通过检测其波前数据计算功率谱密度,再与理想功率谱密度做比的方法,得到其ITF[2]。2007年,法国原子能委员会为检测干涉仪传递函数,刻蚀了不同周期正弦相位的平面测试板[3]。2008年,中国成都精密光学工程研究中心的徐建程等人,通过台阶相位板对大口径干涉仪系统传递函数进行校准,并得出了其ITF[4]。2010年,韩国三星电子株式会社同美国国家标准与技术研究院等使用具有不同空间频率子区域组成的测试板对相移干涉仪的传递函数进行了评估[5]。2017年,中国工程物理研究院机械制造工艺研究所的刘乾等人通过标准台阶测试板对白光干涉仪的ITF进行了分析及其非线性研究[6]。2018年,Torsten Glaschke等人使用标准台阶相位板标定了激光斐索干涉仪的ITF[7]。
但上述方法所提及的平面测试板仅能实现平面检测时ITF的标定工作[8],针对高陡度球面/非球面镜检测时的ITF标定,文中设计了一种球面台阶测试板,并对子孔径拼接仪检测高陡度镜面时的ITF进行了标定。
-
ITF来源于传递函数,传递函数将独立标量输入映射到从属标量输出,通常适用于线性时不变或空间移位不变系统。对于单变量的系统,其传递函数为输入、输出的放大系数加上偏移常数的组合。ITF的目的是描述生成表面形貌图的完整过程,与仪器类型无关。光学形貌测量涉及多种原理,包括聚焦效应、三角测量、飞行时间和干涉测量法等,检测表面高度的差异[9]。虽然光学成像系统的滤波特性在确定仪器响应方面发挥着重要作用,但ITF与传统成像的系统MTF完全不同。根据国际标准化组织文件ISO 25178-600-2019,ITF被定义为一条描述面形检测系统在不同空间频率下对于面形检测高度的响应曲线。
采用频率分析法,可将仪器响应量化为代表输入的傅里叶分量的正弦基函数,由x、y平面上的表面空间频率和z方向上的幅度参数化。ITF可表示为相应空间频率的输出和输入所分解的正弦基底的振幅之比,如下式所示:
$$ ITF(f) = \frac{{{a_{out}}({f_x})}}{{{a_{in}}({f_x})}} $$ (1) 符合该定义的表面轮廓分量方程可写为:
$$ {H_{out}}(x) = {a_{out}}({f_x})\cos [2\pi x{f_x} + {\phi _{out}}({f_x})] $$ (2) $$ {H_{in}}(x) = {a_{in}}({f_x})\cos [2\pi x{f_x} + {\phi _{in}}({f_x})] $$ (3) 式中:${H_{out}}$、${H_{in}}$为x、y、z坐标系的z方向上的输出和输入高度值;x为表面最佳拟合平面中的横向坐标。ITF可定义为x、y平面中的任何方向,若表面形貌是各向同性的,则与方向无关[10]。
将其扩展到复数域,则:
$$ \widetilde {ITF}({f_x}) = ITF({f_x})\exp [i({\phi _{out}}({f_x}) - {\phi _{in}}({f_x}))] $$ (4) 其中,相位项代表了光学检测中的各类像差,若像差过大,使得相位差产生相移,则所测面形会出现完全相反的形貌结果。
在干涉补偿检验中,ITF表征了面形高度以及干涉相位的传递函数,即对干涉仪的ITF进行分析时,需要对面形的高度分布做傅里叶级数变换,从而得到面形在不同空间频率上的分量。
-
标定干涉仪ITF时,可通过检测一个可提供丰富频谱成分的光学元件,将实测面形的功率谱密度与理论值进行比较,得到其ITF,表示为:
$$ ITF({f_x}) = \sqrt {\frac{{{PS D_{mea}}({f_x})}}{{{PS D_{ide}}({f_x})}}} $$ (5) 式中:${PS D_{mea}}({f_x})$ 、${PS D_{ide}}({f_x})$ 分别为实测及理论功率谱密度。
在评价光学表面面形时,功率谱密度的定义为波面频率分量傅里叶频谱振幅的平方[11-12],其一维形式为:
$$ PS D({f_x}) = \frac{{|F({f_x}){|^2}}}{L} $$ (6) 式中:$L$为采样长度;$F({f_x})$ 为光学元件表面轮廓的傅里叶级数变换。
$$ F({f_x}) = \displaystyle\int_{ - \textstyle\frac{L}{2}}^{\textstyle\frac{L}{2}} {z(x)\exp ( - j2\pi x{f_x})} $$ (7) 对于干涉仪面形检测,所获得的面形数据并非连续的空间函数,而是离散矩阵形式,对于离散数据,PSD可表示为:
$$\begin{split} {PS D}_{1}(m)&=\frac{\Delta l}{N}{\left|{\displaystyle \sum _{n=0}^{N-1}z(n)\mathrm{exp}(-j2\pi nm/N)}\right|}^{2},\\ &-N / 2 \leqslant m \leqslant N / 2 \end{split}$$ (8) 式中:$N$为采样点数;$\Delta l$为采样间隔;$m$为频率离散自变量;$z(n)$为被测波面的采样点数据。
-
干涉仪检测过程中所采用的标准镜不同,其ITF亦会存在一定的差异。球面台阶测试板面形参数需与待检镜保持一致,以降低影响。若待检镜为高陡度球面镜,则测试板口径及曲率半径与其保持一致;若待检镜为高陡度非球面镜,则对其最接近球面进行求解[13]。
对于任意非球面,均可由下式表示:
$$ {{z}} = f(x,y) $$ (9) 对该非球面进行离散化取值,设非球面离散点为$({x_i},{y_i},{z_i})$,最接近球面球心坐标为$({x_c},{y_c},{z_c})$,最接近球面半径为$R$。由于镜面的对称性,设其沿x轴轴对称,则其最接近球面球心
$$ {x_c} = 0 $$ (10) 则目标函数为:
$$ \Delta = \sum\limits_{i = 1}^N {|{{({x_c} - {x_i})}^2} + {{({y_c} - {y_i})}^2} + {{({z_c} - {z_i})}^2} - {R^2}|} $$ (11) 式中:N为镜面采样点数。通过迭代算法对公式(11)进行求解,即可获得该非球面镜的最接近球面,从而确定球面测试板参数。
测试板表面结构的设计方法主要有具有不同空间频率的台阶阵列、单一或十字交叉的标准台阶等[14-19],但无论哪种结构,对于球面台阶测试板都具有较大的加工难度,同时也容易产生台阶刻线歪曲等问题。文中所设计的球面台阶测试板采用了环形台阶结构,如图1所示,不仅更加符合球面台阶测试板表面特征,同时与超精密车削的加工轨迹保持一致,极大地降低了加工难度。
在进行台阶设计时,若台阶高度或任何其他3D特征接近四分之一波长,即158.2 nm,将不再处于线性相位状态,测量结果无法准确指示真实 ITF,因此将台阶高度设定为100 nm左右。
同时,在干涉仪检测过程中会受衍射效应影响,简单的台阶型相位分布会存在振荡区域,即影响域[20],其大小可表示为:
$$ B({z})=\sqrt{\left(\frac{3}{4}\pi +{n}\cdot \pi \right)\cdot {z}\cdot \pi \cdot \lambda }\text{,}{n}=0,1,2\text{,}\cdots $$ (12) 式中:z为离焦量;n为周期数。即除阈值之外,只有离焦量对影响域产生影响。根据干涉仪检测球面台阶测试板光路,建立光路模型,如图2所示,得到其在干涉仪CCD成像面上离焦量z,从而求得影响域大小为0.2 mm,约占据干涉仪一个像元尺寸。影响域在采样长度中所占比重越大,对ITF的计算带来的偏差就越大,为保证ITF的准确性,环形台阶间距需远大于影响域,通常取其大小的几十倍以降低其干扰,因此台阶间距取为8 mm。

图 1 球面台阶测试板结构图
Figure 1. Structural diagram of spherical step test board

图 2 干涉仪检测球面台阶测试板光路模型
Figure 2. Optical path model of interferometer measuring spherical step test board
-
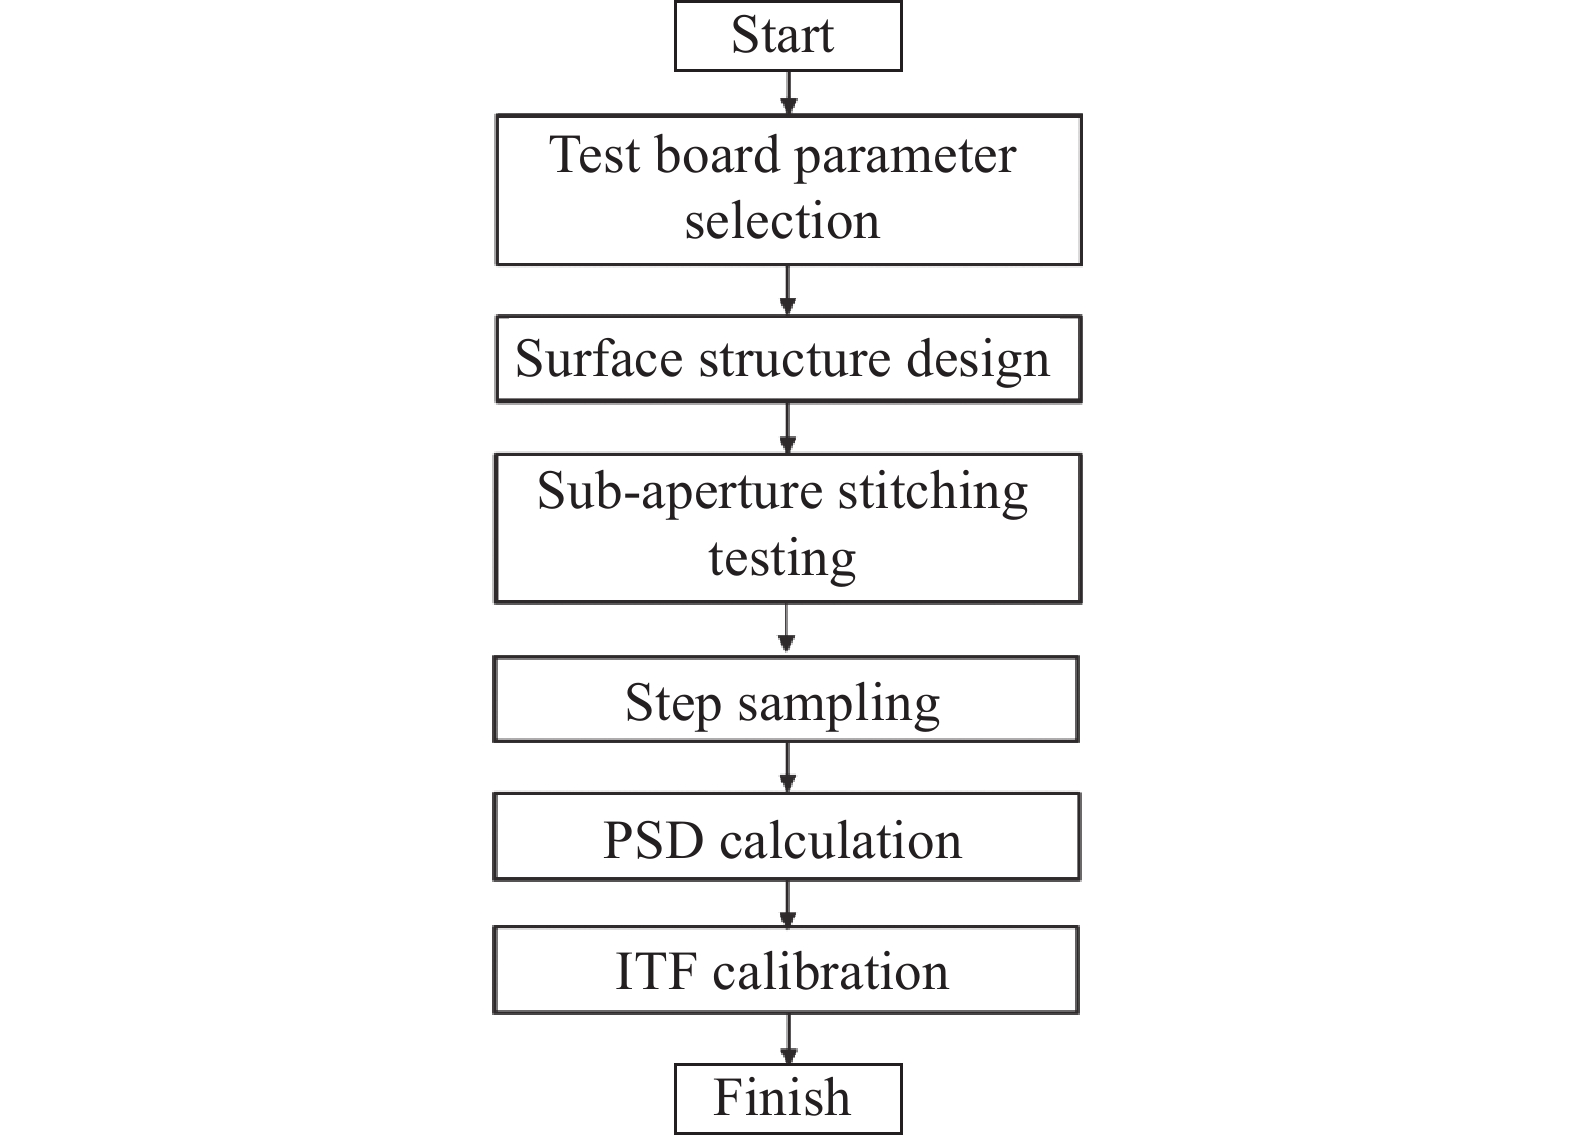
子孔径拼接ITF标定流程如图3所示,首先进行测试板的结构设计和制作,然后对其进行子孔径规划,采用球面标准镜将干涉仪平面检测波转化为球面波,通过调整转台角度及位置,实现球面检测波沿法线方向入射到每个子孔径,从而完成检测。随后对检测孔径进行采样分析,通过功率谱密度法实现ITF标定。

图 3 ITF标定流程
Figure 3. Calibration process of ITF
-
球面台阶测试板口径为100 mm,曲率半径为100 mm,采用F数1.1球面标准镜对其进行检测,计算得到子孔径大小约为90.1 mm,共规划三圈,15个子孔径,中心子孔径位于待检镜中心,一圈子孔径距待检镜中心外移20 mm,二圈子孔径距待检镜中心外移36 mm,如图4(a)所示,每圈子孔径相对测试板台阶位置如图4(b)~(d)所示。

图 4 子孔径规划图
Figure 4. Sub-aperture planning diagram
-
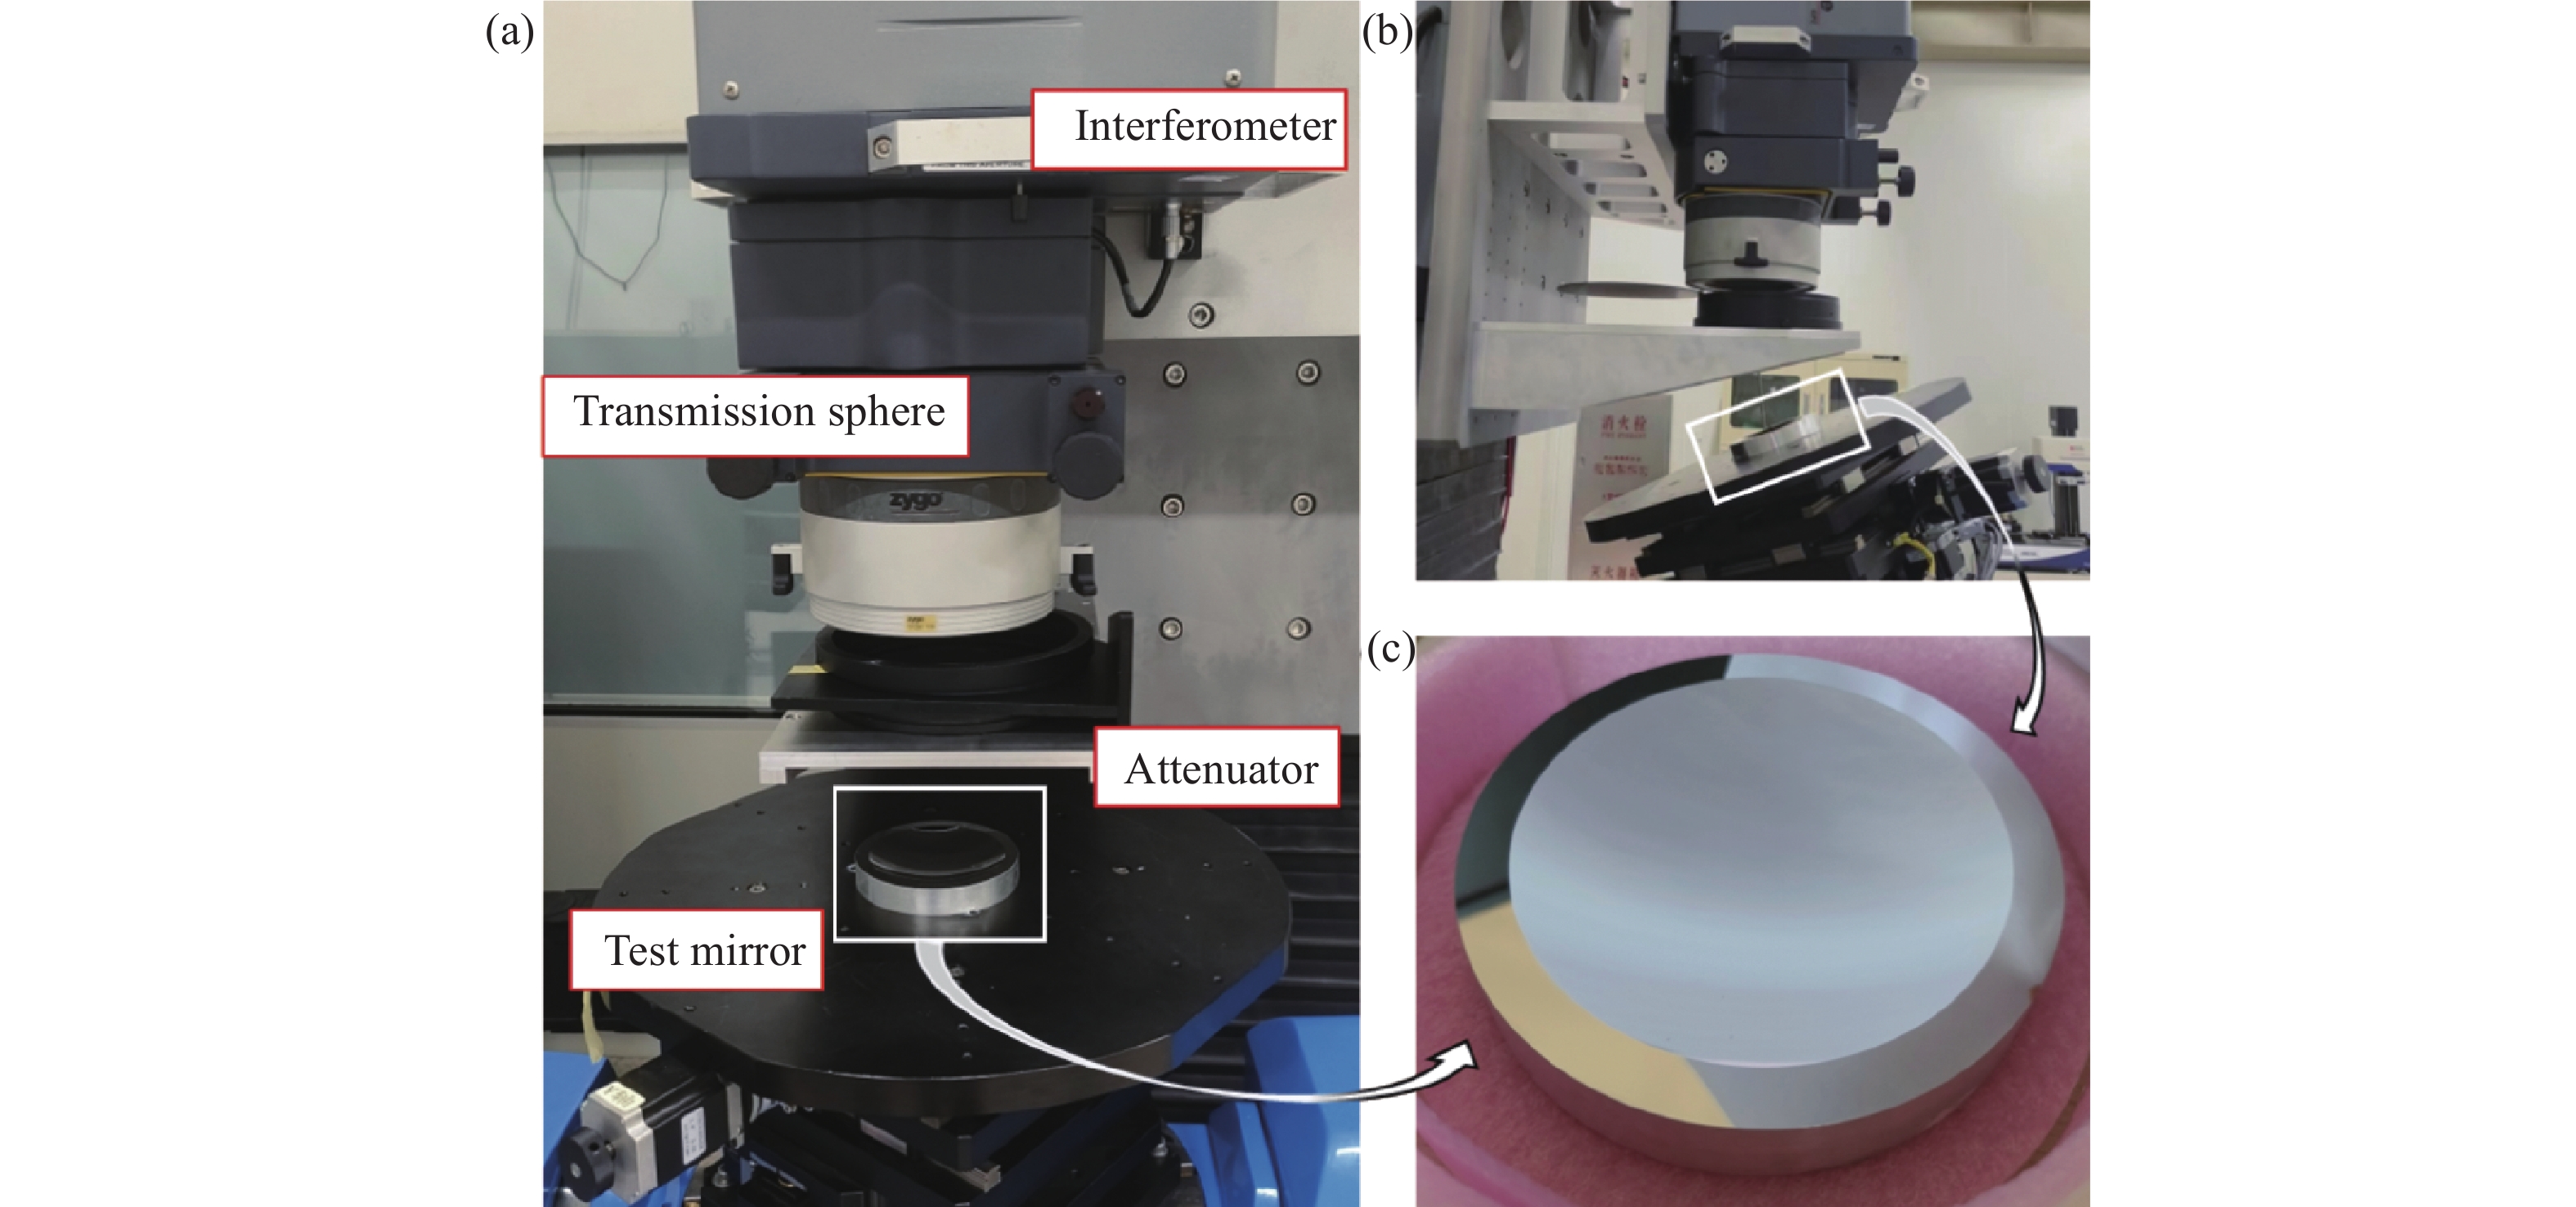
图5为球面台阶测试板的拼接检测系统,由五轴实验平台、标准镜、减光板及干涉仪组成,以满足实验过程中各项需求。

图 5 球面台阶测试板检测系统
Figure 5. Spherical step test board measuring system
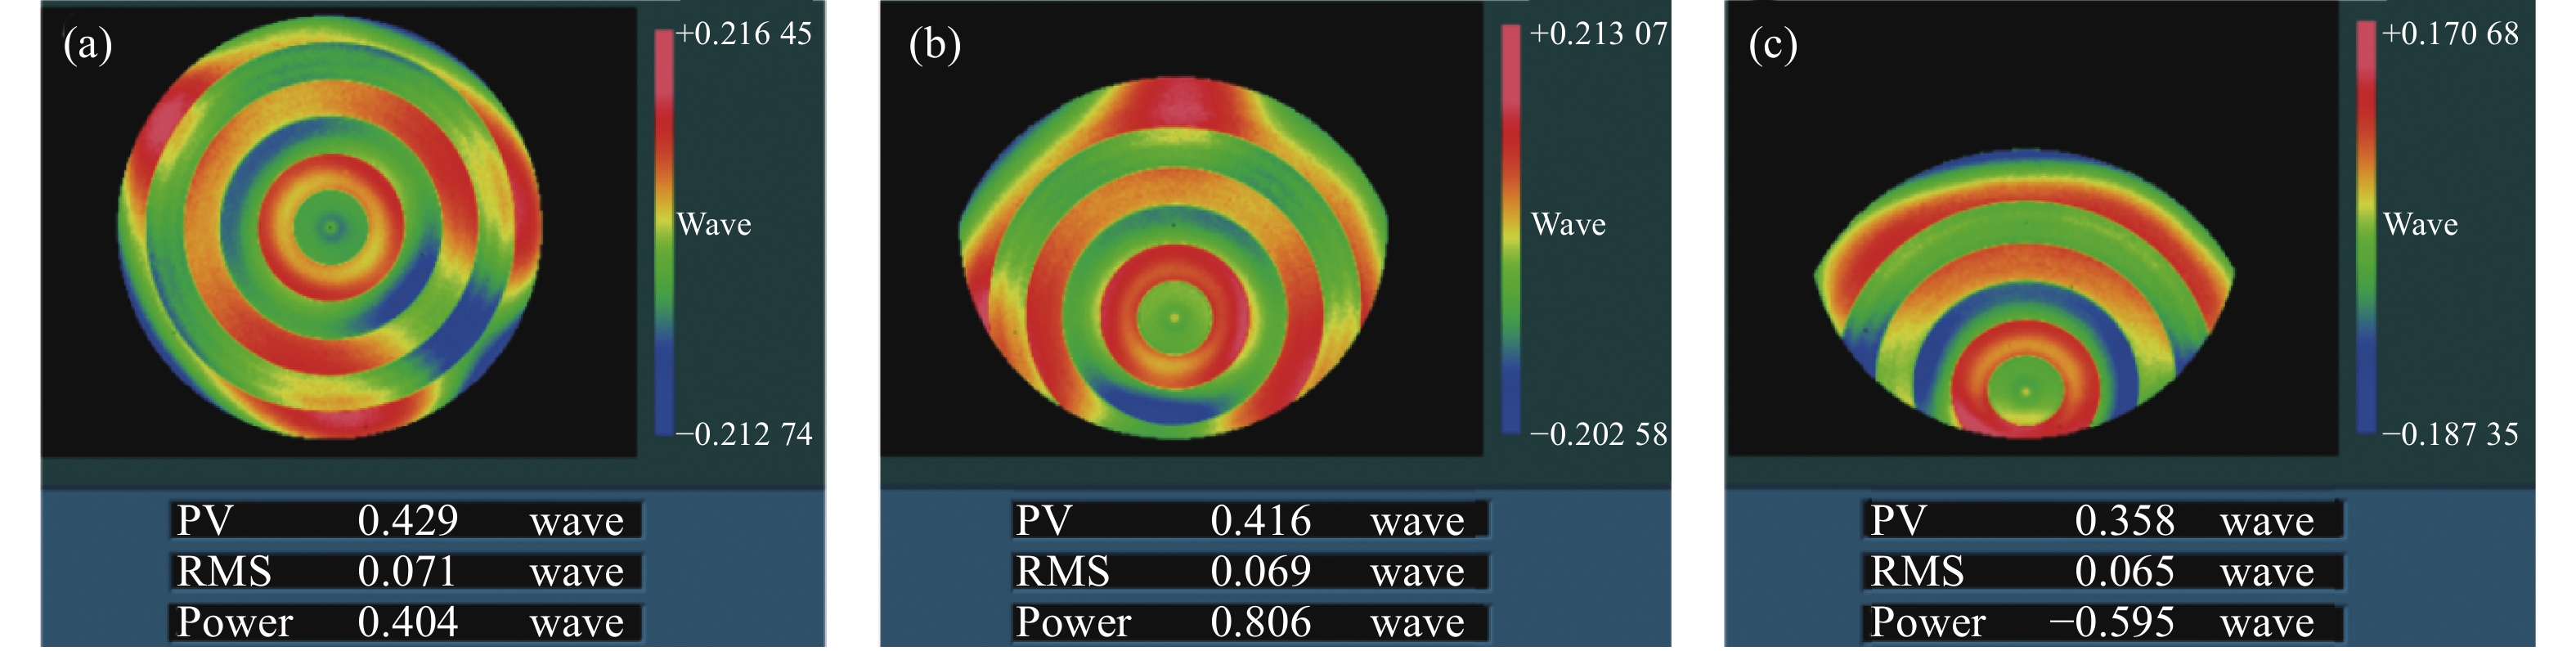
子孔径拼接检测具有回转对称性,每圈子孔径选取一个进行分析便可得到整体ITF分布,选取的检测孔径如图6所示,其中图6(a)为中心子孔径检测图,图6(b)为选取的第一圈子孔径检测图,图6(c)为选取的第二圈子孔径检测图。

图 6 子孔径拼接检测图。 (a) 中心子孔径;(b)第一圈子孔径;(c)第二圈子孔径
Figure 6. Sub-aperture stitching testing images. (a) Central sub-apertures; (b) First ring sub-apertures; (c) Second ring sub-apertures
-
选取中心子孔径及每圈外圈子孔径中的一个孔径检测图进行分析,采用梯度定位法获得每个台阶的位置。构建过环形台阶结构圆心的采样线,从而使其与环形台阶垂直,通过旋转矩阵使采样线进行小角度旋转,实现对所检测台阶的多次采样。如图7(a)所示,取其平均值作为该台阶实测值,如图7(b)所示,绕任意点旋转的旋转矩阵可表示为:
$$ R(\theta ) = \left[ {\left. {\begin{array}{*{20}{c}} {\cos \theta + (1 - \cos \theta ){A_x}^2}&{(1 - \cos \theta ){A_x}{A_y} - \sin \theta {A_z}}&{(1 - \cos \theta ){A_x}{A_z} + \sin \theta {A_y}} \\ {(1 - \cos \theta ){A_x}{A_y} + \sin \theta {A_z}}&{\cos \theta + (1 - \cos \theta ){A_y}^2}&{(1 - \cos \theta ){A_y}{A_z} - \sin \theta {A_x}} \\ {(1 - \cos \theta ){A_x}{A_z} - \sin \theta {A_y}}&{(1 - \cos \theta ){A_y}{A_z} + \sin \theta {A_x}}&{\cos \theta + (1 - \cos \theta ){A_z}^2} \end{array}} \right]} \right. $$ (13) 
图 7 台阶轮廓图。 (a)多次采样的台阶轮廓图;(b)平均台阶轮廓
Figure 7. Step contour images. (a) Step contour image obtained from multiple sampling; (b) Average step contour image
对其做傅里叶变换,求得功率谱密度,并将其与理想面形功率谱密度做对比,得到各处ITF分布。由于存在较强的背景噪声,ITF曲线部分区域出现起伏,使其数值大于1,但整体趋势符合规律。同时,由于有限台阶宽度所产生的边缘效应的影响,ITF的计算出现了误差,在频率较高的区域产生了波动,如图8所示,图8(a)依次为中心子孔径从中心到边缘五个台阶的ITF曲线,图8(b)依次为第一圈子孔径从上到下7个台阶的ITF曲线,图8(c)依次为第二圈子孔径从上到下5个台阶的ITF曲线。

图 8 ITF。 (a)中心子孔径ITF;(b)第一圈子孔径ITF;(c)第二圈子孔径ITF
Figure 8. ITF. (a) ITF of central sub-apertures; (b) ITF of first ring sub-apertures; (c) ITF of second ring sub-apertures
在各子孔径的ITF标定曲线图中,不同台阶的ITF具有一定的差异,这是由于超精密车削技术在加工台阶时并不稳定,镜面陡度较大的表面会使加工过程中的振动和共振风险增大,导致台阶过渡区形貌有好有坏,而功率谱密度法对台阶形貌要求较高,因此形貌较差的台阶在进行ITF标定时会出现偏差;且不同台阶所处位置不同,陡度越大的位置以及越靠近检测孔径边缘的位置越容易在干涉检测时引起干涉图案的失焦、波前畸变等问题,影响检测结果的准确性,即ITF曲线相对较差。
结果表明,子孔径拼接仪在空间频率为1 mm−1时,ITF平均可达82.72%,具有良好的检测精度。随着空间频率进一步提高,ITF发生急剧衰减,当空间频率达到1.5 mm−1时,平均为53.9%,对光学元件该频段信息的检测可信度较低。
-
基于平面测试板无法实现拼接检测高陡度球面/非球面时ITF标定的问题,提出了设计球面测试板对干涉仪进行标定的方法。阐述了球面台阶测试板的设计原理和表面参数选取依据,对其进行拼接检测,通过功率谱密度法依次对每圈子孔径的ITF进行计算,从而完成整体标定。结果表明,干涉仪对低中频信息的传递能力较好,随着空间频率不断升高,在1.5 mm−1处,ITF仅能达到53.9%,对信息传递的准确性较低,即该频段的面形检测信息同待检镜真实面形相比会出现较大偏差。根据ITF标定结果,可以更加直观地判断干涉仪对各频段信息的检测能力,为实现高陡度镜面高精度的拼接检测奠定了基础。
Transfer function calibration of sub-aperture stitching instrument for high steep mirror testing (invited)
-
摘要: 由于仪器传递函数(Instrument Transfer Function, ITF)能准确反映仪器在空间频率上的响应特征,被广泛应用于仪器规范之中。目前多采用刻有单一台阶特征或不同周期正弦特征的平面测试板对干涉仪的ITF进行检测。针对平面测试板无法完成高陡度球面/非球面镜检测时ITF标定的问题,提出了根据球面台阶测试板标定高陡度镜面检测的子孔径拼接ITF的方法。通过超精密车削技术制作了球面台阶测试板,并对其进行拼接检测,根据梯度定位法和旋转矩阵完成检测孔径中台阶的定位及采样,利用傅里叶变换方法实现对台阶实测面形的功率谱密度求解,最后与理想面形功率谱密度做比获得ITF。对口径100 mm、曲率半径100 mm、带有同心圆环台阶结构的球面台阶测试板进行拼接检测以及数据分析,实验结果表明:在1 mm−1的空间频率范围内,各个子孔径对高陡度镜面的检测水平平均可达到82.72%,具有较好的检测精度,随后ITF逐渐衰减,当空间频率在1.5 mm−1左右时,仅能达到40%~60%。Abstract:
Objective The instrument transfer function, which accurately reflects the instrument's response characteristics in spatial frequency, is widely used in instrument specifications. Currently, flat test boards engraved with single-step features or sinusoidal features of different periods are commonly used to measure the instrument transfer function of interferometers. However, when it comes to calibrating the instrument transfer function for high-steep spherical/non-spherical mirror testing, there is an issue with using flat test boards. Methods To address this problem, a method is proposed to calibrate the instrument transfer function for high-steep mirror testing on spherical surfaces using sub-aperture stitching, based on a spherical step test board. The spherical step test board is manufactured using ultra-precision turning technology, and the steps within the measuring apertures are located and sampled using gradient localization and rotation matrix operations. The power spectral density of the measured surface shape of the steps is obtained using Fourier transform methods, and then compared with the power spectral density of an ideal surface shape to obtain the instrument transfer function. Results and Discussions By combining examples, a spherical step test board with a diameter of 100 mm, a curvature radius of 100 mm, and concentric circular step structures was subjected to stitching testing and data analysis. The experimental results show that within the spatial frequency range of 1 mm−1, the average testing level of each sub-aperture for high-steep mirrors can reach 82.72%, indicating a good testing accuracy. However, as the spatial frequency approaches 1.5 mm−1, the testing level decreases to only 40%−60% for each sub-aperture, indicating poorer performance of the instrument transfer function. Conclusions This article proposes a method for calibrating the sub-aperture stitching instrument transfer function of high-steep mirror surfaces using a designed spherical step test board. In this method, a spherical test board with concentric circular ring step structure is used, which allows for the calculation of the instrument transfer function at different positions of each sub-aperture. The testing accuracy of each sub-aperture can be obtained, thereby achieving the overall calibration of the instrument transfer function. -
图 2 干涉仪检测球面台阶测试板光路模型
Figure 2. Optical path model of interferometer measuring spherical step test board
图 6 子孔径拼接检测图。 (a) 中心子孔径;(b)第一圈子孔径;(c)第二圈子孔径
Figure 6. Sub-aperture stitching testing images. (a) Central sub-apertures; (b) First ring sub-apertures; (c) Second ring sub-apertures
图 7 台阶轮廓图。 (a)多次采样的台阶轮廓图;(b)平均台阶轮廓
Figure 7. Step contour images. (a) Step contour image obtained from multiple sampling; (b) Average step contour image
-
[1] 闫力松, 张斌智, 王孝坤等. 平面镜子孔径加权拼接检测算法(特邀)[J]. 红外与激光工程, 2021, 50(10): 20210520. doi: 10.3788/IRLA20210520 Yan Lisong, Zhang Binzhi, Wang Xiaokun, et al. Subaperture stitching testing to flat mirror based on weighting algorithm (Invited) [J]. Infrared and Laser Engineering, 2021, 50(10): 20210520. (in Chinese) doi: 10.3788/IRLA20210520 [2] Peter Z T, Michelle X O L, et al. A step-height standard for surface profiler calibration [C]//Proceedings of SPIE, 1993, 1993: 65-74. [3] Bouillet S, Daurios J. Using phase objects to qualify the transfer function of Fizeau interferometers for high spatial frequencies [C]//Proceedings of SPIE, 2007, 6616: 661628. [4] 徐建程, 许乔, 彭翰生. 大口径干涉仪系统传递函数的修正和校准[J]. 强激光与粒子束, 2008, 20(08): 0. Xu Jiancheng, Xu Qiao, Peng Hansheng. Revision and calibration of system transfer function for large-aperture interferometer [J]. High Power Laser and Particle Beams, 2008, 20(8): 1293-1296. (in Chinese) [5] Chu J, Wang Q, Lehan J P, et al. Spatially resolved height response of phase-shifting interferometers measured using a patterned mirror with varying spatial frequency [J]. Optical Engineering, 2010, 49(9): 095601. doi: 10.1117/1.3488052 [6] 刘乾, 袁道成, 何华彬, 吉方. 白光干涉仪传递函数的成因分析及其非线性研究[J]. 红外与激光工程, 2017, 46(6): 634002-0634002(6). doi: 10.3788/IRLA201746.0634002 Liu Qian, Yuan Daocheng, He Huabin, et al. Determination and nonlinearity study of instrument transfer function of white light interferometer [J]. Infrared and Laser Engineering, 2017, 46(6): 0634002. (in Chinese) doi: 10.3788/IRLA201746.0634002 [7] Glaschke T, Deck L L, Groot P J. Characterizing the resolving power of laser fizeau interferometers [C]//Proceedings of SPIE, 2018, 10829: 1082905. [8] 王孝坤, 戚二辉, 胡海翔等. 超大口径平面反射镜的光学检测(特邀)[J]. 红外与激光工程, 2022, 51(1): 20210953–7. Wang Xiaokun, Qi Erhui, Hu Haixiang, et al. Optical testing of the super-large plane mirror (invited) [J]. Infrared and Laser Engineering, 2022, 51(1): 20210953. (in Chinese) [9] Groot P J. The instrument transfer function for optical measurements of surface topography [J]. Journal of Physics: Photonics, 2021, 3(2): 024004. doi: 10.1088/2515-7647/abe3da [10] Dai G, Jiao Z, Xiang L, et al. A novel material measure for characterising two-dimensional instrument transfer functions of areal surface topography measuring instruments [J]. Surface Topography: Metrology and Properties, 2020, 8(4): 045025. doi: 10.1088/2051-672X/abc9d2 [11] 张磊, 程鑫彬, 张锦龙等. 光学表面功率谱密度的表征[J]. 红外与激光工程, 2015, 44(12): 3707-3712. doi: 10.3969/j.issn.1007-2276.2015.12.035 Zhang Lei, Cheng Xinbin, Zhang Jinlong, et al. Characterization of power spectral density of optical surface [J]. Infrared and Laser Engineering, 2015, 44(12): 3707-3712. (in Chinese) doi: 10.3969/j.issn.1007-2276.2015.12.035 [12] 许乔, 顾元元, 柴林, 李伟. 大口径光学元件波前功率谱密度检测[J]. 光学学报, 2001, 21(3): 344. doi: 10.3321/j.issn:0253-2239.2001.03.020 Xu Qiao, Gu Yuanyuan, Chai Lin, et al. Measurement of wavefront power spectral density of large optical components [J]. Acta Optica Sinica, 2001, 21(3): 344. (in Chinese) doi: 10.3321/j.issn:0253-2239.2001.03.020 [13] 闫力松. 子孔径拼接干涉检测光学镜面算法的研究[D]. 中国科学院研究生院(长春光学精密机械与物理研究所), 2015. Yan Lisong. Research on the algorithm testing optical mirror by subaperture stitching interferometry[D]. Changchun: University of Chinese Academy of Sciences (Changchun Institute of Optics, Fine Mechanics and Physics, Chinese Academy of Sciences), 2015. (in Chinese) [14] Jain S, Davies A D. Estimating uncertainty for the instrument transfer function measurement of 3D scanners [J]. Applied Optics, 2022, 61(14): 4087. doi: 10.1364/AO.444640 [15] Anderson E H. Calibration of the modulation transfer function of surface profilometers with binary pseudorandom test standards: expanding the application range to Fizeau interferometers and electron microscopes [J]. Optical Engineering, 2011, 50(9): 093604. doi: 10.1117/1.3622485 [16] Lehmann P, Tereschenko S, Xie W. Fundamental aspects of resolution and precision in vertical scanning white-light interferometry [J]. Surface Topography: Metrology and Properties, 2016, 4(2): 024004. doi: 10.1088/2051-672X/4/2/024004 [17] 王陈, 孟宪昱, 于瀛洁等. 三维微纳米台阶高精度光学显微测量量化表征[J]. 光学精密工程, 2022, 30(06): 651-658. doi: 10.37188/OPE.20223006.0651 Wang Chen, Meng Xianyu, Yu Yingjie, et al. High-accuracy characterization of areal micro-nano steps measured with optical microscopes [J]. Optics and Precision Engineering, 2022, 30(6): 651-658. (in Chinese) doi: 10.37188/OPE.20223006.0651 [18] 冯亚南, 李锁印, 韩志国等. 纳米台阶高度标准样块的研制与评价[J]. 宇航计测技术, 2016, 36(5): 63-66+88. Feng Yanan, Li Suoyin, Han Zhiguo. Development and evaluation of nanometer step height standard specimens [J]. Journal of Astronautic Metrology and Measurement, 2016, 36(5): 63-66, 88. (in Chinese) [19] Seewig J, Eifler M, Wiora G. Unambiguous evaluation of a chirp measurement standard [J]. Surface Topography: Metrology and Properties, 2014, 2(4): 045003. doi: 10.1088/2051-672X/2/4/045003 [20] 吕思达. 干涉检测的相干成像像差理论研究与分析验证[D]. 中国科学院大学(中国科学院长春光学精密机械与物理研究所), 2022. Lv Sida. Theoretical research and analysis verification of coherent imaging aberration in interferometry [D]. Changchun: University of Chinese Academy of Sciences (Changchun Institute of Optics, Fine Mechanics and Physics, Chinese Academy of Sciences), 2022. (in Chinese) -

 点击查看大图

计量
- 文章访问数: 140
- HTML全文浏览量: 31
- PDF下载量: 44
- 被引次数: 0

