


-
海洋认知已经从表面观测进入立体探测时代。剖面探测是研究全球海洋光学和生物参数的三维剖面分布规律、海洋碳和能量循环的重要基础和手段,是认知海洋环境现状、保障海洋生态文明建设、支撑“双碳”战略的重要基石的必要信息。根据全球海洋观测系统委员会CEOS提出31个核心海洋观测变量,涉及的重要海洋剖面要素包括深度、温度、盐度、光学参数等。海洋资料的匮乏和海洋观测数据获取手段的不足,特别是缺乏全球尺度的水下多要素剖面数据,已经成为全面认识和了解海洋从而建设海洋强国的瓶颈问题。目前,海洋剖面遥感探测主要依赖接触式实测或机载探测,受限于地域、以及不能稳定获取长时间序列测点数据,星载海洋剖面多要素探测技术作为大范围覆盖、可连续观测、不受地域限制的光学遥感手段,成为解决以上问题的重要途径。
星载海洋光学遥感探测载荷和星载微波雷达技术,经过多年发展分别在水深、海表温度和海表盐度要素探测方面取得进展 [1-9]。激光雷达主动光学水深遥感基于蓝绿激光良好的海水穿透特性,成为解决海洋剖面探测的一种重要手段 [10-11]。2018年,美国NASA发射 ICESat-2卫星上搭载了单光子激光雷达(ATLAS),采用532 nm波段的激光,白天测得清洁海水最大水深可达 19.5 m,夜间测得的清洁海水最大水深可达42.7 m,对于沿海浑浊水体最大水深分别为7.5 m,和10.1 m[12]。为了弥补单一的激光探测手段难以满足大面积、高密度的海洋测深数据应用需求,Hsu等结合 ICESat-2和Senital-2光学数据的蓝绿波段,使用线性、多项式、指数3个半经验模型,得出南海6个岛屿和珊瑚礁的浅水深(深度<20 m)[13]。2018年南京大学程亮团队在南海岛屿开展了激光雷达点云结合被动多光谱数据的联合水深反演,实现20~30 m清洁水体反演;2020年,海洋三所陈本清团队利用ICESat-2激光雷达数据和GeoEye-1/GF-2多光谱数据进行了主被动融合水深反演,实现15~20 m水深反演 [14-16]。2010年NASA发射的“宝瓶座”Aquarius卫星的设计值为月平均0.2 psu@100 km,目前仅能测量海表情况[17]。激光光谱探测可实现水下温盐要素剖面探测,2004—2011 年期间,德国达姆施塔特工业大学的T. Walther团队用布里渊散射方法测量海水温度,通过频移测量的温度精度最高能达到0.1 K以上,深度分辨1 m,声速测量精度3 m/s。2010年,日本的Asahara等人用布里渊散射的方法,测量了900 K 高温、25 GPa高压情况下水中的声速值,表明了布里渊散射技术可以应用到深海和地幔状况中[18]。
综上所述,海洋遥感探测是面向多要素相互作用、垂直结构分化、时间变化不均一、跨域多介质传输的复杂体系,探测要素多、难度大、范围广、时间长,而星载平台具有不受国界限制、大范围、长时间获取信息的优势,是进行海洋观测的最佳平台。目前传统多载荷协同观测或星地联动的观测模式能够获取分时分区域的多要素信息,海洋剖面温、盐、深多要素的一体化探测仍处于空白,水下光学生物参数与物理化学参数的非可同源、非同域、非同时的探测数据反演一致与准确度差,无法有效获取海洋三维立体结构满足科学研究需求。光学遥感反演水深可有效地实现大范围的浅海水深宏观动态观测但探测深度、精度不足,主动光学水深遥感难以兼顾高精度大深度与高密度大范围。面向未来海洋剖面多要素包括深度、温度、盐度信息,需要解决高灵敏、高精度、高密度、大范围兼顾的难题,文中通过对海洋剖面多要素探测任务需求,经过系统指标分析与论证,提出一种新型的星载近海岸剖面多要素探测技术方案,采用主被动复合探测,激光能量与光谱同步探测体制相集合,利用超大口径可折叠光学主镜保证水下微弱信号高效搜集,利用激光光谱通道获得全部弹性与非弹性散射光谱,高精度辨别和解耦水中分子与粒子散射信号,从而获得更加精确的激光雷达后向散射系数,具备水下温度、盐度、深度、光学后向散射系数等多要素探测能力,数据的同源同域同时性好。
-
为满足未来星载海洋剖面要素立体结构,文中构建集多光谱影像、激光能量与激光光谱为一体的“图、深、谱”复合立体探测系统,利用激光能量-光谱联合测量+多光谱影像进行多源数据融合获得广域高精度的水深及水底地形、海洋环境剖面信息,如图1所示。
其中被动光谱探测实现广域、高分辨率的海表多要素信息的探测。
激光主动能量探测,实现高精度、大深度的水下地形及海洋光学生物参数剖面信息探测。
激光光谱探测,通过精细光谱测量来提升海洋光学生物参数剖面、温度盐度剖面的反演精度,核心鉴频系统拟采用费佐干涉仪来实现瑞利米散射与布里渊散射谱的分离。

图 1 探测体制示意图
Figure 1. Schematic diagram of detection system
-
星载海洋剖面多要素探测系统指标如表1所示,主要功能指标包括海水深度、光学后向散射系数、温度、盐度。
表 1 系统指标参数
Table 1. System indicator parameters
No. Category Target Application 1 Orbital height ≥400 km Efficient global measurement of ocean parameters 2 Depth of ocean profile ≥100 m Acquisition of underwater topography and profile information of ocean 3 Depth of shore profile ≥4/Kd Acquisition of underwater topography and profile information of shore 4 Vertical resolution ≤0.5 m Vertical hierarchical information 5 Backscatter measurement error ≤25% Water quality inversion and monitoring 6 Temperature profile error ≤0.5 ℃ Global climate projections, air-sea interaction research, marine biology protection 7 Salinity profile error ≤1 psu Aquaculture, sea water chemical industry -
综合考虑了大气透过率、地物的反射率、海水透过窗口、制造大功率激光器的技术成熟度和激光接收器件的响应谱段范围等因素,如图2所示,激光波长选择532 nm和486 nm用于探测水体及水底,激光工作物质选用Nd:YAG。

图 2 海水的光学透过窗口与激光工作物质材料的选择
Figure 2. The optical transmittance window of seawater and the selection of laser working materials
-
激光器的发散角在2~4 mrad,以星载400 km轨道高度核算,到达地面的光斑直径约1000 m。为了实现更远距离探测,光斑能量不宜扩散,根据雷达方程可知,在激光发射功率和接收口径一定的情况下,需要对激光发散角进行压缩,采用发射望远镜对光束进行准直扩束使发散角压缩到0.03 mrad,足印光斑直径在12 m左右,可以满足探测精度。

图 3 接收视场角的计算示意图
Figure 3. Schematic diagram of receiving FOV calculation
-
在系统设计时,应根据卫星运行速度、和激光渡越时间对激光发射和接收视场进行匹配设计,如图3所示。一般可以采用两种方法:1)扩大接收视场,覆盖光斑偏离区域。这种方法所需的接收视场较大。2)将发射方向设置固定的沿轨方向的向前偏移角度补偿回波滞后接收带来的位移问题。这种方法所需的接收视场较小,但是装调比较困难。本方案按照方式1)设计计算。卫星星下点飞行速度为7.24 km/s,激光发射到回波接收共计2.67 ms,接收系统光轴对应的地面中心位置偏离了激光足印中心位置19.33 m,另外考虑激光足印尺寸约为12 m,经过计算,采用增大视场方式,光学接收视场大于60 μrad即可。
由于不同水深激光散射信号的扩散情况不同,需要根据水深设置不同的视场大小以满足最佳探测性能,辨别力因子可衡量激光雷达探测的性能[19],根据辨别力因子估算,水深0~40 m (浅水)回波信号的最佳视场角0.12 mrad,对于水深40~100 m (深水)回波信号最佳视场角0.2 mrad,如图4所示。
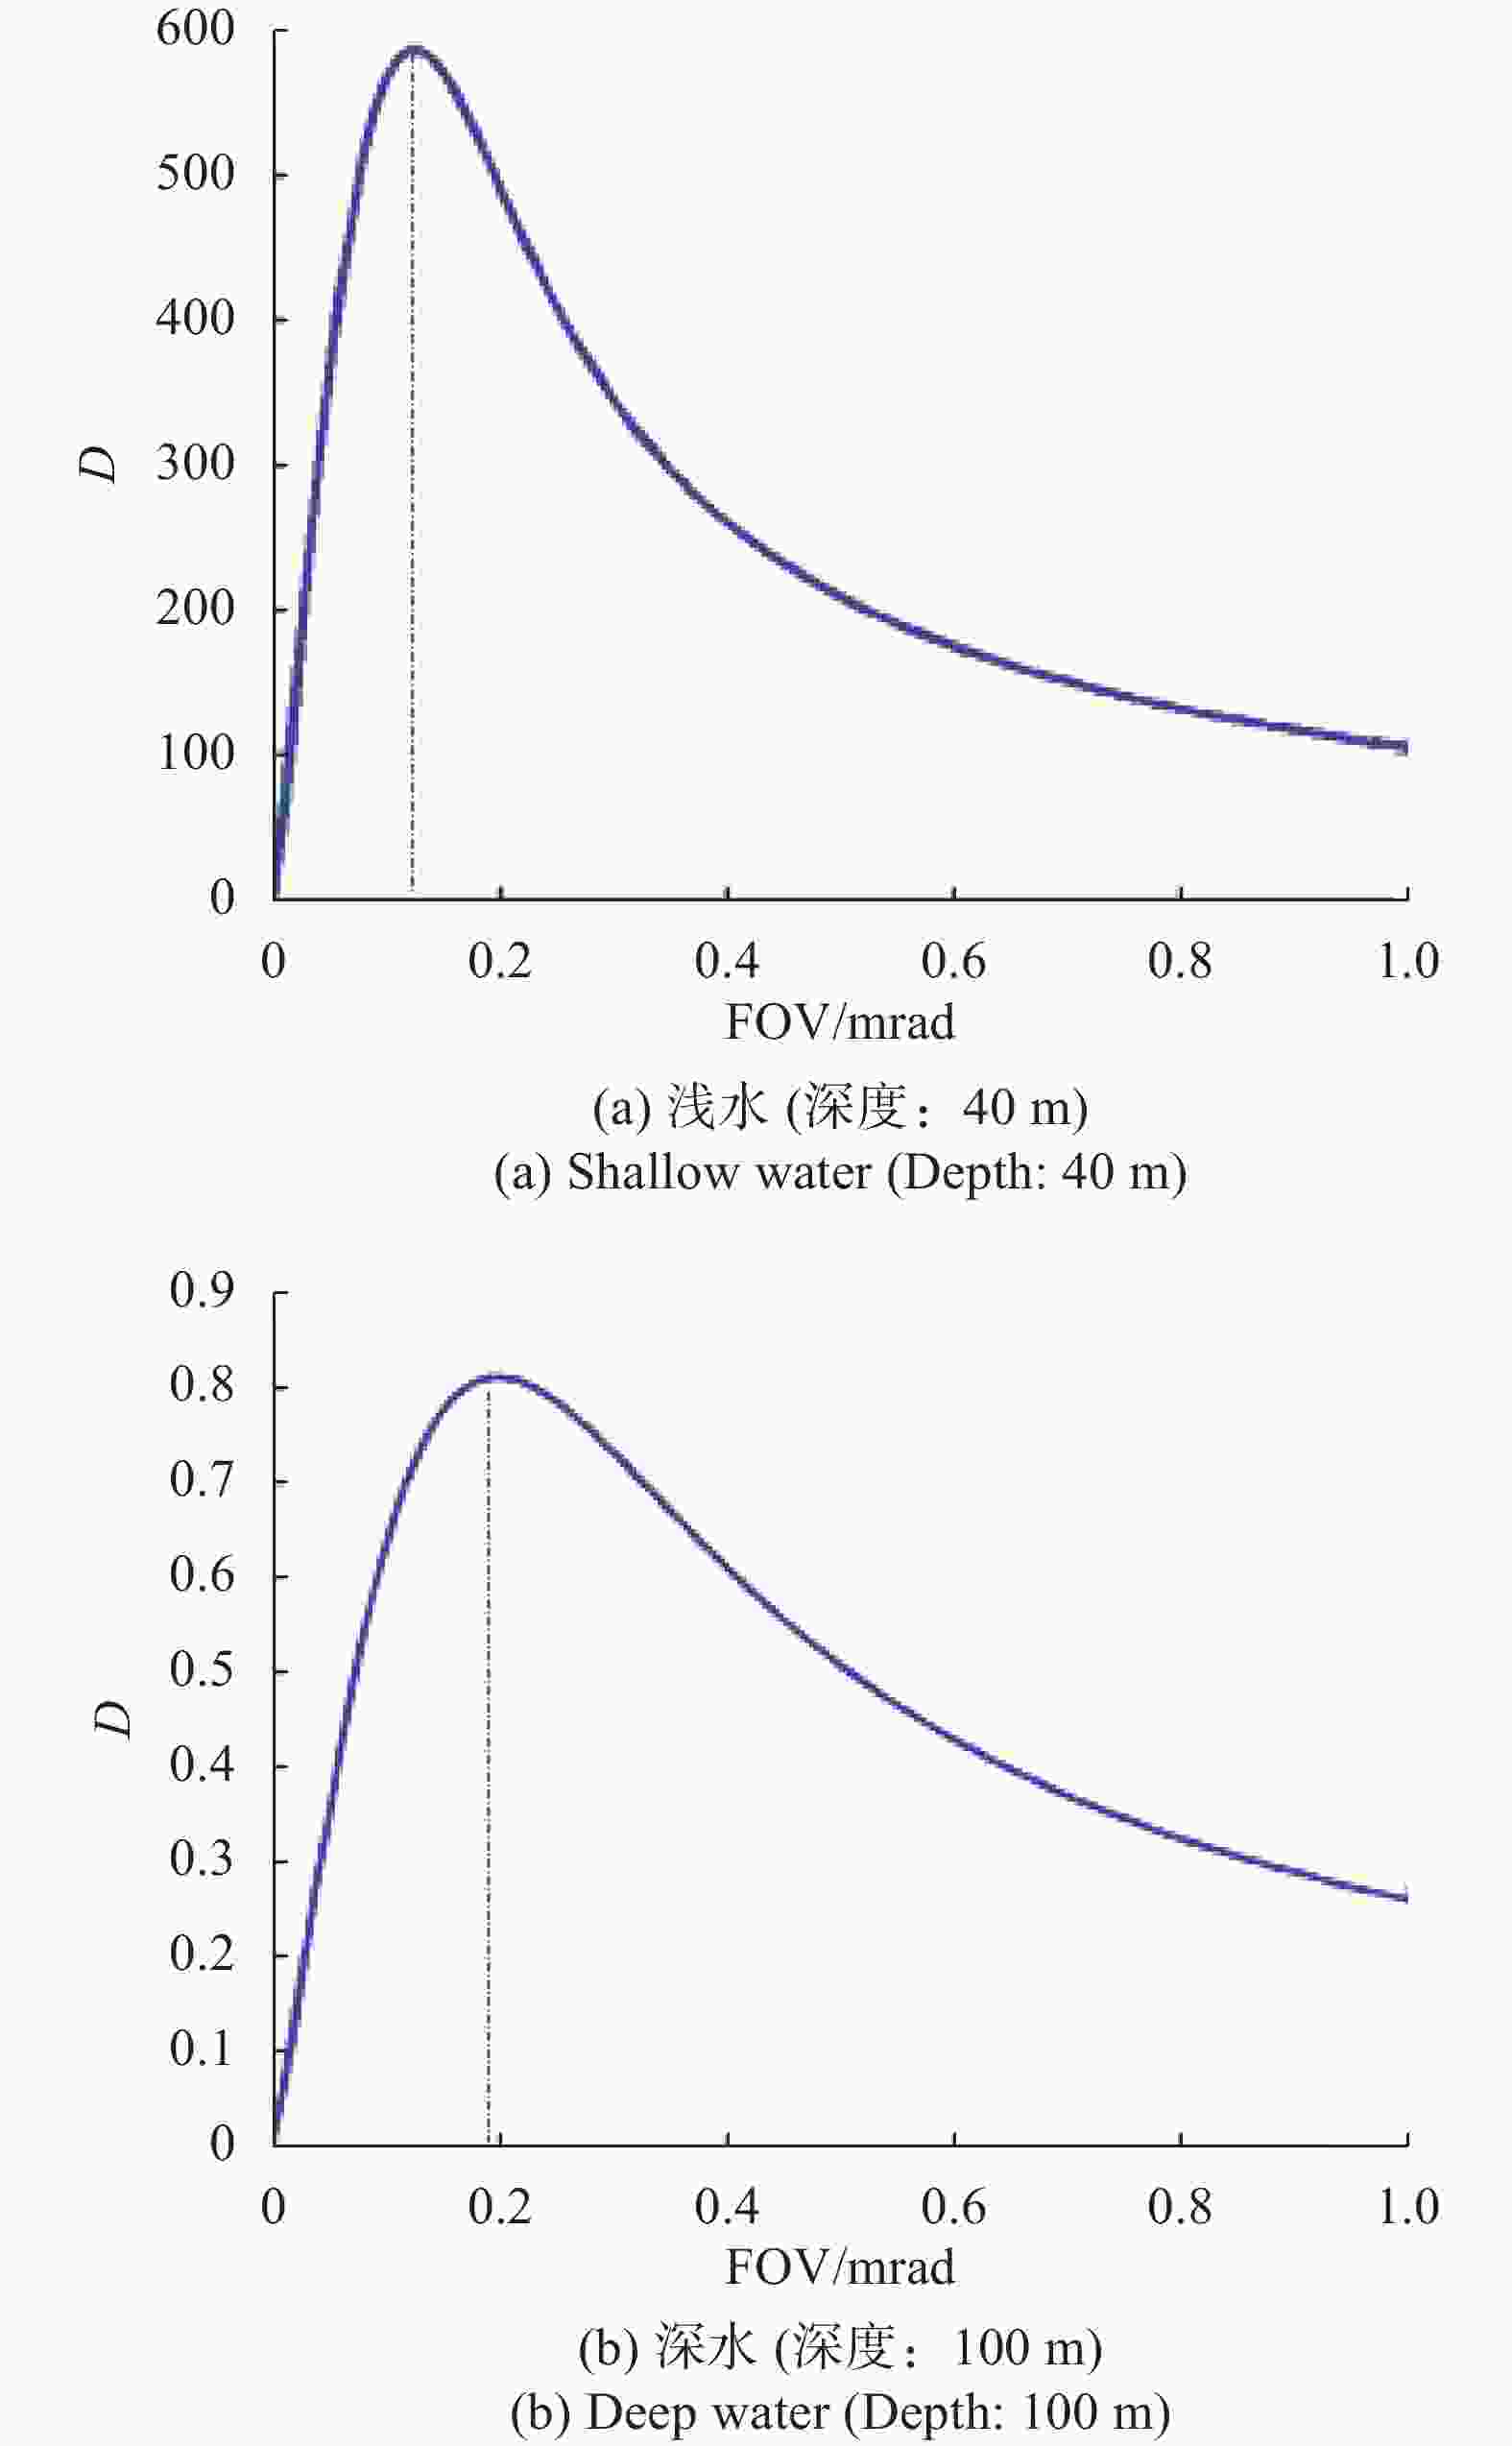
图 4 基于辨别力因子的最佳视场角
Figure 4. Optimal FOV based on discrimination factor
-
PMT (Photomultiplier Tupe)探测器灵敏度高,探测灵敏度高于10−9 W,像元有效尺寸8 mm,能量集中度为90%,接收瞬时视场角0.6 mrad,系统焦距为13.3 m。
-
影响激光水下剖面探测垂直分辨率的因素主要包括激光脉宽、回波信号采样频率等。
其中由激光脉宽$ \tau $引起的距离分辨率为:
$$ L_{1}=c \tau /2n $$ (1) 式中:c为真空中光速;n为水体折射率。
回波信号采样频率f对应的回波信号采样间隔t2,t2=1/f,由此引起的距离分辨率为:
$$ L_{2}=ct_{2}/2n $$ (2) 则垂直分辨率L= max{L1,L2}。其中激光脉宽取4 ns,回波信号采样频率设置为1 GHz。
-
在Dolin-Levin模型中,激光测深回波信号可表示为:
$$ \begin{split}& \qquad {P_{{bw,bot}}} = G\frac{{{P_t}{A_r}{{(1 - {\rho _s})}^2}\eta }}{{{{(nH + h)}^2}}} \times \\& \exp ( - 2{\tau _a})\exp [ - 2h{K_d}]F(m\psi ,bh) \end{split}$$ (3) $$ G = \left\{ {\begin{array}{*{20}{c}} {\dfrac{{{\rho _b}}}{\pi },for \to {P_{{bot}}}} \\ {\dfrac{{\tau c\beta \left( \pi \right)}}{{2n}},for \to {P_{{bw}}}} \end{array}} \right. $$ 式中:Pbw和Pbot分别代表海水中后向散射回波功率和海底反射信号功率;Kd为海水漫射衰减系数;Pt为激光发射功率;Ar为系统有效接收口径;$ {\rho _s} $为海表反射率;$ \eta $为系统收发光学效率;H为载荷与海面的垂直距离;h为水深;$ {\tau _a} $为大气消光系数;m为与水体相关的常数,一般取6~8;$ F(m\psi ,bh) $取值0~1之间,与接收视场角及水体参数相关;$\; {\rho _b} $为海底反射率;$ \beta \left( \pi \right) $为水体180°体积散射系数。在同等接收功率下,当接收口径增加,所需激光发射功率减小,如图5所示。国内外星载激光雷达失效均因为激光器失效,激光器失效风险与输出能量正相关,百米级探测深度必须采用中等能量+大口径光学接收方案。该方案采用激光发射能量35 mJ,光学接收口径2.5 m,实现百米级深度探测。

图 5 激光器能量与接收口径关系
Figure 5. The relationship between laser energy and receiving apertrue
-
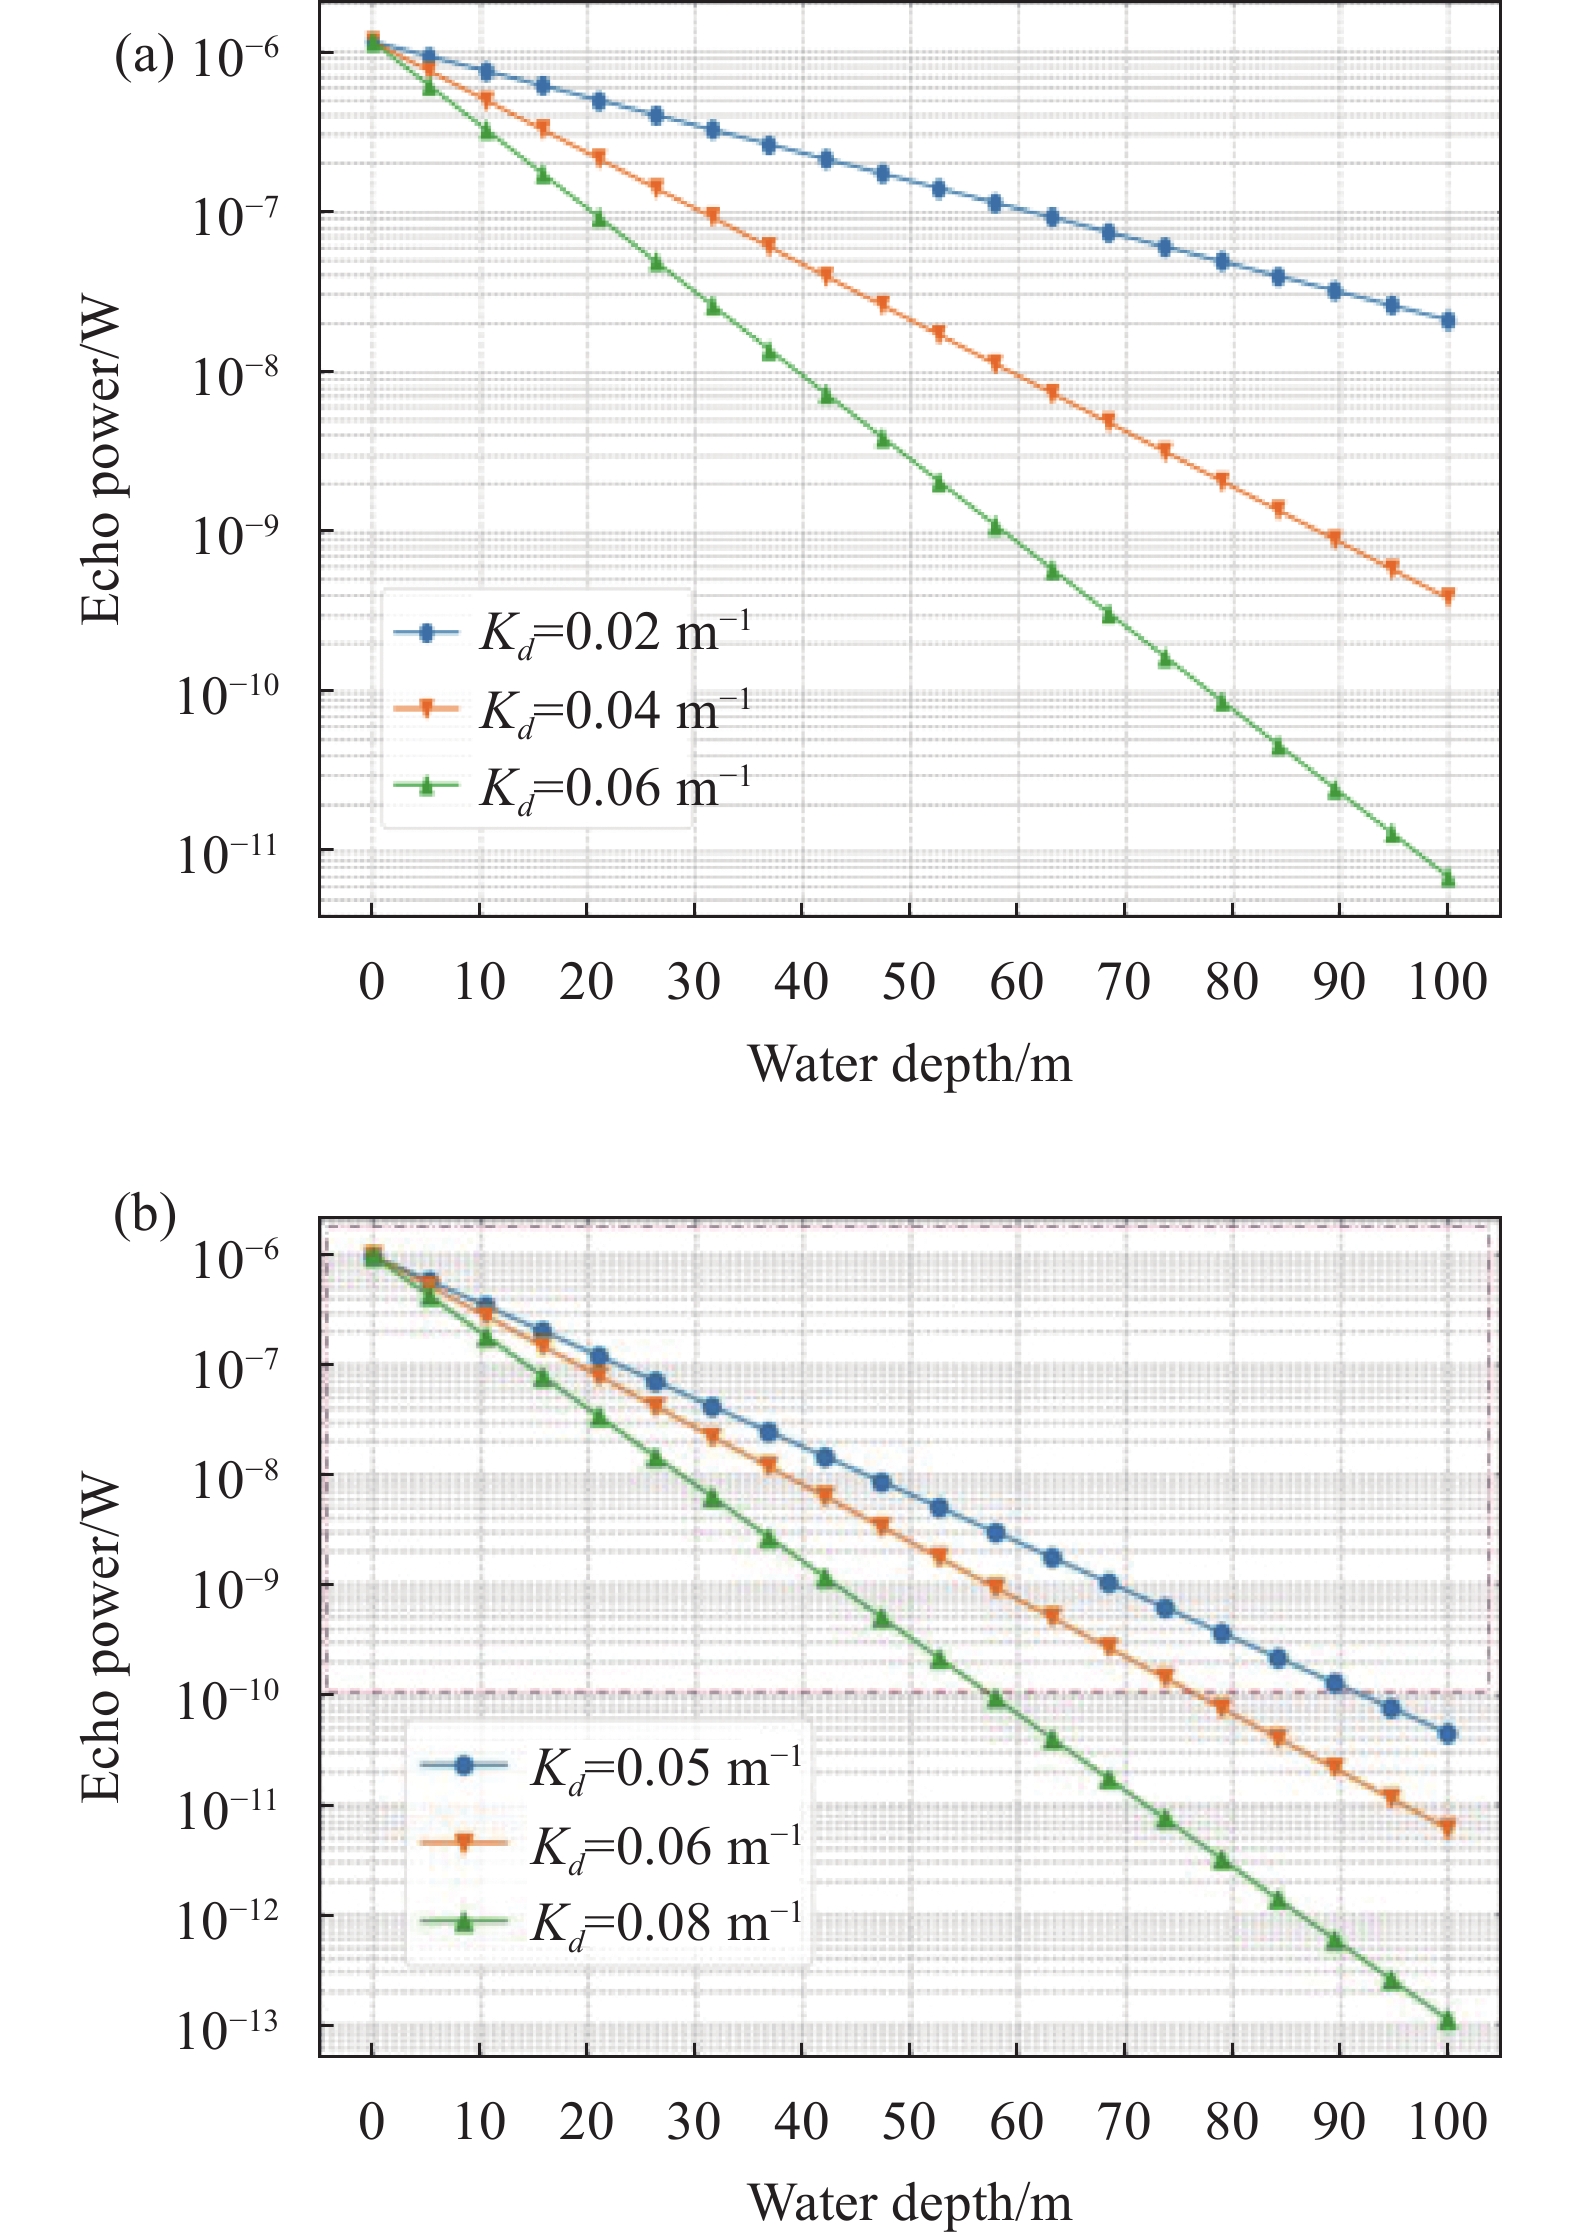
根据不同水质条件下水深与回波功率关系的仿真结果,从图6可以看出,从海表到海底回波信号的动态范围约为5个数量级,单一探测器难以满足5个量级的动态范围,另外,结合上文所述的不同深度回波信号的最佳接收视场不同,因此采用分视场多通道光学系统设计。

图 6 不同深度回波功率。(a)波长 486 nm;(b)波长532 nm
Figure 6. Echo power at different depths. (a) At 486 nm; (b) At 532 nm
532 nm波段主要用于近海岸水域探测,分为深水通道、浅水通道,测量深度50 m以内。486 nm主要用于大洋水域探测,分为深、浅水通道,测量深度100 m以内,如表2所示。仿真参数如下:激光发射能量35 mJ,激光脉宽4 ns,轨道高度400 km,接收口径2.5 m,波长486 nm/532 nm,大气单程透过率0.7,收发光学效率0.5,目标反射率0.1。
表 2 各通道视场及动态范围设置
Table 2. FOV and dynamic range settings for each channel
Channel Wavelength/nm FOV/urad Method Range/W 1 532 120 Shallow water/Linear 1.3×10⁻⁵ (0 m)
8.1×10⁻⁸ W(20 m)2 532 200 Deep water/Photonic 1.2×10⁻⁷ (15 m)
4.4×10⁻¹⁰ (50 m)3 532 120 Laser spectrum/Photonic 3.2×10⁻⁸ (0 m)
1.4×10⁻⁹ (23 m)4 486 120 Shallow water/Linear 1.4×10⁻⁶ (0 m)
1.0×10⁻⁸ (55 m)5 486 200 Deep water/Photonic 2.6×10⁻⁸ (50 m)
5.2×10⁻¹⁰ (100 m) -
针对温度为15 ℃盐度为30‰的水体环境,若温度误差为0.5 ℃,盐度误差为1 psu时,需满足布里渊频移不确定度为8 MHz布里渊线宽不确定度为14 MHz,要求激光器线宽小于等于200 MHz。同时针对高光谱分辨激光雷达反演后向散射系数,激光器线宽要求≤200 MHz,频率稳定性≤500 MHz,该方法可有效分离分子的布里渊散射和粒子的米散射,精确求解激光雷达比,后向散射测量误差优于25%。

图 7 频移线宽反演温度和盐度
Figure 7. Inversion of temperature and salinity using frequency shift linewidth
光谱探测温盐反演模型如图7所示[17],PMT采用16通道,通过光谱方式得到的温盐反演误差如图8所示[20]。

图 8 反演误差。(a) 温度测量误差;(b) 盐度测量误差
Figure 8. Inversion error. (a) Temperature inversion error; (b) Salinity inversion error
在满足测量散射光谱信息信噪比大于35的情况下,温度和盐度的测量误差分别为0.5 ℃和1‰。
采用Fizeau干涉仪加PMT阵列的方法,测量完整水体散射光谱,如图9所示。

图 9 水体完整散射光谱
Figure 9. Complete scattering spectrum of water column
采用拟合方法,去除米散射干扰,分离出分子散射能量和粒子散射能量计算后向散射系数,见图10。
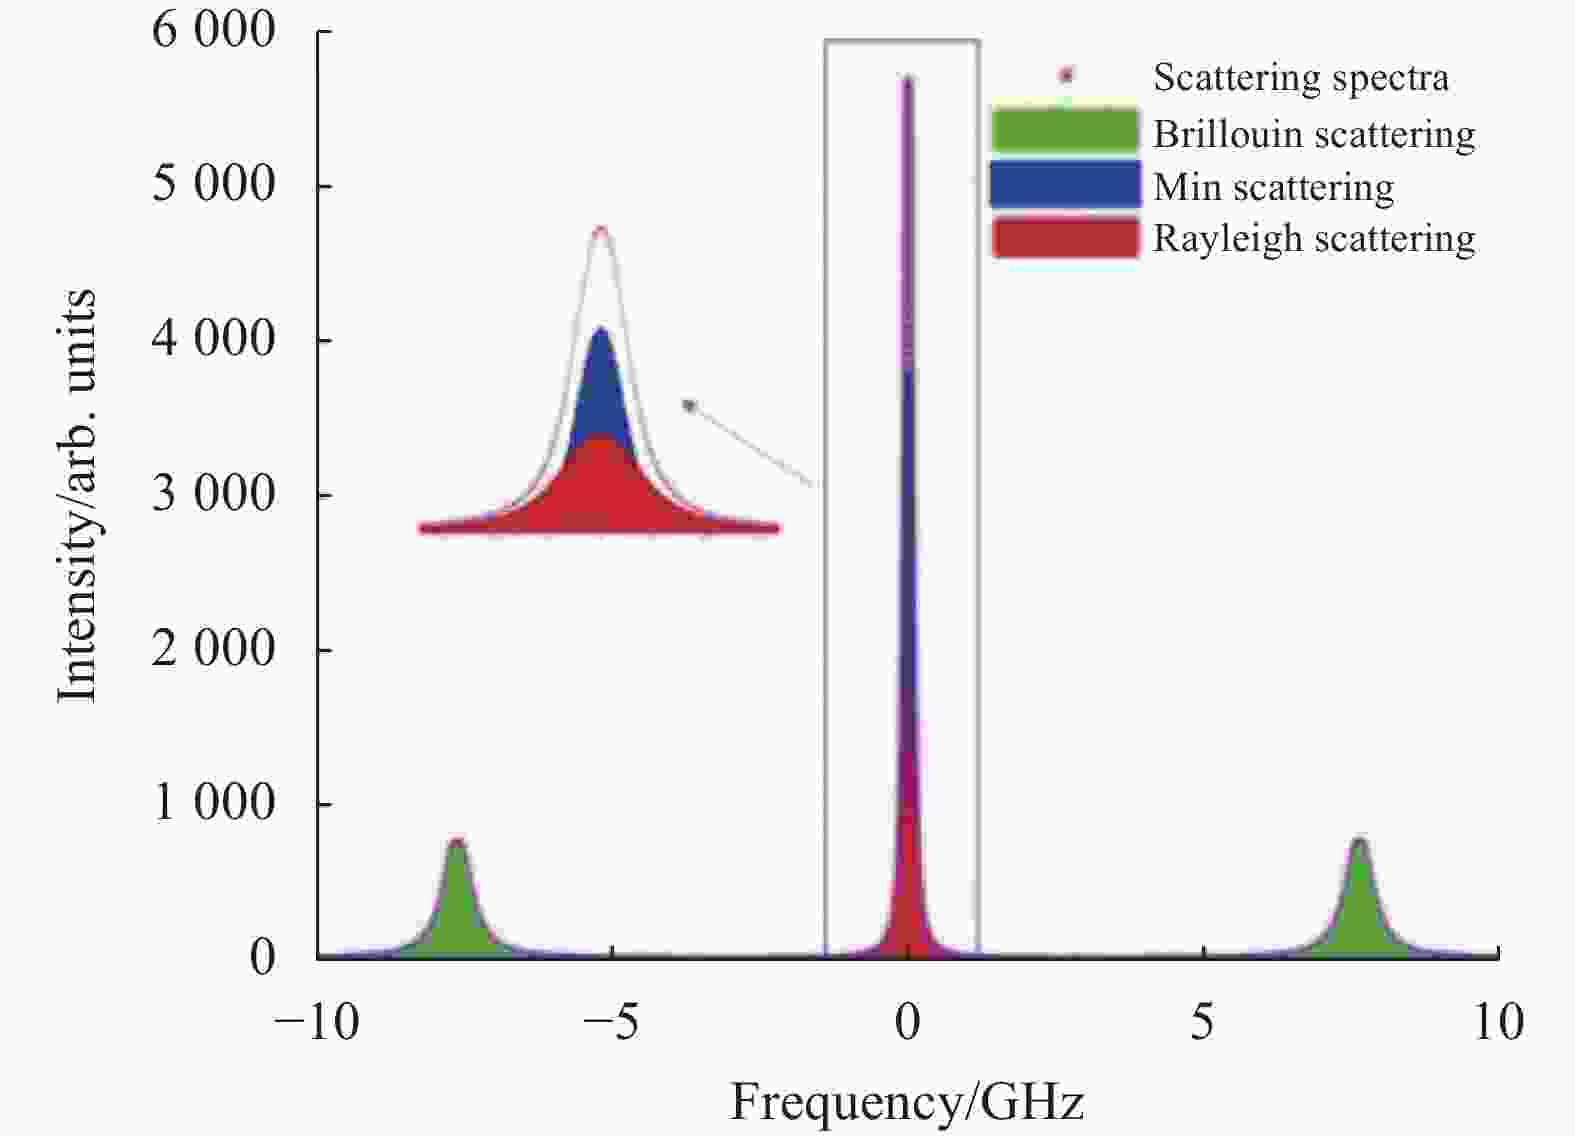
图 10 光谱分离
Figure 10. Spectral separation
代入后向散射计算方程,仿真实验表明后向散射系数与理论值测量误差小于5%[21-22],如图11所示。
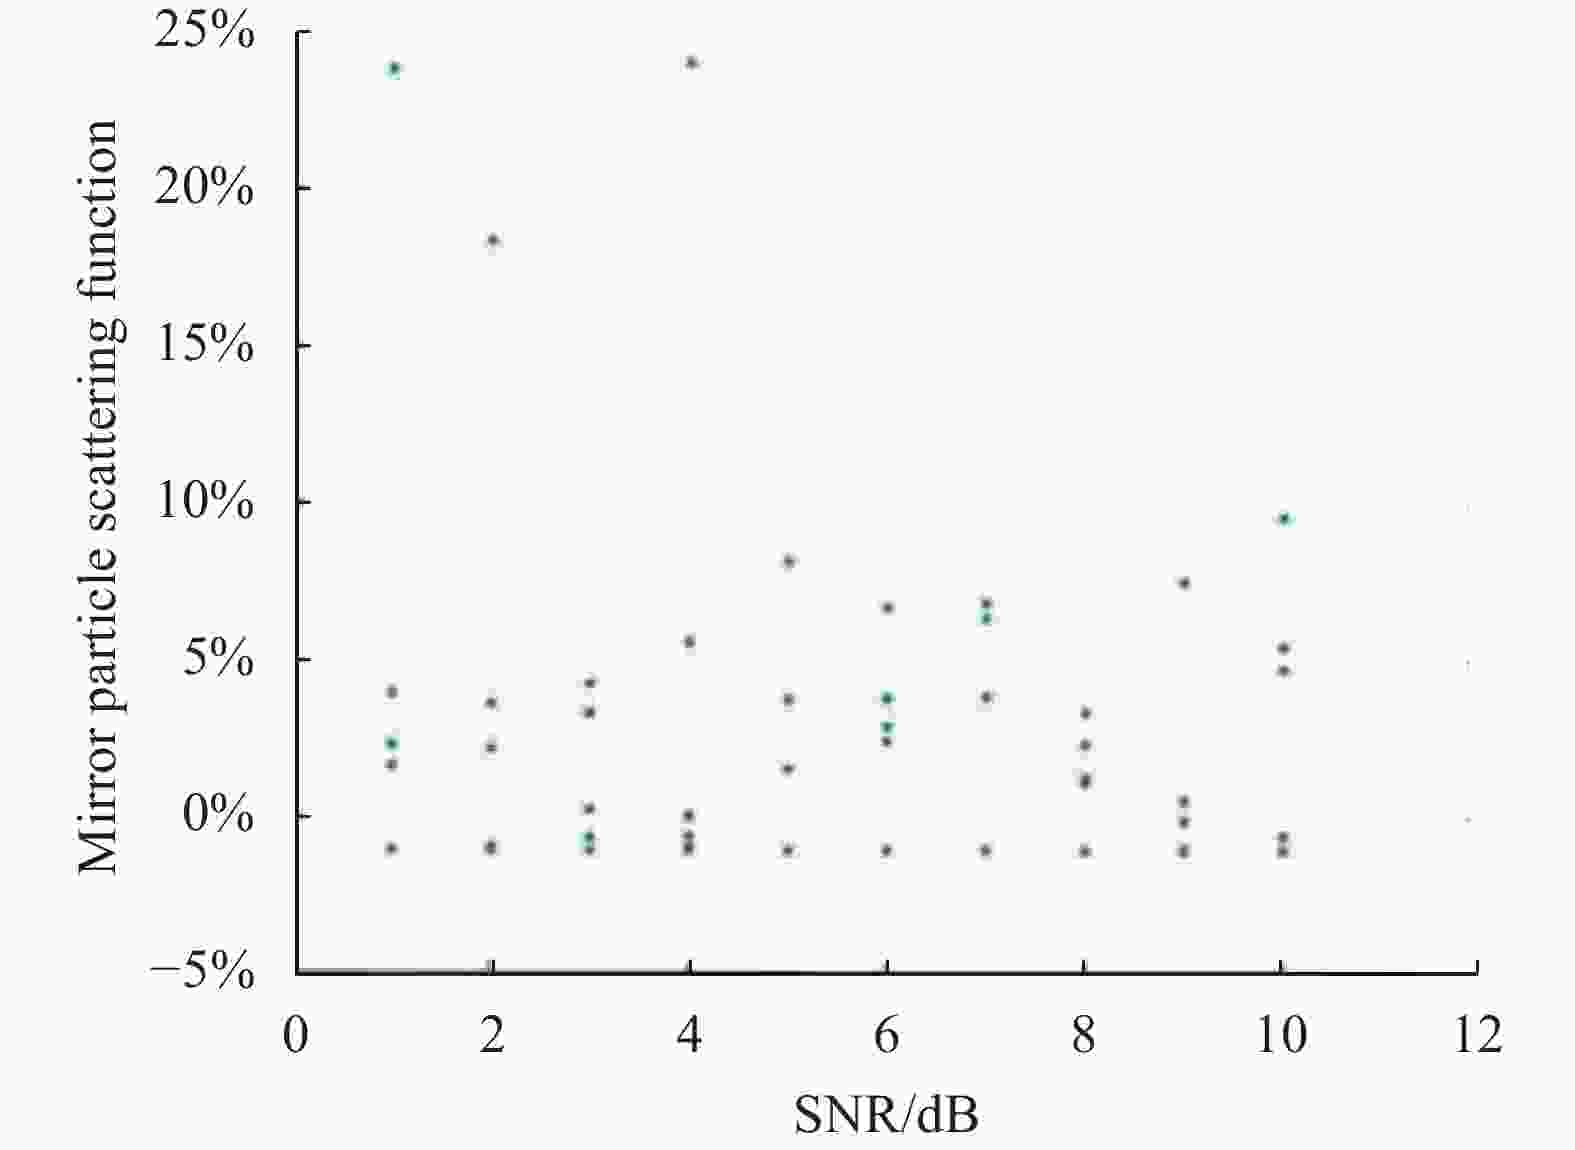
图 11 不同信噪比下粒子散射体函数误差分析
Figure 11. Error analysis of particle scattering function under different SNR
-
通过系统指标分解与仿真论证,探测系统要满足星载轨道400 km,实现大洋海水剖面测量深度不低于100 m,垂直分辨率优于0.5 m,后向散射测量误差小于等于25%,温度剖面误差小于0.5 ℃,盐度剖面误差小于1 psu,对激光器和光电接收与探测系统提出了明确指标,如表3所示。
表 3 系统指标
Table 3. System indicators
Laser 30 mJ@486 nm 35 mJ@532 nm 4 ns Emission FOV≤0.03 mrad Linewidth≤200 MHz@532 nm Photoelectric receiving and detecting system Detection sensitivity≤100 pW Optical efficiency 0.5 532 nm:shallow channel 1, deep channel 2, spectrum channel 3
; 486 nm:shallow channel 4, deep channel 5Diameter 2.5 m Performance Orbital height 400 km Depth of ocean profile ≥100 m Depth of shore profile ≥4/Kd Vertical resoluton ≤0.5 m Backscatter measurement error ≤25% Temperature profile error ≤0.5 ℃ Salinity profile error ≤1 psu -
星载近海岸海洋剖面多要素探测载荷,具备多光谱影像、激光能量与光谱探测三种功能,系统包括激光发射机、接收机、光轴监测机、综合管理控制器、数传系统和数管及供电系统。其中,接收机包括激光通道和可见光通道,激光通道包括能量探测和光谱探测。各分系统通过1553总线进行遥测遥控等管理,通过LVDS(Low Voltage Differential Signaling)总线进行图像数据及辅助数据的传输,如图12所示。

图 12 系统组成框图
Figure 12. System composition diagram
探测载荷系统包括被动多光谱相机以及主动激光剖面探测系统两部分,如图13所示。其中被动多光谱相机与主动激光雷达布局沿轨方向有一定夹角,大约在0.1°,考虑400 km轨道高度,获取的被动影像与激光点间隔700 m。被动多光谱载荷利用多通道滤光片与面阵探测器结合,通过单波段的线阵推扫模式结合TDI技术,获取海洋表层水柱积分信息。该项技术成熟成功应用于海洋系列卫星载荷,文中后续不再描述。
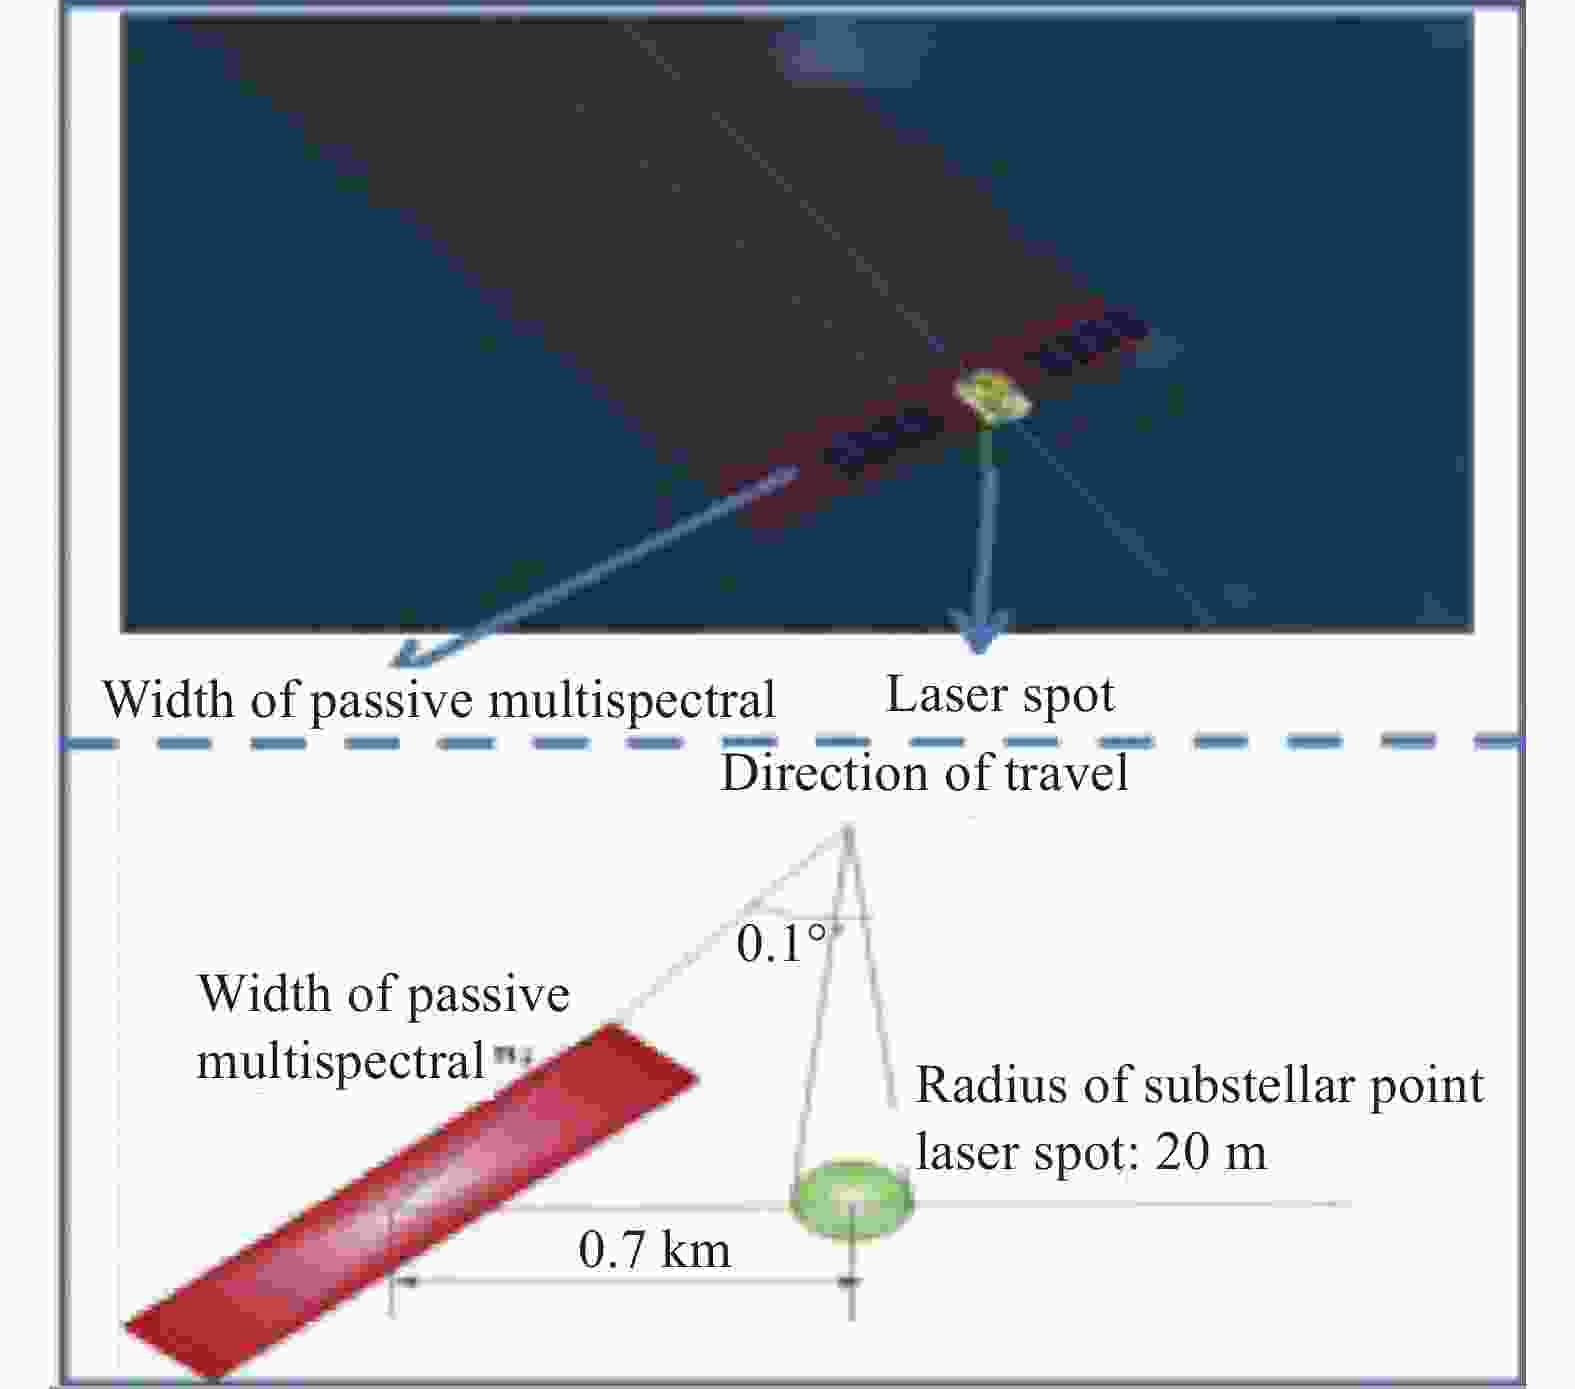
图 13 探测系统工作示意图
Figure 13. Schematic diagram of detection system operation
-
该系统采用单频种子振荡器+板条功率放大器结构(MOPA)实现。首先通过单频Nd:YAG调Q种子振荡器技术,实现窄脉宽的单频50 mJ@1064 nm调Q激光输出。再采用侧面泵浦的zigzag板条放大器,实现>1.2 J@1064 nm激光能量放大输出,光光转换效率达到35%以上。利用I 类非临界相位匹配LBO 和II 类临界相位匹配LBO分别实现倍频532 nm绿光与和频355 nm紫外光输出;再利用355 nm 泵浦BBO晶体,搭建光参量振荡器,实现486 nm 蓝光输出。
-
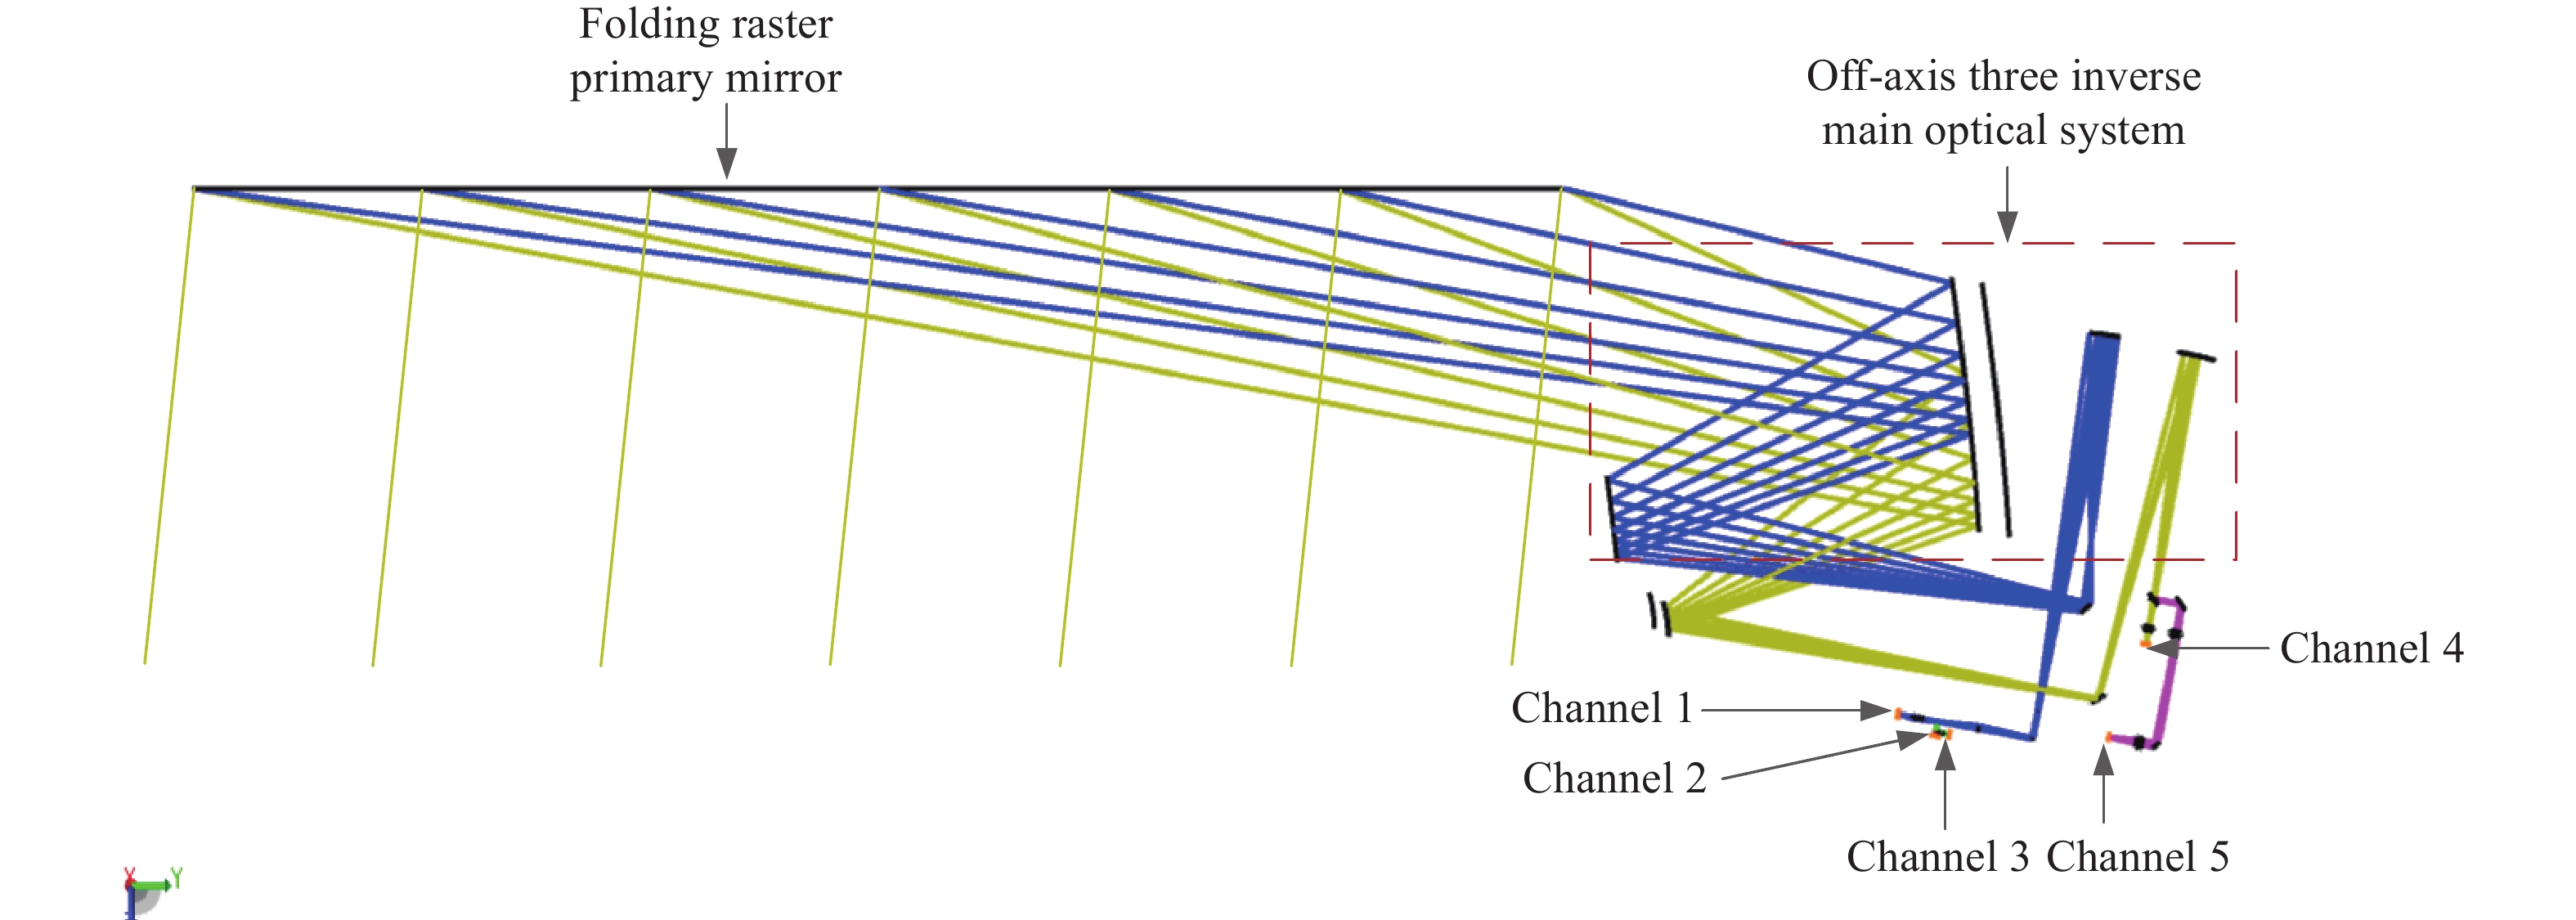
激光探测属于特定波长窄波段、窄视场的能量探测,对于波前要求不高,可以采用超薄平板基底上的微浮雕结构对入射光线进行衍射变换实现会聚,面密度低、易加工、可量产、易扩展、成本低,因此该方案采用衍射光栅作为主镜接收,实现微弱信号收集。该项目采用超大口径平面光栅(1 m×5 m等效2.5 m口径)、长焦距离轴三反主光学系统,实现系统口径大幅压缩(主反射镜尺寸仅0.6 m×0.9 m);通道1~3为3个532 nm通道可以实现多种水体的大动态范围信号探测以及激光光谱探测,通道4和5为两个486 nm通道实现大洋水体大深度剖面探测,通过分视场+分通道方式实现超大动态范围多波长同步高灵敏探测,光学系统设计图如图14所示。系统由光栅主镜、离轴三反系统和分光探测系统三部分组成。
其中,光栅主镜将5 m口径的光线进行压缩,经过离轴三反系统形成一次像由分光镜等分光元件最终完成5个通道的探测,各通道的能量集中度达到90%,口径压缩比达到5∶1,如图15所示。
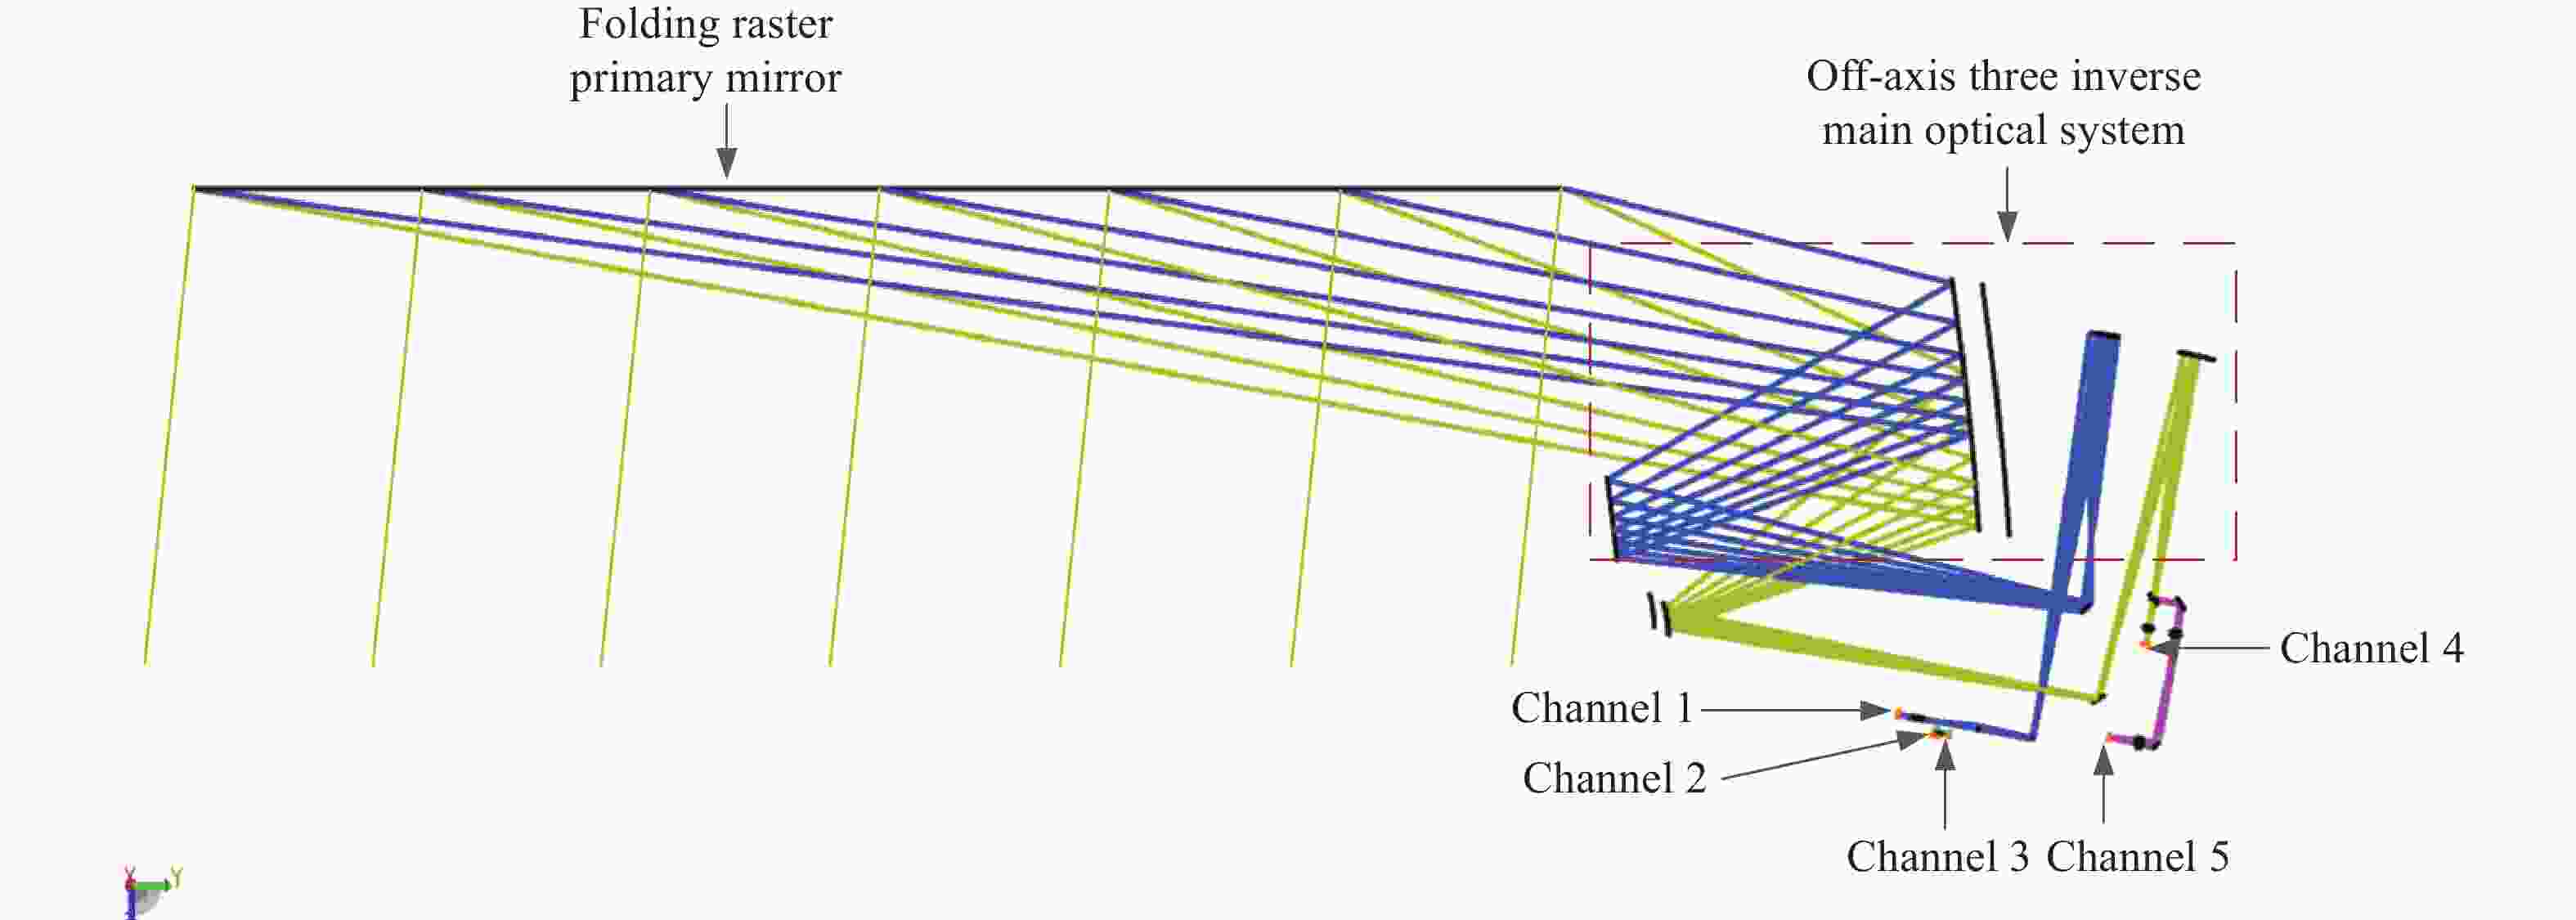
图 14 光学系统设计图
Figure 14. Optical system design drawing

图 15 典型通道的能量集中度
Figure 15. Energy concentration ratio of typical channel
光栅主镜采用率反射式立轴聚焦全息闪耀光栅形式,利用非球面波与平行光束全息干涉曝光得到光栅线条二维分布,通过不同槽型与线密度的分区设计满足对光的偏折与聚焦功能,将光线聚焦于离轴三反主镜镜面上,如图16所示。经过仿真分析,光栅5个区域的具体参数如表4所示,以入射角度为3°为前提,合理设置激光器的位置,保证对地出射角度为3°,保证发射与接收的光线方向一致,同时水下回波接收角度最大为±0.006°,根据三维光栅方程:
$$\begin{split} & {n^{( \pm 1)}}\sin {\theta _m}^{( \pm 1)}\cos {\phi _m}^{( \pm 1)} = {n^{( \pm 1)}}\sin \theta \cos \phi + m\frac{\lambda }{d} {n^{( \pm 1)}}\\&\qquad\qquad\sin {\theta _m}^{( \pm 1)}\sin {\phi _m} = {n^{( \pm 1)}}\sin \theta \cos \phi \end{split}$$ 计算可得486 nm的衍射角为70°~70.012°,532 nm的衍射角为80°~80.017°,该角度的出射光均可被离轴三反光学系统主镜接收。

图 16 光栅加工示意图
Figure 16. Schematic diagram of grating processing
表 4 光栅设计参数
Table 4. Grating design parameters
No. Grating grove/(°) Density 1 20-24 1330-1611 2 25-28 1611-1727 3 29-31 1727-1783 4 32-33 1783-1813 5 34-35 1813-1831 -

图 17 大动态散射信号高灵敏光电集成探测光谱探测方案示意图
Figure 17. Schematic diagram of a highly sensitive optoelectronic integrated detection spectral detection scheme for large dynamic scattering signals
大动态散射信号高灵敏光电集成探测光谱探测方案如图17所示,回波信号通过望远镜进行接收。接收到的回波信号分成两个通道检测。其中一个通道用于光谱检测,另外一个用于回波能量探测。对于光谱检测通道,回波信号光经过滤光片滤除486 nm的散射光, 其余的532 nm产生的后向散射光通过偏振分光晶体,反射的偏振光被PMT阵列接收,另一部偏振光通过斐索干涉仪(FI)。在多光束干涉原理下,不同频率的光在FI后在空间中扩展,并在光束整形后形成连续的RB散射光谱,并精确分布在多通道PMT上。然后通过多通道PMT对连续光谱进行量化,并获得离散的RB散射光谱。能量通道中回波信号通过二向色镜分别被两个PMT接收。
-
光栅主镜采用厚度5 mm的 ULE(零膨胀玻璃)材料,主镜组件轻量化程度高,主镜径厚比达到了200∶1,整机采用采用轻量化设计理念,在保证系统稳定度和刚度条件下,基于桁架结构设计与拓扑优化,降低系统体积密度,为了保证发射包络满足要求降低发射成本,发射阶段光栅处于折叠收拢状态,光栅折叠后的体积包络2200 mm×1800 mm×1030 mm,相当于1 m口径相机发射包络尺寸,经过估算系统质量约685 kg,如图18所示。
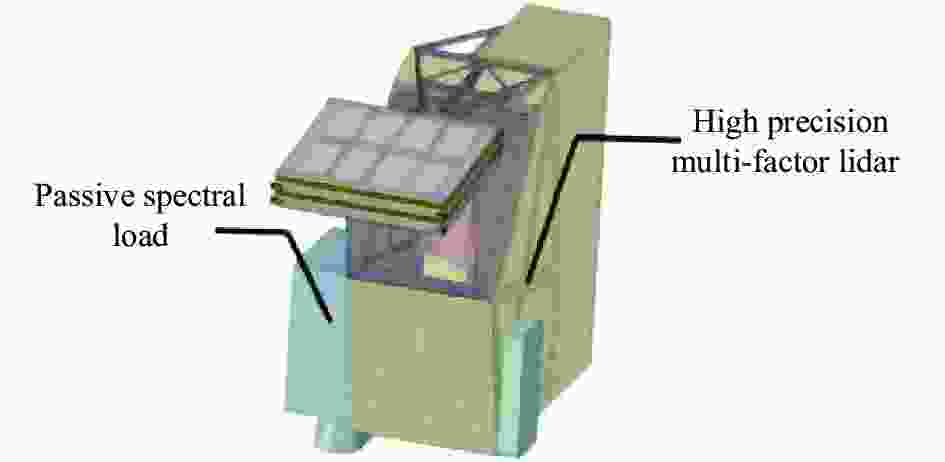
图 18 探测系统结构图
Figure 18. Detection system structure diagram
-
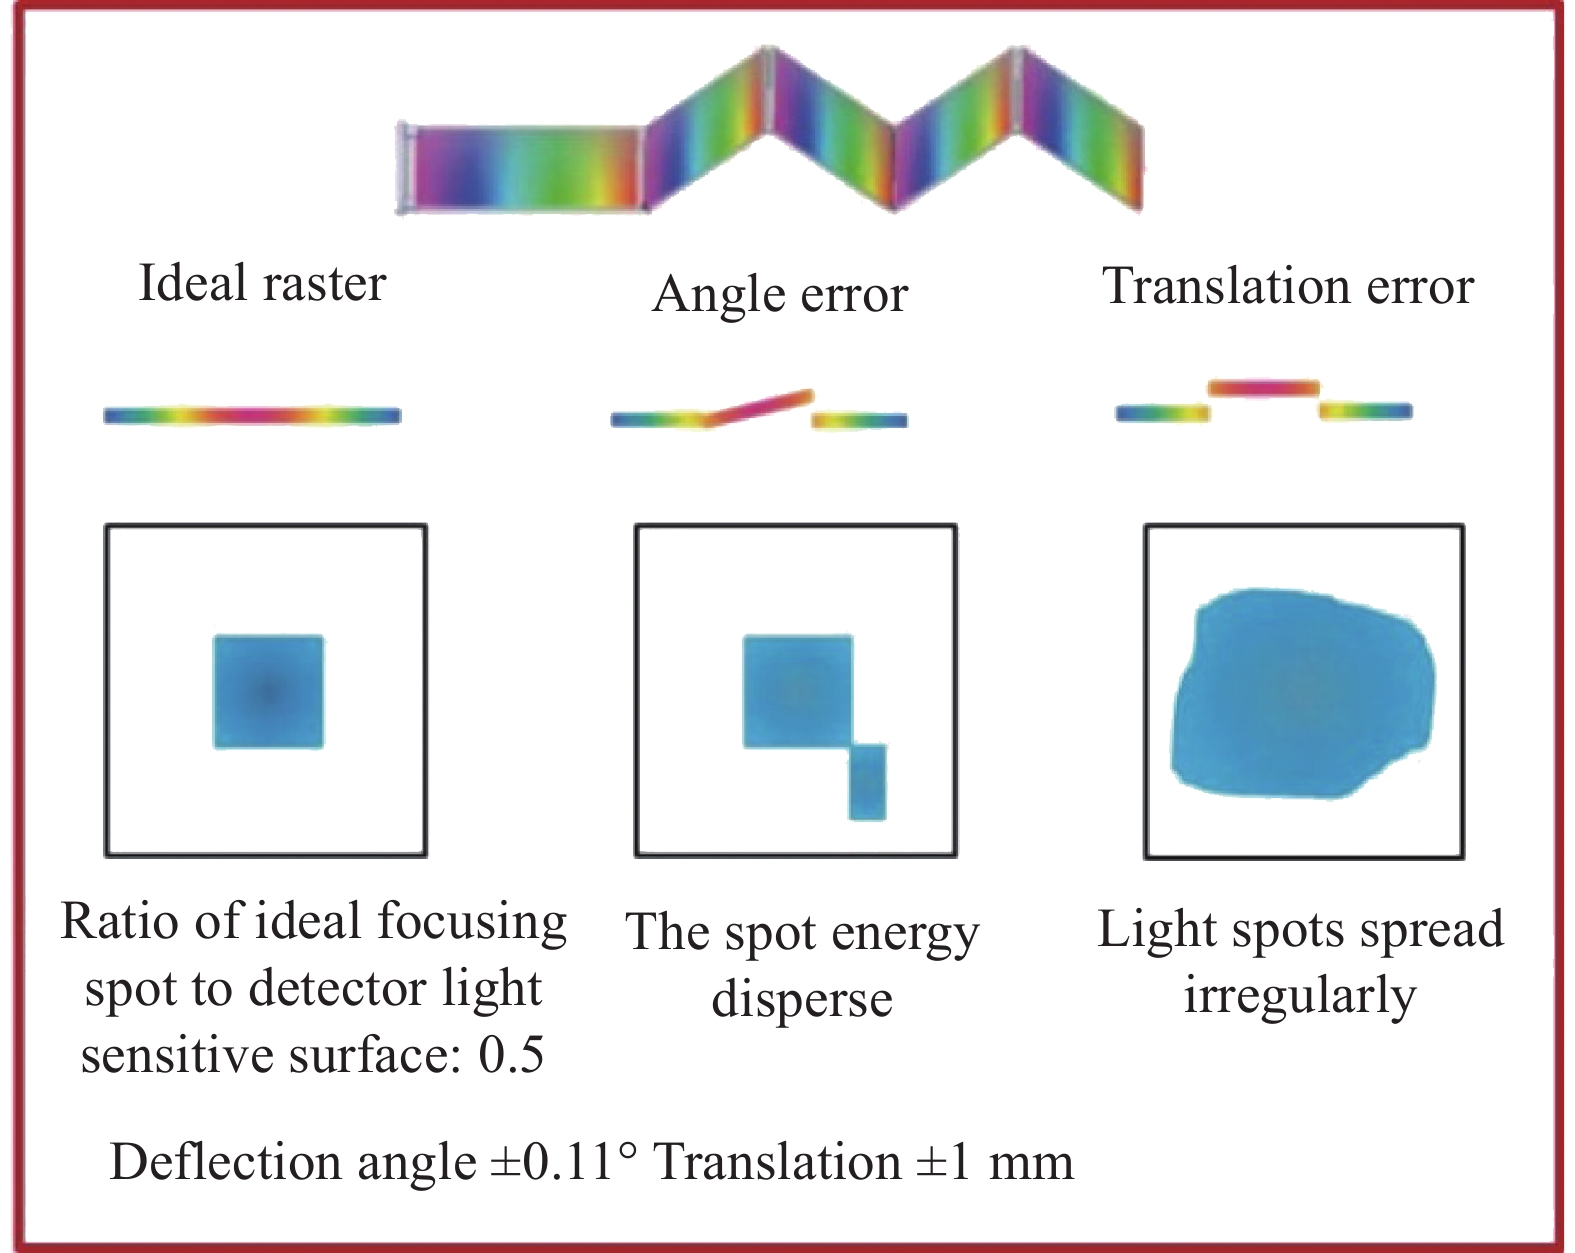
考虑光栅加工的尺寸限制以及光栅折叠与展开后调整的稳定性,采用5片的1 m拼接光栅拼接方案。初步分析系统的误差来源,由于激光剖面采集能量系统对像质等要求较低,因此,加工与装调过程精度均可达到波长量级满足要求,主要的精度影响因素源于光栅分块镜的拼接过程,即相对于理想光栅平面位置的移动与转动角度误差,如图19所示。经过分析,理想情况下光斑直径为4 mm,光栅角度的转动和平移会导致能量的分散,光斑会不规则的扩大。根据入射波长、入射角、光栅常数、离轴三反可接受的视场角以及光栅主镜和离轴三反主镜的相对位置关系,光栅转动角度小于±0.11°或平移量小于±1 mm时分散的能量仍可以达到探测器靶面上,即光栅能量探测系统具备一定的容差范围。

图 19 分块光栅角度及平移误差量分析示意图
Figure 19. Schematic diagram for analyzing the angle and translation error of segmented gratings
光栅展开利用铰链机构采用主动展开方案,其中平面控制精度约为2 mm,角度控制精度约为0.02°,结合光栅能量探测的容差范围,采用分级调控的方式,每片光栅4个角上分别布放多自由度制动器,用于调整位置移动和角度引起的初级误差,然后利用次镜后布放的六自由度调整机构结合变形镜进行光斑精细调整,保证聚焦光斑的尺寸与质量,整个系统利用四象限探测器的能量探测系统进行监控和反馈,并接入控制闭环系统,为实现在轨长期稳定运行创造有利条件,如图20所示。

图 20 在轨展开与调整示意图
Figure 20. On orbit deployment and adjustment diagram
-
文中面向百米级海洋剖面探测需求,创新性地提出了主被动复合探测,激光能量与光谱同步探测体制方案,开展星载主动激光剖面探测系统的指标论证与详细方案设计方案,针对光栅的折叠展开进行了误差分析并形成了在轨调整方案,在1 m口径相机的发射包络下实现了等效2.5 m大口径探测能量的多功能光电接收与探测系统方案。
Research on multi-element detection technology and system for spaceborne ocean profile
-
摘要: 海洋立体结构信息是未来实现海洋透明与海洋强国的基础,针对海洋剖面探测能力不足的问题,以及星载海洋剖面多要素同源同域一体化探测空白,开展星载海洋剖面多要素探测技术与系统方案研究,提出新型激光主被动复合、能谱复用探测技术体制,面向未来星载应用,完成星载海洋剖面多要素探测载荷系统设计。其中,激光器谱段设计为486、532 nm多波长一体化最佳配比输出,光电接收探测系统选用1 m×5 m超大口径可折叠光栅主镜,经过仿真分析,探测系统可实现大洋水深100 m深度、温度、盐度以及后向散射系数等多要素同源探测能力,同等体积包络条件下,能量收集能力提升5倍。Abstract:
Objective The development of marine ecology, marine science, and marine economy is inseparable from marine observation data, and the requirements for marine data have developed from sea surface data to ocean profile data. Ocean profiling is an important basis and means to study the three-dimensional profile distribution of global ocean optical and biological parameters, as well as ocean carbon and energy cycles. At present, ocean profile elements (temperature, salinity, optical parameters, etc.) mainly rely on in-situ detection and airborne detection, and the lack of global-scale, high-efficiency, and high-precision remote sensing observation methods has become a bottleneck problem for comprehensive understanding and fine perception of the ocean. At present, the traditional multi-payload cooperative observation or satellite-ground linkage observation mode can obtain multi-element information in time and region, but the integrated detection of temperature, salinity and depth in the ocean profile is still blank, and the inversion of non-homologous, non-homogeneous and non-simultaneous detection data of underwater optical biological parameters and physicochemical parameters is consistent and accurate, which cannot effectively obtain the three-dimensional structure of the ocean to meet the needs of scientific research. Methods An active and passive composite optical remote sensing system for multi-element detection of ocean profile is proposed, as shown in Figure 1. Based on the lidar equation calculation, the application indicators of the decomposition system, such as depth, backscatter measurement error, temperature, salinity error, etc., are calculated and calculated, and the energy, line width, optical system aperture, focal length, field of view, detector selection of the optical system of photoelectric reception and detection are confirmed through simulation analysis and calculation, as shown in Table 3. The grating primary mirror realizes the compression of light, and the diameter-thickness ratio of ULE material is 200∶1 to realize the lightweight of the system. According to the incident wavelength, incident angle, grating constant, the acceptable field of view angle of the off-axis three-mirror and the relative position of the grating primary mirror and the off-axis three-mirror primary mirror, the on-orbit deployment accuracy requirements were analyzed. The optical system ensures that the field of view, transmittance and energy concentration of each channel are more than 90% through simulation design, so as to ensure that the core components meet the system demonstration indicators. Results and Discussions The design of the multi-element detection payload system for the spaceborne ocean profile is completed. The laser spectral band is designed as the optimal ratio output of 486 nm and 532 nm multi-wavelength integration, and the photoelectric receiving and detection system selects 1m×5m super-large aperture foldable grating primary mirror, and after simulation analysis, the detection system can realize the homology detection ability of multiple elements such as ocean depth of 100 m, temperature, salinity and backscattering coefficient, and the ability collection capacity is increased by 5 times under the same volume envelope condition. The detection system can achieve a spaceborne orbit of 400 km, a measurement depth of ocean water profile of not less than 100 m, a vertical resolution of better than 0.5 m, a backscatter measurement error of less than or equal to 25%, a temperature profile error of less than 0.5 ℃, and a salinity profile error of less than 1 psu. Conclusions Based on the requirements of the multi-element detection task of the ocean profile, through the analysis and demonstration of the system indicators, a new type of spaceborne near-shore profile multi-element detection technology scheme was proposed, which adopted active and passive composite detection, the laser energy and the spectral synchronous detection system were integrated, the ultra-large aperture foldable optical primary mirror was used to ensure the efficient collection of weak underwater signals, and the laser spectral channel was used to obtain all elastic and inelastic scattering spectra, and the scattering signals of molecules and particles in water were identified and decoupled with high precision. In this way, a more accurate backscattering coefficient of LiDAR can be obtained, which has the ability to detect multiple elements such as underwater temperature, salinity, depth, and optical backscattering coefficient, and the data has good same-origin and same-domain simultaneity. -
Key words:
- lidar /
- ocean profile detection /
- active and passive composite /
- large aperture grating
-
图 2 海水的光学透过窗口与激光工作物质材料的选择
Figure 2. The optical transmittance window of seawater and the selection of laser working materials
图 5 激光器能量与接收口径关系
Figure 5. The relationship between laser energy and receiving apertrue
图 6 不同深度回波功率。(a)波长 486 nm;(b)波长532 nm
Figure 6. Echo power at different depths. (a) At 486 nm; (b) At 532 nm
图 7 频移线宽反演温度和盐度
Figure 7. Inversion of temperature and salinity using frequency shift linewidth
图 8 反演误差。(a) 温度测量误差;(b) 盐度测量误差
Figure 8. Inversion error. (a) Temperature inversion error; (b) Salinity inversion error
图 11 不同信噪比下粒子散射体函数误差分析
Figure 11. Error analysis of particle scattering function under different SNR
图 17 大动态散射信号高灵敏光电集成探测光谱探测方案示意图
Figure 17. Schematic diagram of a highly sensitive optoelectronic integrated detection spectral detection scheme for large dynamic scattering signals
图 19 分块光栅角度及平移误差量分析示意图
Figure 19. Schematic diagram for analyzing the angle and translation error of segmented gratings
表 1 系统指标参数
Table 1. System indicator parameters
No. Category Target Application 1 Orbital height ≥400 km Efficient global measurement of ocean parameters 2 Depth of ocean profile ≥100 m Acquisition of underwater topography and profile information of ocean 3 Depth of shore profile ≥4/Kd Acquisition of underwater topography and profile information of shore 4 Vertical resolution ≤0.5 m Vertical hierarchical information 5 Backscatter measurement error ≤25% Water quality inversion and monitoring 6 Temperature profile error ≤0.5 ℃ Global climate projections, air-sea interaction research, marine biology protection 7 Salinity profile error ≤1 psu Aquaculture, sea water chemical industry  下载: 导出CSV
表 2 各通道视场及动态范围设置
Table 2. FOV and dynamic range settings for each channel
Channel Wavelength/nm FOV/urad Method Range/W 1 532 120 Shallow water/Linear 1.3×10⁻⁵ (0 m)
8.1×10⁻⁸ W(20 m)2 532 200 Deep water/Photonic 1.2×10⁻⁷ (15 m)
4.4×10⁻¹⁰ (50 m)3 532 120 Laser spectrum/Photonic 3.2×10⁻⁸ (0 m)
1.4×10⁻⁹ (23 m)4 486 120 Shallow water/Linear 1.4×10⁻⁶ (0 m)
1.0×10⁻⁸ (55 m)5 486 200 Deep water/Photonic 2.6×10⁻⁸ (50 m)
5.2×10⁻¹⁰ (100 m)
下载: 导出CSV
表 3 系统指标
Table 3. System indicators
Laser 30 mJ@486 nm 35 mJ@532 nm 4 ns Emission FOV≤0.03 mrad Linewidth≤200 MHz@532 nm Photoelectric receiving and detecting system Detection sensitivity≤100 pW Optical efficiency 0.5 532 nm:shallow channel 1, deep channel 2, spectrum channel 3
; 486 nm:shallow channel 4, deep channel 5Diameter 2.5 m Performance Orbital height 400 km Depth of ocean profile ≥100 m Depth of shore profile ≥4/Kd Vertical resoluton ≤0.5 m Backscatter measurement error ≤25% Temperature profile error ≤0.5 ℃ Salinity profile error ≤1 psu
下载: 导出CSV
表 4 光栅设计参数
Table 4. Grating design parameters
No. Grating grove/(°) Density 1 20-24 1330-1611 2 25-28 1611-1727 3 29-31 1727-1783 4 32-33 1783-1813 5 34-35 1813-1831
下载: 导出CSV
-
[1] Zhao L L, Chang W G, Gao L, et al. Feasibility study of extending multispectral depth retrieving model to sea area without in-situ data: A case study of North Island and Robert island [J]. China Sciencepaper, 2021, 16(5): 542-548. (in Chinese) doi: 10.3969/j.issn.2095-2783.2021.05.014 [2] Liu S, Wang L, Liu Hu X, et al. Deriving bathyme-try from optical images with a localized neural network algorithm [J]. IEEE Transactions on Geoscience & Remote Sensing, 2018, 56(9): 5334-5342. [3] Lee Z, Carder K L, Mobiley C D, et al. Hyper-spectral remote sensing for shallow waters 2 deriving bottom depths and water properties by optimization [J]. Applied Optics, 1999, 38(18): 3831-3843. doi: 10.1364/AO.38.003831 [4] Huang R, Yu K, Wang Y, et al. Bathymetry of the coral reefs of Weizhou island based on multispectral satellite images [J]. Remote Sensing, 2017, 9(7): 750-775. doi: 10.3390/rs9070750 [5] Su H, Liu H, Wu Q. Prediction of water depth from multispectral satellite imagery-the regression kriging alternative [J]. IEEE Geoscience and Remote Sensing Letters, 2015, 12(2): 2511-2515. [6] Wang Y, Xu X, Tan Y. Laser precision ranging technology [J]. Spacecraft Recovery & Remote Sensing, 2021, 42(6): 22-33. (in Chinese) [7] Xu C, Zhou F. Development and applications of space—borne laser remote sensing technology [J]. Spacecraft Recovery & Remote Sensing, 2009, 30(4): 26-31. (in Chinese) [8] Pan D, Lin S, Li S, et al. The application of watercolor remote sensing in General Management of Coast Zone [J]. Spacecraft Recovery & Remote Sensing, 2001, 22(2): 34-39. (in Chinese) [9] Xu Haipen. Bathymetry inversion based on semi-empirical model and error analysis of different water depth ranges [J]. Coastal Engineering, 2014, 33(1): 19-25. (in Chinese) [10] Rodier S, Zhai P, Josset D, et al. CALIPSO lidar measurments for ocean sub-surface studies[C]//34 th International Sym-posium on Remote Sensing of Environment, 2011. [11] James H. Churnside, Brandi J, et al. Subsurface ocean signals from an orbiting polarization lidar [J]. Remote Sensing, 2013, 5(7): 3457-3475. [12] Zhang W, Xu N, Ma Y, et al. A maximum bathymetric depth model to simulate satellite photon-counting lidar erformance [J]. ISPRS Journal of Photogrammetry and Remote Sensing, 2021, 174: 182-197. doi: 10.1016/j.isprsjprs.2021.02.013 [13] Hsu H J, Huang C Y, Jasinski M, et al. A semi-empirical scheme for bathymetric mapping in shallow water by ICESat-2 and Sentinel-2: A case study in the South China Sea [J]. ISPRS Journal of Photogrammetry and Remote Sensing, 2021, 178: 1-19. doi: 10.1016/j.isprsjprs.2021.05.012 [14] Ma Y, Xu N, Liu Z, et al. Satellite-derived bathymetry using the ICESat-2 lidar and Sentinel-2 imagery datasets [J]. Remote Sensing of Environment, 2020, 250: 112047. doi: 10.1016/j.rse.2020.112047 [15] Chen Yifu, Zhu Zhen, Le Yuan, et al. Refraction correction and coordinate displacement compensation in nearshore bathymetry using ICESat-2 lidar data and remote-sensing [J]. Opt Express, 2021, 29(2): 2411-2430. doi: 10.1364/OE.409941 [16] Xu N, Ma Y, Yang J, et al. Deriving tidal flat topography using ICESat-2 laser altimetry and Sentinel-2 imagery [J]. Geophysical Research Letters, 2022, 49(2): e2021GL096813. doi: 10.1029/2021GL096813 [17] Ebuchi N, Abe H. Evaluation of sea surface salinity observed by Aquarius[C]//2012 IEEE International Geoscience and Remote Sensing Symposium (IGARSS), Munich: IEEE, 2012, 5767-5769. [18] Yuki A, Motohiko M, Yasuo O, et al. Sound velocity measurement in liquid water up to 25 GPa and 900 K: Implications for densities of water at lower mantle conditions [J]. Earth and Planetary Science Letters, 2010, 289: 479-485. [19] Feigels V I, Kopilevich Y I. Russian airborne lidar systems: Comparative analysis and new ideas[C]//SPIE, 1999, 3761, 129-147. [20] Liang K, Zhang R, Sun Q, et al. Brillouin shift and linewidth measurement based on double-edge detection technology in seawater [J]. Applied Physics B, 2020, 126: 1-9. [21] Wang Y, Xu Y, Chen P, et al. Remote sensing of seawater temperature and salinity profiles by the brillouin lidar based on a fizeau interferometer and multichannel photomultiplier tube [J]. Sensors, 2022, 23(1): 446. doi: 10.3390/s23010446 [22] Zhou Y. Research on oceanic lidar for detecting water optical properties [D]. Hangzhou: Zhejiang University, 2020. (in Chinese) -

 点击查看大图

计量
- 文章访问数: 75
- HTML全文浏览量: 24
- PDF下载量: 22
- 被引次数: 0

