


 下载:
下载:


-
随着互联网时代的高速发展,通信容量的需求指数级增长,而传统单模光纤(SMF)的通信容量已趋于香农极限(100 Tbit/s)[1]。空分复用(SDM)[2]技术能突破SMF通信容量理论极限,实现通信扩容。SDM技术以少模光纤(FMF)[3-4]、多芯光纤(MCF)[5]和多芯-少模光纤(MC-FMF)[6-7]为主要实现方式,通过在同一光纤中复用多个信道,成倍地提高通信容量。多芯光纤分为弱耦合多芯光纤[8]和强耦合多芯光纤两类,其中强耦合多芯光纤通过芯间的耦合作用[9],多个纤芯共同形成纤芯区域,支持类似“超模”的传输模式,因此多芯超模光纤也被认为是一种少模/多模光纤[10]。研究表明,相较于等效的单芯少模光纤,多芯超模光纤具有更低的模式串扰、较小的差分群时延[11]和超大的模场面积[12],用于通信系统传输时,可显著减小非线性效应的影响,有利于脉冲保持,减少信号失真。然而,多芯超模光纤中不同超模的模场分布差异较大,当对信号进行放大时,不同超模的交叠积分因子不同,将产生较大的DMG,从而导致通信系统接收端误码率升高,影响系统的通信质量。因此,为了确保信号传输的高效性,研究设计相应的多芯超模掺铒光纤放大器(Multi-core Supermode Erbium-Doped Fiber Amplifier, MC-SM-EDFA)尤为重要。
2017 年, Fontaine 等[13]设计了一种4 芯的MC-SM-EDFA,实现了4个超模的复用传输。该光纤通过打乱所有纤芯的信号模式,并将泵浦光功率更均匀地分配到所有纤芯,有效降低了 DMG。2018 年, Wada 等[14]通过包层泵浦的方式实现了具有低模式增益差的 12 芯超模掺铒光纤放大器,在 C 波段上的增益大于 17 dB,DMG 小于 1 dB。次年,该研究人员[15]通过优化掺铒光纤(Erbium-Doped Fiber, EDF)的长度,在侧面包层泵浦的条件下,实现了12个超模的复用传输,在L波段内实现平均增益为 15.7 dB,DMG小于1.2 dB的放大。2021 年,Sakamoto等[16]提出了一种12芯的 MC-SM-EDFA。通过紧密地部署 12个纤芯并调整 EDF的长度,可实现12个超模的复用传输,在 C 波段和 L 波段,实现模式增益分别大于20 dB和15 dB,以及DMG分别小于1 dB和2 dB。目前有关多芯超模掺铒光纤的研究主要是通过增加空分复用信道数、优化泵浦方式以及调整EDF的长度等,实现通信容量的扩容和降低DMG。但针对多芯超模掺铒光纤的结构设计鲜有报道。因此,优化光纤的结构参数和铒离子分布以进一步降低DMG具有重要意义。粒子群优化算法(PSO)源于对鸟群觅食行为的研究[17-18],粒子群通过信息共享使群体找到多变量优化问题的全局最优解,该算法非常适用于光纤设计的优化问题。
文中通过粒子群优化算法对各纤芯内的掺铒浓度进行了灵活地调控,确定了EDF较优的掺杂结构,降低了不同超模的交叠积分因子,实现了MC-SM-EDFA中${\rm{L{P}}_{01}}$,${\rm{L{P}}_{11{\text{a}}}}$,${\rm{L{P}}_{11 {\rm{b}}}}$,${\rm{L{P}}_{21 a}}$,${\rm{L{P}}_{21 {\rm{b}}}}$,${\rm{L{P}}_{02}}$,${\rm{L{P}}_{31 {\rm{a}}}}$,${\rm{L{P}}_{31 {\rm{b}}}}$,${\rm{L{P}}_{12 {\rm{a}}}}$和${\rm{L{P}}_{12 {\rm{b}}}}$超模的增益均衡。当10模式的输入功率均为−10 dBm时,该放大器在全C波段具有超过26.99 dB的平坦增益和低于0.45 dB的DMG。此外,文中对所设计的MC-SM-EDFA进行了各纤芯掺铒浓度制造容差的分析和增益性能可靠性的研究。
-
多芯超模掺铒光纤结构如图1(a)所示。该光纤中含有19个纤芯,分别为中心纤芯(1)和第一层纤芯(2~7)以及第二层纤芯(8~19),19个纤芯呈正六边形均匀分布。纤芯的半径为$ r $,相邻两个纤芯间距为$ d $,包层半径为$ R $,纤芯相对包层的折射率差为$ \Delta n $。其中,$ r ={5 \; \text{μ m}} $,$ d ={12 \; \text{μ m}} $,$ R = {{62.5}}{ \; \text{μ m}} $,$ \Delta n = 0.17 \text{%} $。多个纤芯分布在同一包层中,共同形成等效纤芯区域,其模场被限制在等效纤芯区域内,进而实现模场调控。

图 1 19芯超模光纤的折射率分布(1~19为纤芯编号)以及模场分布。(a)折射率分布;(b)模场分布
Figure 1. Refractive index distribution (cores numbered 1-19) and mode field distribution of the 19-core supermode fiber. (a) Refractive index distribution; (b) Mode field distribution
所提多芯超模光纤支持10模式($ {{\rm{LP}}_{01}} $,$ {{\rm{LP}}_{11{\text{a}}}} $,$ {{\rm{LP}}_{11 {\rm{b}}}} $,$ {{\rm{LP}}_{21 {\text{a}}}} $,$ {{\rm{LP}}_{21 {\text{b}}}} $,$ {{\rm{LP}}_{02}} $,$ {{\rm{LP}}_{31 {\text{a}}}} $,$ {{\rm{LP}}_{31 {\text{b}}}} $,$ {{\rm{LP}}_{12 {\text{a}}}} $和$ {{\rm{LP}}_{12 {\text{b}}}} $)同时传输。在1 550 nm信号波长处10模式沿光纤截面的归一化光强分布如图1(b)所示。可以看出,MCSMF相较于普通单芯少模光纤,信号光10种超模分布于光纤的等效纤芯区域中,拥有超大的有效模场面积$ {A_{eff}} $,使得非线性效应的影响显著降低。模场面积$ {A_{eff}} $的表达式为:
$$ {A_{eff}} = \frac{{{{\left| {\displaystyle\iint {I\left( {x,y,z} \right){\rm{d}}x{\rm{d}}y}} \right|}^2}}}{{\displaystyle\iint {{I^2}\left( {x,y,z} \right){\rm{d}}x{\rm{d}}y}}} $$ (1) 式中:$ I\left( {x,y,z} \right) $为模式光强分布。
多芯超模光纤的模式特性如图2所示。MCSMF的有效模场面积$ {A_{eff}} $和有效折射率差$ \Delta {N_{{\text{e}}ff}} $随$ d/r $的变化而变化,通过调整选取合适的$ d/r $,可以得到较大的有效模场面积和较小的模式串扰;此外,不同超模的差分群时延(Different Group Delay,DGD)较小,使得MCSMF的串扰性能优于等效的少模光纤。模式的功率限制因子Γ描述了光纤对模式的约束能力,由图2(c)可知,选取合适的$ d/r $可以得到较大的Γ,即光纤对光场的约束能力较强,但同时高阶模因其模场分布较为分散,其Γ与低阶模的相比较小,从而导致模式损耗增加。

图 2 (a) MCSMF的$ {A_{eff}} $和$ \Delta {N_{{\text{e}}ff}} $随$ d/r $的变化;(b) MCSMF的群时延随信号波长的变化;(c) MCSMF的Γ随$ d/r $的变化
Figure 2. (a) Variation of $ {A_{eff}} $ and $ \Delta {N_{{\text{e}}ff}} $ of MCSMF with $ d/r $; (b) Variation of group delay of the MCSMF with signal wavelength; (c) Variation of Γ of the MCSMF with $ d/r $
多芯超模光纤中铒离子在纤芯内单层均匀掺杂,掺杂浓度(体积分数,下同)按照纤芯的编号分别记为 $ {N}_{1} $,$ {N}_{2} $,···$ {N}_{19} $。
在各纤芯均匀掺杂的条件下,即设置$ {N}_{1} $,$ {N}_{2} $,···$ {N}_{19} $均为$ 4 \times {10^{24}}\;{{\text{m}}^{ - 3}} $,将上述多芯超模掺铒光纤作为增益光纤,对MC-SM-EDFA增益性能进行研究。设置各信号模式输入功率均为−10 dBm,信号波长为1 550 nm,泵浦波长为1 480 nm。
首先研究MC-SM-EDFA 10模式的增益和DMG随泵浦功率的变化,如图3(a)所示。设定光纤长度为8 m,仿真结果表明,当泵浦功率低于3 W时,随着泵浦功率的增大,各信号模式增益迅速增大。当泵浦功率达到3 W时,10模式的平均增益高达21.82 dB,DMG约为1.33 dB。当泵浦功率超过3 W时,各信号模式的增益逐步增大并趋于饱和。同时,DMG随着泵浦功率的变化逐步增加并趋于平稳,最终稳定在1.58 dB以下。
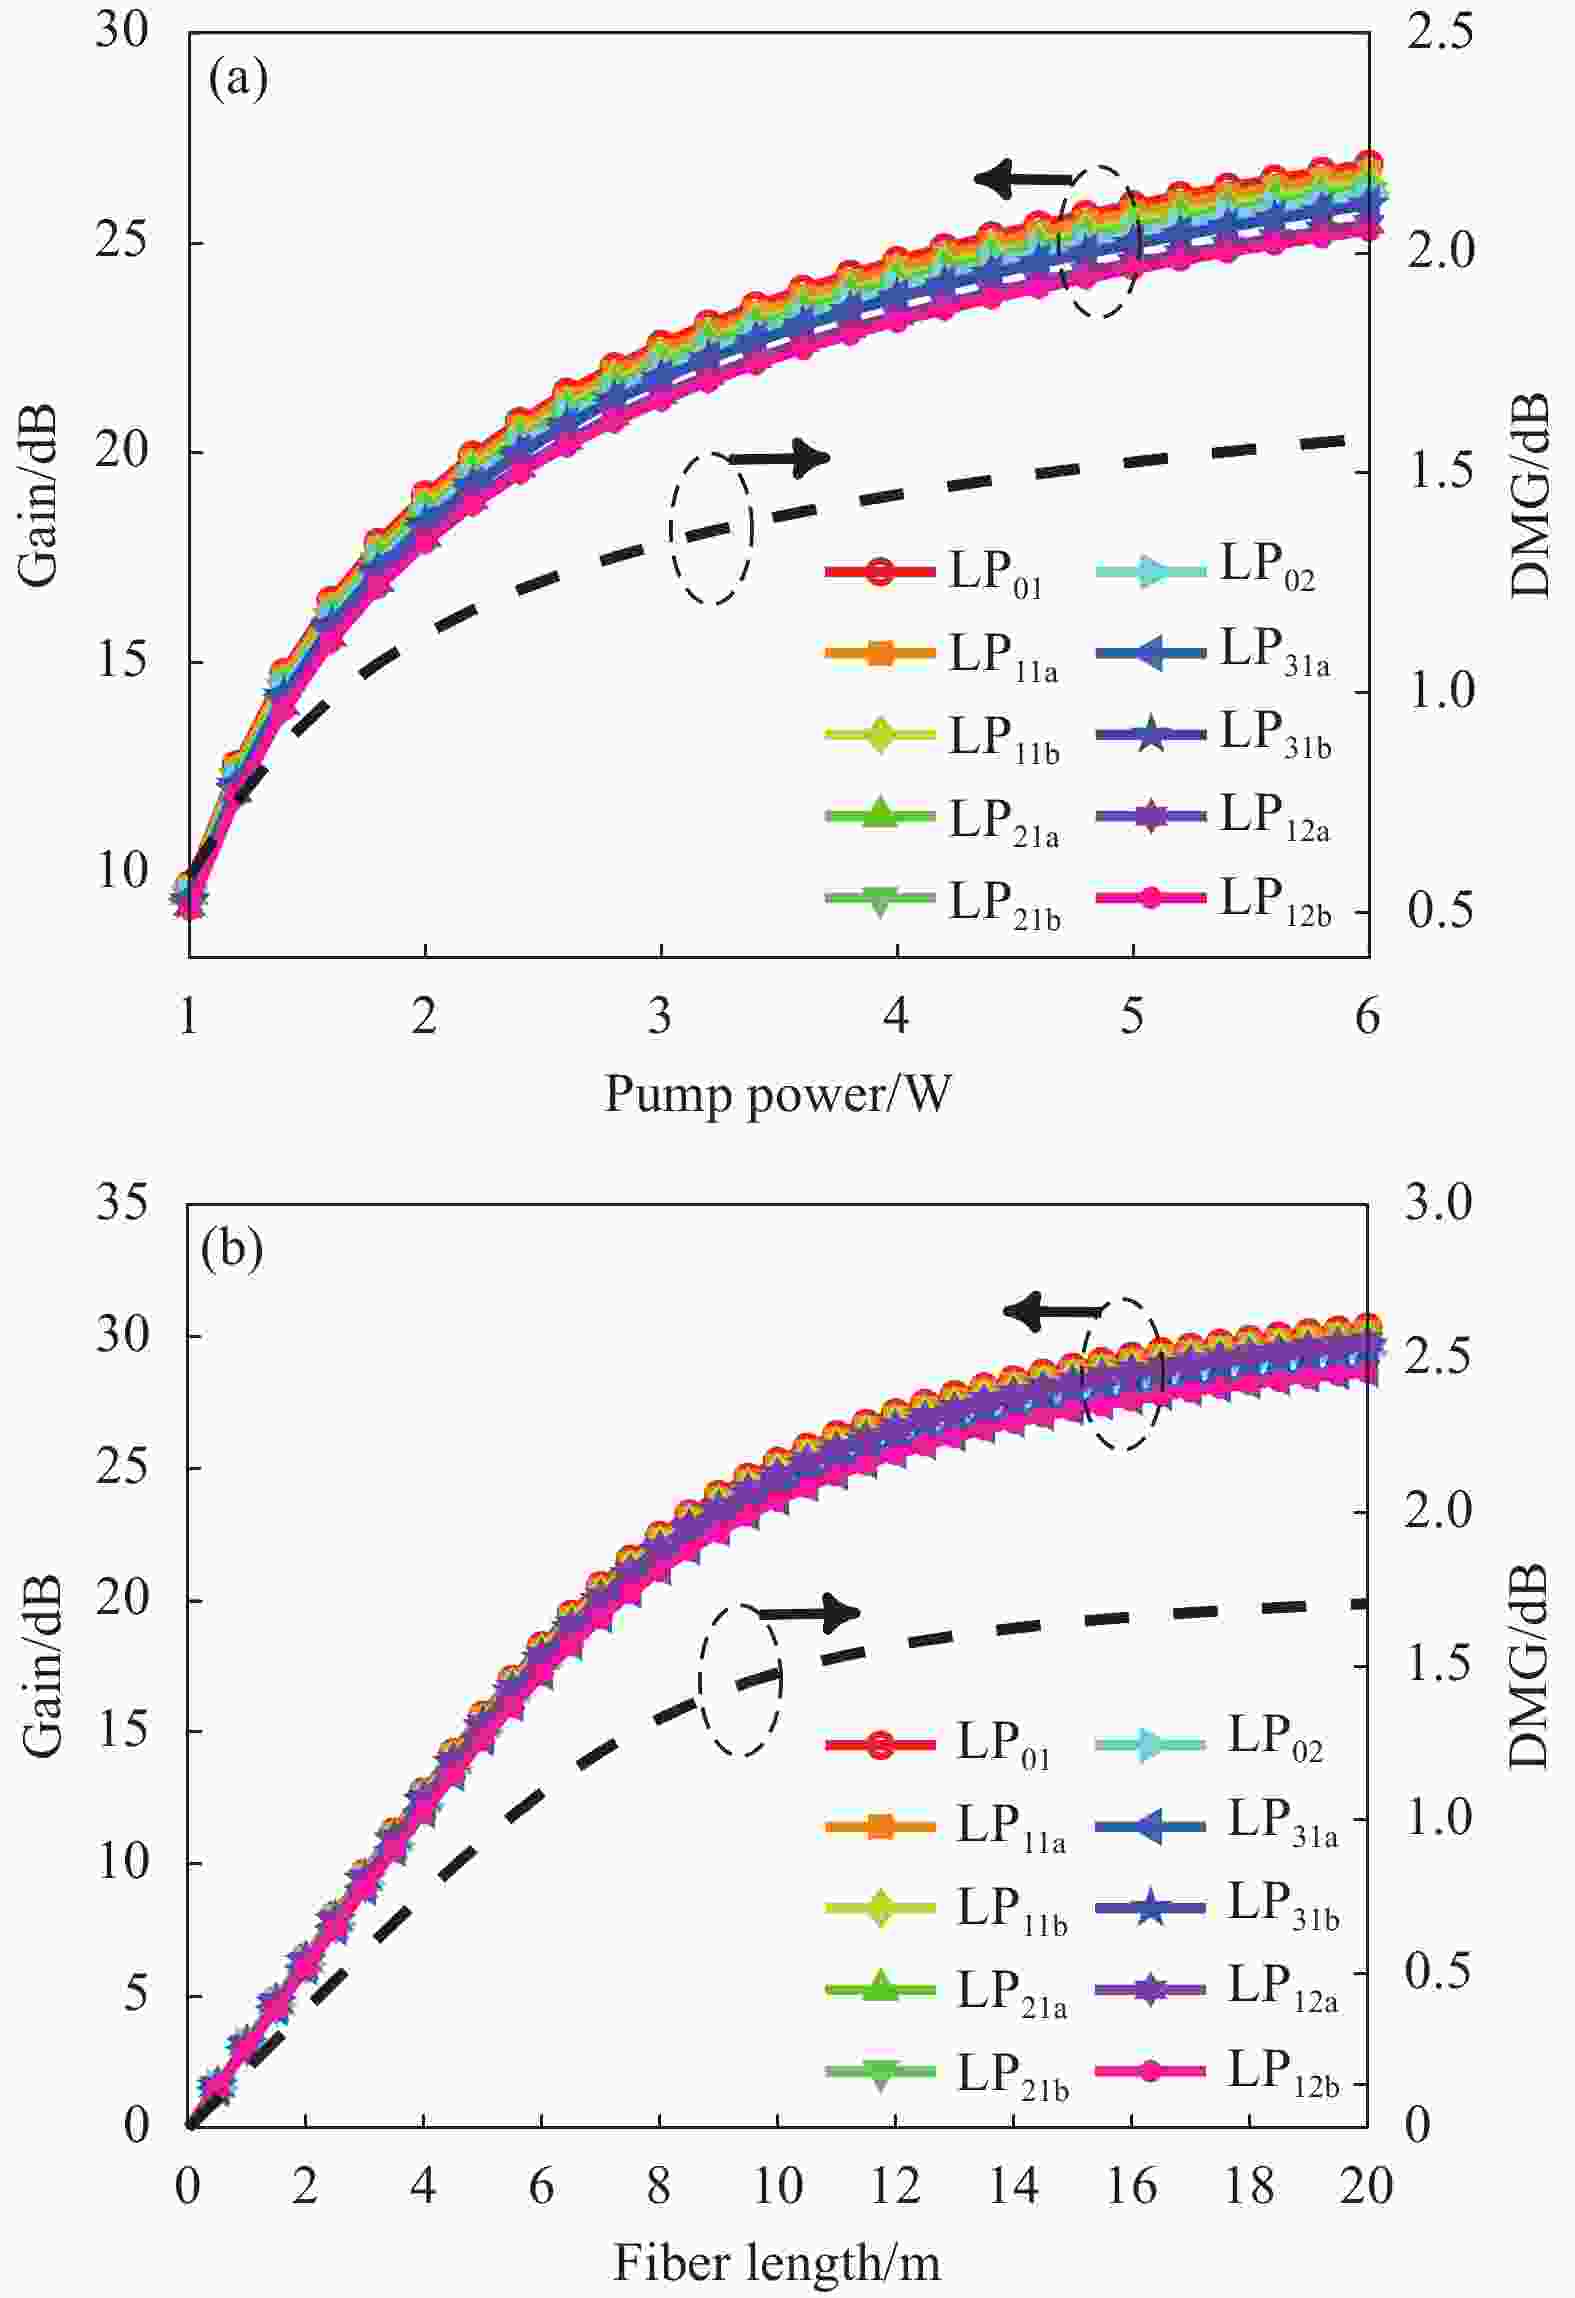
图 3 MC-SM-EDFA的增益和DMG随泵浦功率和光纤长度的变化。(a)泵浦功率;(b)光纤长度
Figure 3. Variation of gain and DMG of MC-SM-EDFA with pump power and fiber length. (a) Pump power; (b) Fiber length
MC-SM-EDFA中光纤长度对各信号模式的影响如图3(b)所示。设定泵浦功率为3 W。仿真结果表明,MC-SM-EDFA各信号模式的增益均随着光纤长度的增大而增大。当光纤长度为8 m时,10模式的平均增益为21.82 dB。当光纤长度超过8 m时,各信号模式增益逐步增大并趋于饱和。在改变光纤长度的过程中,$ {\mathrm{L}\mathrm{P}}_{01} $模式的增益最大,$ {\mathrm{L}\mathrm{P}}_{12} $模式的增益最小。10模式DMG的大小主要决定于$ {\mathrm{L}\mathrm{P}}_{01} $和$ {\mathrm{L}\mathrm{P}}_{12} $模的增益,并随光纤长度增大而增大,但DMG总是小于1.70 dB。
后续通过粒子群优化算法优化各纤芯内掺铒浓度来降低不同超模的交叠积分因子,进一步减小DMG,从而实现各信号模式的增益均衡。
-
多芯超模掺铒光纤是MC-SM-EDFA的核心,其信号的增益情况可根据速率方程计算得出,各信号模式的增益情况与信号光和泵浦光的归一化光强分布以及纤芯内铒离子分布有关,将光纤横截面上信号光、泵浦光以及铒离子分布的交叠程度定义为交叠积分因子[19],其表达式为:
$$ {\eta _k} = \iint {{\varGamma _{s,k}}\left( {x,y,z} \right){\varGamma _p}\left( {x,y,z} \right)}{N_0}\left( {x,y,z} \right){\rm{d}}x{\rm{d}}y $$ (2) 式中:$ {N_0}\left( {x,y,z} \right) $为纤芯内铒离子分布;$ {\varGamma _{s,k}}\left( {x,y,z} \right) $和$ {\varGamma _p}\left( {x,y,z} \right) $分别为信号光和泵浦光的归一化光强分布。
由速率方程和公式(2)可知,MC-SM-EDFA内,各信号模式间的增益情况与多芯超模掺铒光纤的交叠积分因子密切相关。通过粒子群算法优化降低交叠积分因子的差异,可实现MC-SM-EDFA中不同超模间的增益均衡。
PSO将个体鸟儿抽象成“粒子”,鸟群所寻找的食物则为“最优解”,是一种可在目标范围内搜索多变量优化问题最优解的智能算法。对于图1(a)中的光纤结构,需要同时优化多个纤芯的铒离子掺杂浓度,故采用粒子群算法进行优化计算。PSO对于光纤掺杂结构的优化问题而言:粒子群的规模$ M $为光纤结构的总数;种群搜索的目标范围为掺铒浓度的取值范围;种群飞行的空间维度$ D $为MCSMF的纤芯个数;个体的适应值$ fit $用于评估每个光纤掺杂结构的增益性能。取任一粒子对其优化过程进行描述,设该粒子当前的掺杂结构为$ {x_i} $,粒子此时的飞行速度为$ {v_i} $,则粒子在飞行过程中所经过的最优掺杂结构$ {P_{best}} $的表达式为:
$$ {P_{best}}_{_{i + 1}}\left( {t + 1} \right) = \left\{ {\begin{array}{*{20}{c}} {{P_{best}}_{_i}\left( t \right),f\left( {{x_i}\left( {t + 1} \right)} \right) \leqslant f\left( {{P_{best}}_{_i}\left( t \right)} \right)} \\ {{x_i}\left( {t + 1} \right),f\left( {{x_i}\left( {t + 1} \right)} \right) > f\left( {{P_{best}}_{_i}\left( t \right)} \right)} \end{array}} \right. $$ (3) 种群中当前的最优掺杂结构$ {g_{best}} $的更新表达式为:
$$ {g_{best}}\left( t \right) = \max \left\{ {f\left( {{P_{best}}_{_1}\left( t \right)} \right),f\left( {{P_{best}}_{_2}\left( t \right)} \right), \cdots \cdots ,f\left( {{P_{best}}_{_M}\left( t \right)} \right)} \right\} $$ (4) 粒子的飞行速度$ {v_i} $的更新表达式为:
$$ \begin{split} v_{id}^{t + 1} =& w \times v_{id}^t + {c_1} \times {r_1} \times \left( {{P_{id}} - x_{id}^t} \right) +\\ & {c_2} \times {r_2} \times \left( {{P_{gd}} - x_{id}^t} \right) \\ \end{split} $$ (5) 式中:$ w $为惯性权重;$ {c_1} $、 $ {c_2} $为学习因子;$ {r_1} $、$ {r_2} $为随机数;各项的上下标表示粒子$ i $在第$ t $次迭代中的$ d $维方向上的向量,如$ {v_{id}} $表示为速度分量、$ {x_{id}} $为位移分量、$ {P_{id}} $与$ {P_{gd}} $为粒子当前掺杂结构与种群最优掺杂结构的分量。光纤掺杂结构$ {x_{id}} $的更新表达式为:
$$ x_{id}^{t + 1} = x_{id}^t + v_{id}^{t + 1} $$ (6) 使用粒子群优化算法对MC-SM-EDFA的优化过程如图4所示。

图 4 粒子群算法的优化流程
Figure 4. Optimization process of particle swarm algorithm
其中利用适应值函数$ fit $来评估多芯超模光纤掺杂结构的增益性能,并将其定义为:
$$ fit = \frac{{\overline G }}{{{G_{{max} }} - {G_{{min} }}}} $$ (7) 式中:$ \overline G $为各信号模式的平均增益;${G_{{{max}} }} - {G_{{{min}} }}$为DMG。表示各信号模式的平均增益较大和DMG较小的光纤掺杂结构较易保留,因此能较快获得结构最优多芯超模掺铒光纤。适应值函数对PSO的优化结果起到决定性的作用。
-
由于设计的多芯超模光纤有19个纤芯,需要对各纤芯中的铒离子掺杂浓度进行优化,故一个粒子的维度是19。设置仿真系统参数:种群规模$ M $为500,迭代次数$ T $为200,各信号模式输入功率均为–10 dBm,信号波长为1 550 nm,光纤长度为8 m,包层泵浦功率为3 W,掺铒浓度的上下限分别为$ 1 \times {10^{25}}{\text{ }}{{\text{m}}^{ - 3}} $和$ 1 \times {10^{24}}{\text{ }}{{\text{m}}^{ - 3}} $。基于以上参数,根据PSO的流程进行优化。
完成优化后,最终在1 550 nm信号波长处得到平均增益为27.79 dB、最大DMG由各纤芯均匀掺杂时的1.33 dB降低至0.20 dB,且NF小于3.79 dB的MC-SM-EDFA,对应掺铒光纤放大器的适应度函数$ fit $值为135.98,$ {N}_{1} $,$ {N}_{2} $,···$ {N}_{19} $的值分别为$ 6.723 \times {10^{24}} $,$ 1 \times {10^{25}} $,$ 3.490 \times {10^{24}} $,$ 1 \times {10^{25}} $,$ 1 \times {10^{24}} $,$ 1 \times {10^{25}} $,$ 6.668 \times {10^{24}} $,$ 6.431 \times {10^{24}} $,$ 1 \times {10^{24}} $,$ 1 \times {10^{25}} $,$ 5.654 \times {10^{24}} $,$ 1 \times {10^{25}} $,$ 1 \times {10^{25}} $,$ 1 \times {10^{25}} $,$ 1 \times {10^{25}} $,$ 1 \times {10^{24}} $,$ 6.919 \times {10^{24}} $,$4.071 \times {10^{24}}$,$ 7.434 \times {10^{24}} $。
各纤芯掺杂MC-SM-EDFA 10模式的增益、DMG以及噪声系数(NF)随泵浦功率的变化,如图5所示。
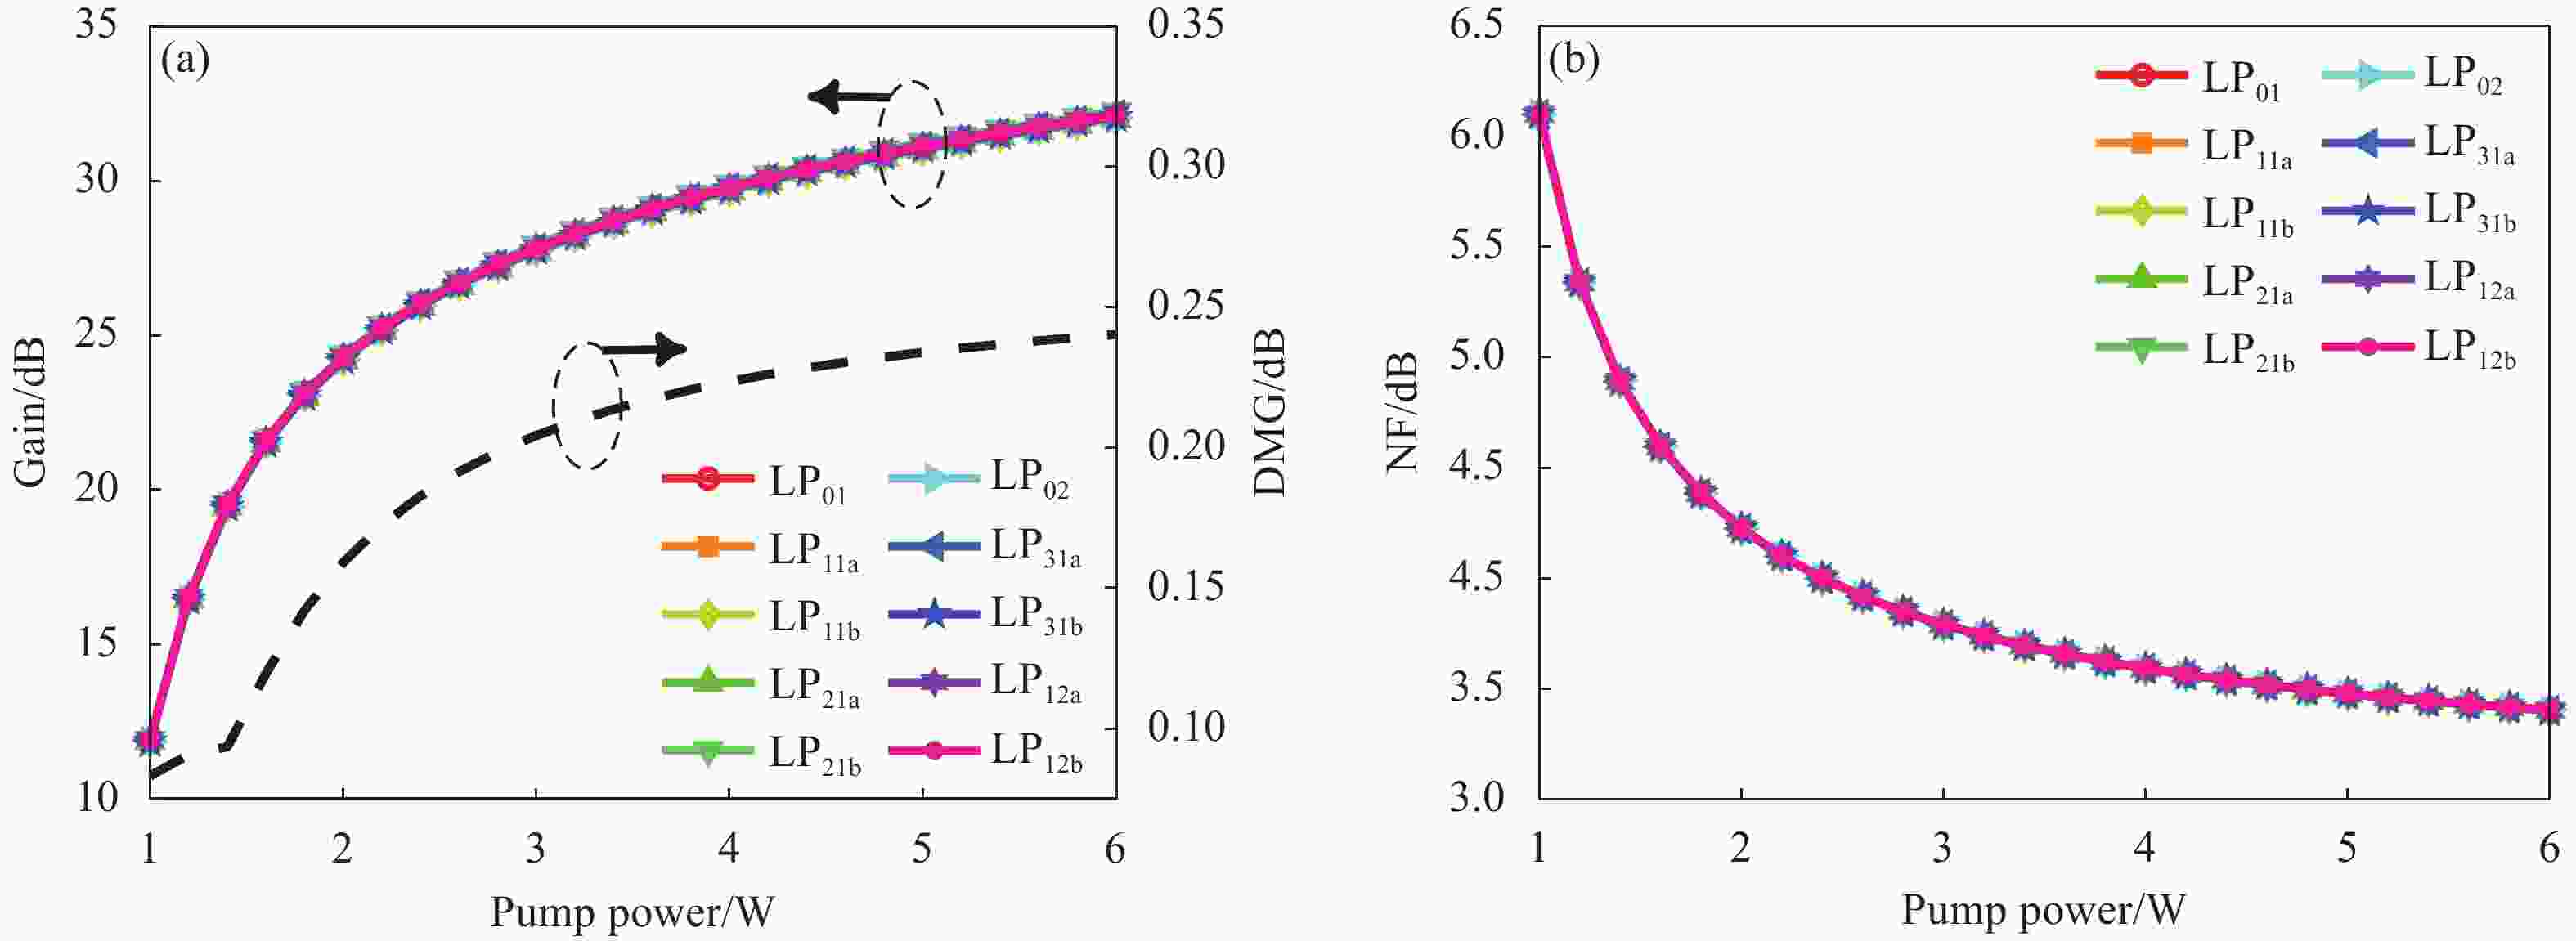
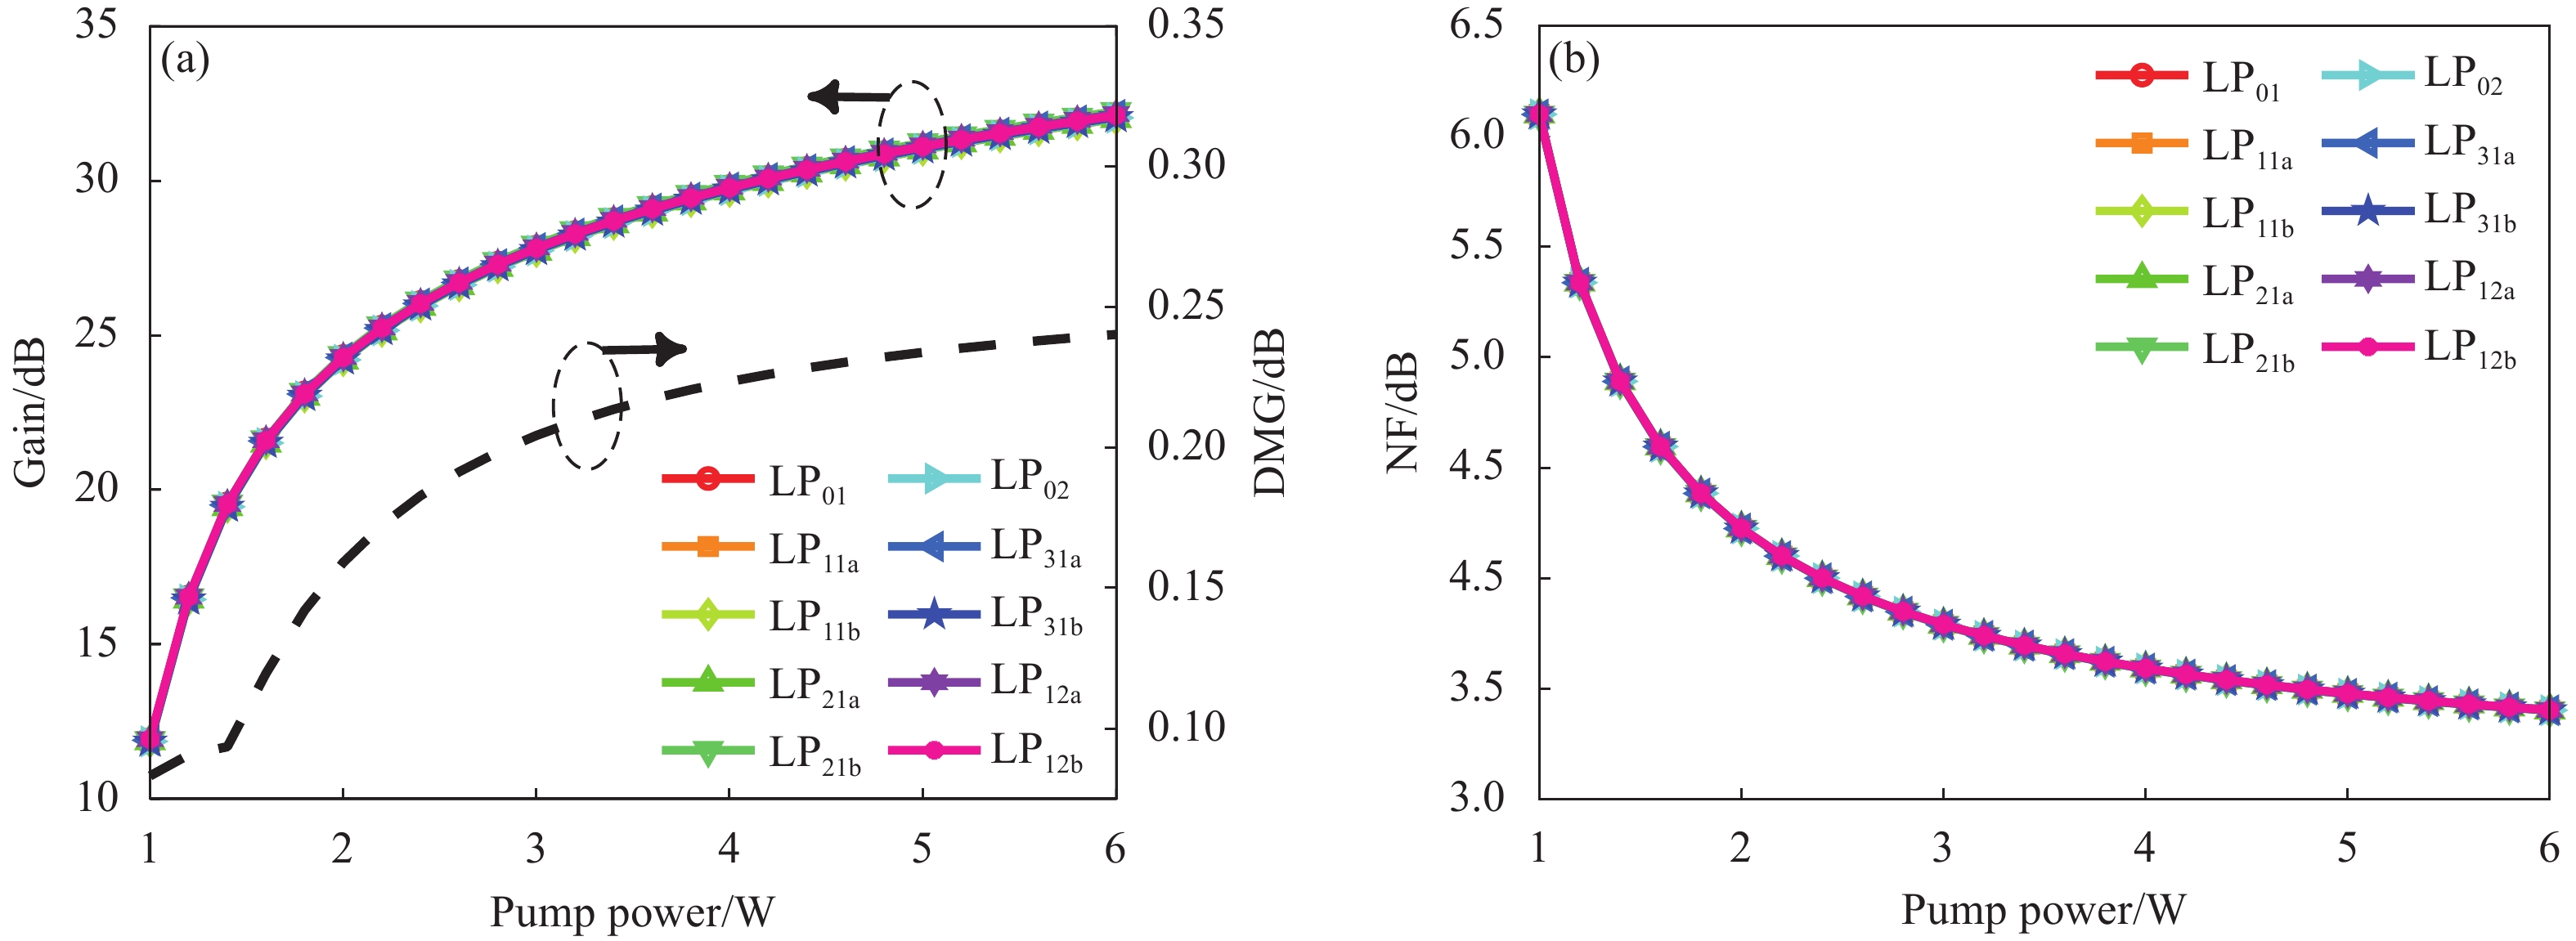
图 5 MC-SM-EDFA的增益和噪声系数随泵浦功率变化。(a)增益和DMG;(b)噪声系数
Figure 5. Variation of gain and noise figure of MC-SM-EDFA with pump power. (a) Gain and DMG; (b) NF
设定光纤长度为8 m,仿真结果表明,当泵浦功率低于3 W时,随着泵浦功率的增大,各信号模式增益迅速增大,而各信号模式NF迅速减小,且各信号模式的NF存在细微差别,这是由于在同一波长处各信号模式产生的前向自发辐射噪声(ASE)场分布与各信号模场分布相同,故各信号模式的前向ASE功率差别较小。又因为所提出的MC-SM-EDFA具有较低的DMG,故可得出各信号模式的NF近似相等。当泵浦功率达到3 W时,10模式的平均增益高达27.79 dB以及10模式的平均NF为3.79 dB,而DMG约为0.20 dB。当泵浦功率超过3 W时,各信号模式的增益逐步增大并趋于饱和,而各信号模式NF逐步减小并趋于平稳,但一直高于3.40 dB。同时,DMG随着泵浦功率变化逐步增加并趋于平稳,最终稳定在0.24 dB以下,这表明泵浦功率的波动对DMG和NF的影响均较小。
各纤芯掺杂MC-SM-EDFA中光纤长度对各信号模式的影响如图6所示。设定泵浦功率为3 W。仿真结果表明,MC-SM-EDFA各信号模式的增益均随着光纤长度的增大而增大。当光纤长度为8 m时,10模式的平均增益为27.79 dB。当光纤长度超过8 m时,各信号模式增益逐步增大并趋于饱和。10模式的DMG随光纤长度增大而增大,但DMG始终小于0.28 dB。当光纤长度小于3 m时,各信号模式的NF随光纤长度增加而快速增加。当光纤长度为3 m时,10模式平均NF为3.84 dB。当光纤长度大于3 m时,各信号模式NF逐步增大且趋于平缓,但始终小于3.98 dB,这表明光纤长度改变对NF的影响不大。

图 6 MC-SM-EDFA的增益和噪声系数随光纤长度的变化。(a)增益和DMG;(b)噪声系数
Figure 6. Variation of gain and noise figure of MC-SM-EDFA with fiber length. (a) Gain and DMG; (b) NF
将各纤芯掺杂的多芯超模光纤作为增益光纤,对MC-SM-EDFA在C波段(1 530~1 565 nm)的增益特性进行研究,设置泵浦功率为3 W,光纤长度为8 m,则各信号模式在C波段的增益、DMG以及NF如图7所示。
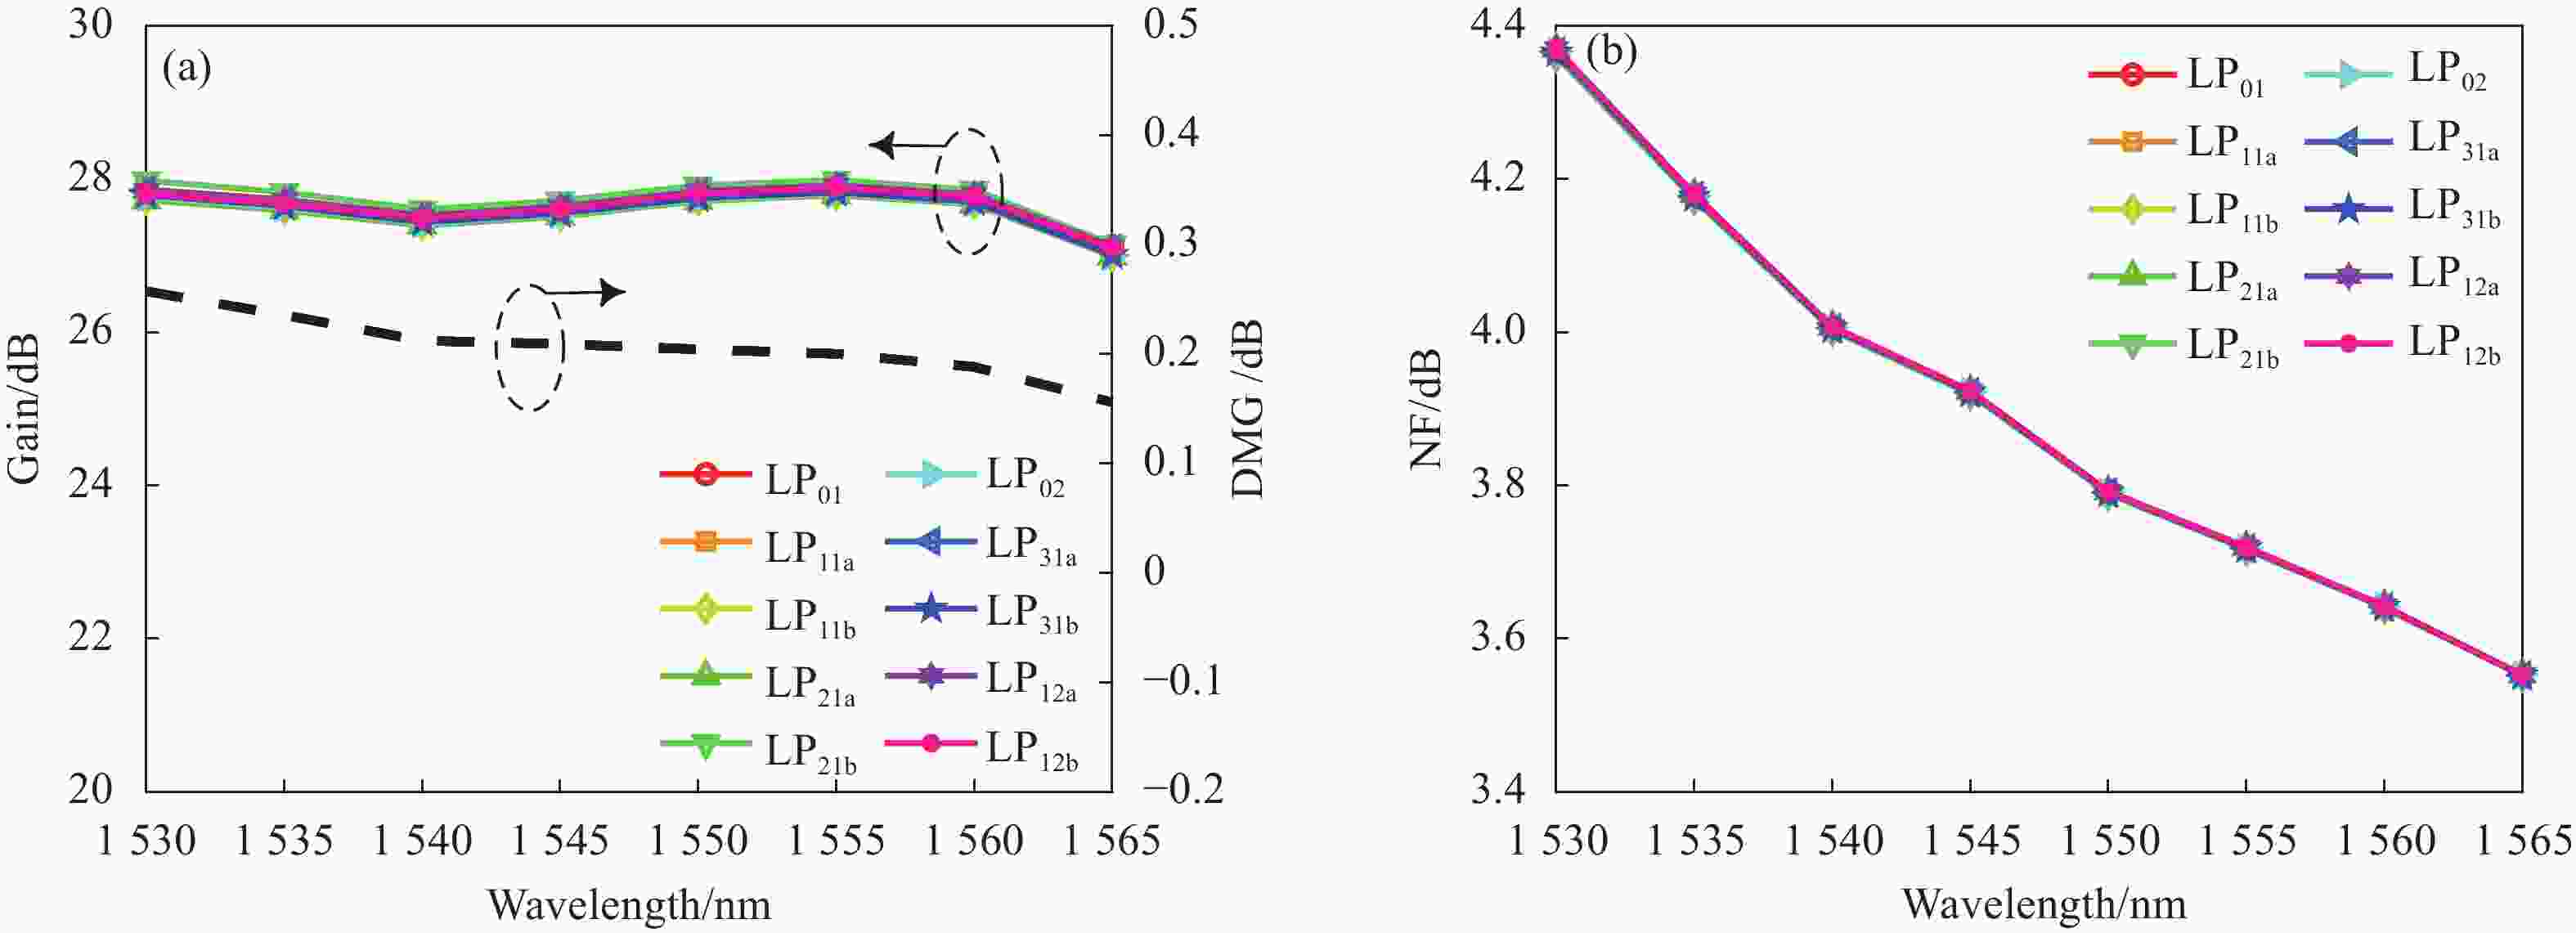
图 7 MC-SM-EDFA的增益和噪声系数随信号波长的变化。(a)增益和DMG;(b)噪声系数
Figure 7. Variation of gain and noise figure of MC-SM-EDFA with signal wavelength. (a) Gain and DMG; (b) NF
由仿真结果可知,MC-SM-EDFA在C波段上,不同信号波长处各信号模式的增益均高于25 dB且增益平坦度均低于1 dB,噪声系数均为3.4~4.4 dB,且DMG随信号波长的变化较小。随着信号波长从1 530 nm逐步增大至1 565 nm,DMG呈现逐步减小的趋势,并在1 565 nm处达到最小值0.16 dB;在C波段中,MC-SM-EDFA各信号模式的NF均为3.4~4.4 dB,并且随着信号波长的增大而呈现逐步减小的趋势。数值仿真表明,MC-SM-EDFA在C波段(1 530~1 565 nm)上的各信号模式均具有超过25 dB的增益以及较低的DMG和NF。
-
对MC-SM-EDFA的10模式放大性能及增益均衡进行了研究。理论分析结果表明,利用PSO对光纤各纤芯内铒离子掺杂浓度进行优化可达到较低的DMG。但是光纤制造过程中的准确性将影响MC-SM-EDFA增益性能及均衡效果。因此,基于以上理论研究,详细分析了具有最佳掺杂结构的多芯超模光纤在制造过程中存在的缺陷对于MC-SM-EDFA增益特性的影响。
该研究利用Monte Carlo方法仿真分析了铒离子掺杂浓度的偏差对于MC-SM-EDFA均衡效果的影响。将19个纤芯掺铒浓度的变化范围均设定为−5%~5% 和−10%~10%,分别采用大量随机样本模拟研究了MC-SM-EDFA的DMG分布特性,其仿真结果如图8所示。研究表明,当掺铒浓度设置不合理时,将导致MC-SM-EDFA的增益性能严重恶化。当纤芯中掺铒浓度的变化范围为−5%~5%时,MC-SM-EDFA的DMG低于0.7 dB的概率高达90.87%;当纤芯中掺铒浓度的变化范围为−10%~10%时,MC-SM-EDFA的DMG低于1.3 dB的概率高达90.07%。这表明在实现MC-SM-EDFA的低DMG以达到增益均衡的目标时,所提出的MC-SM-EDFA结构具有较好的鲁棒性。
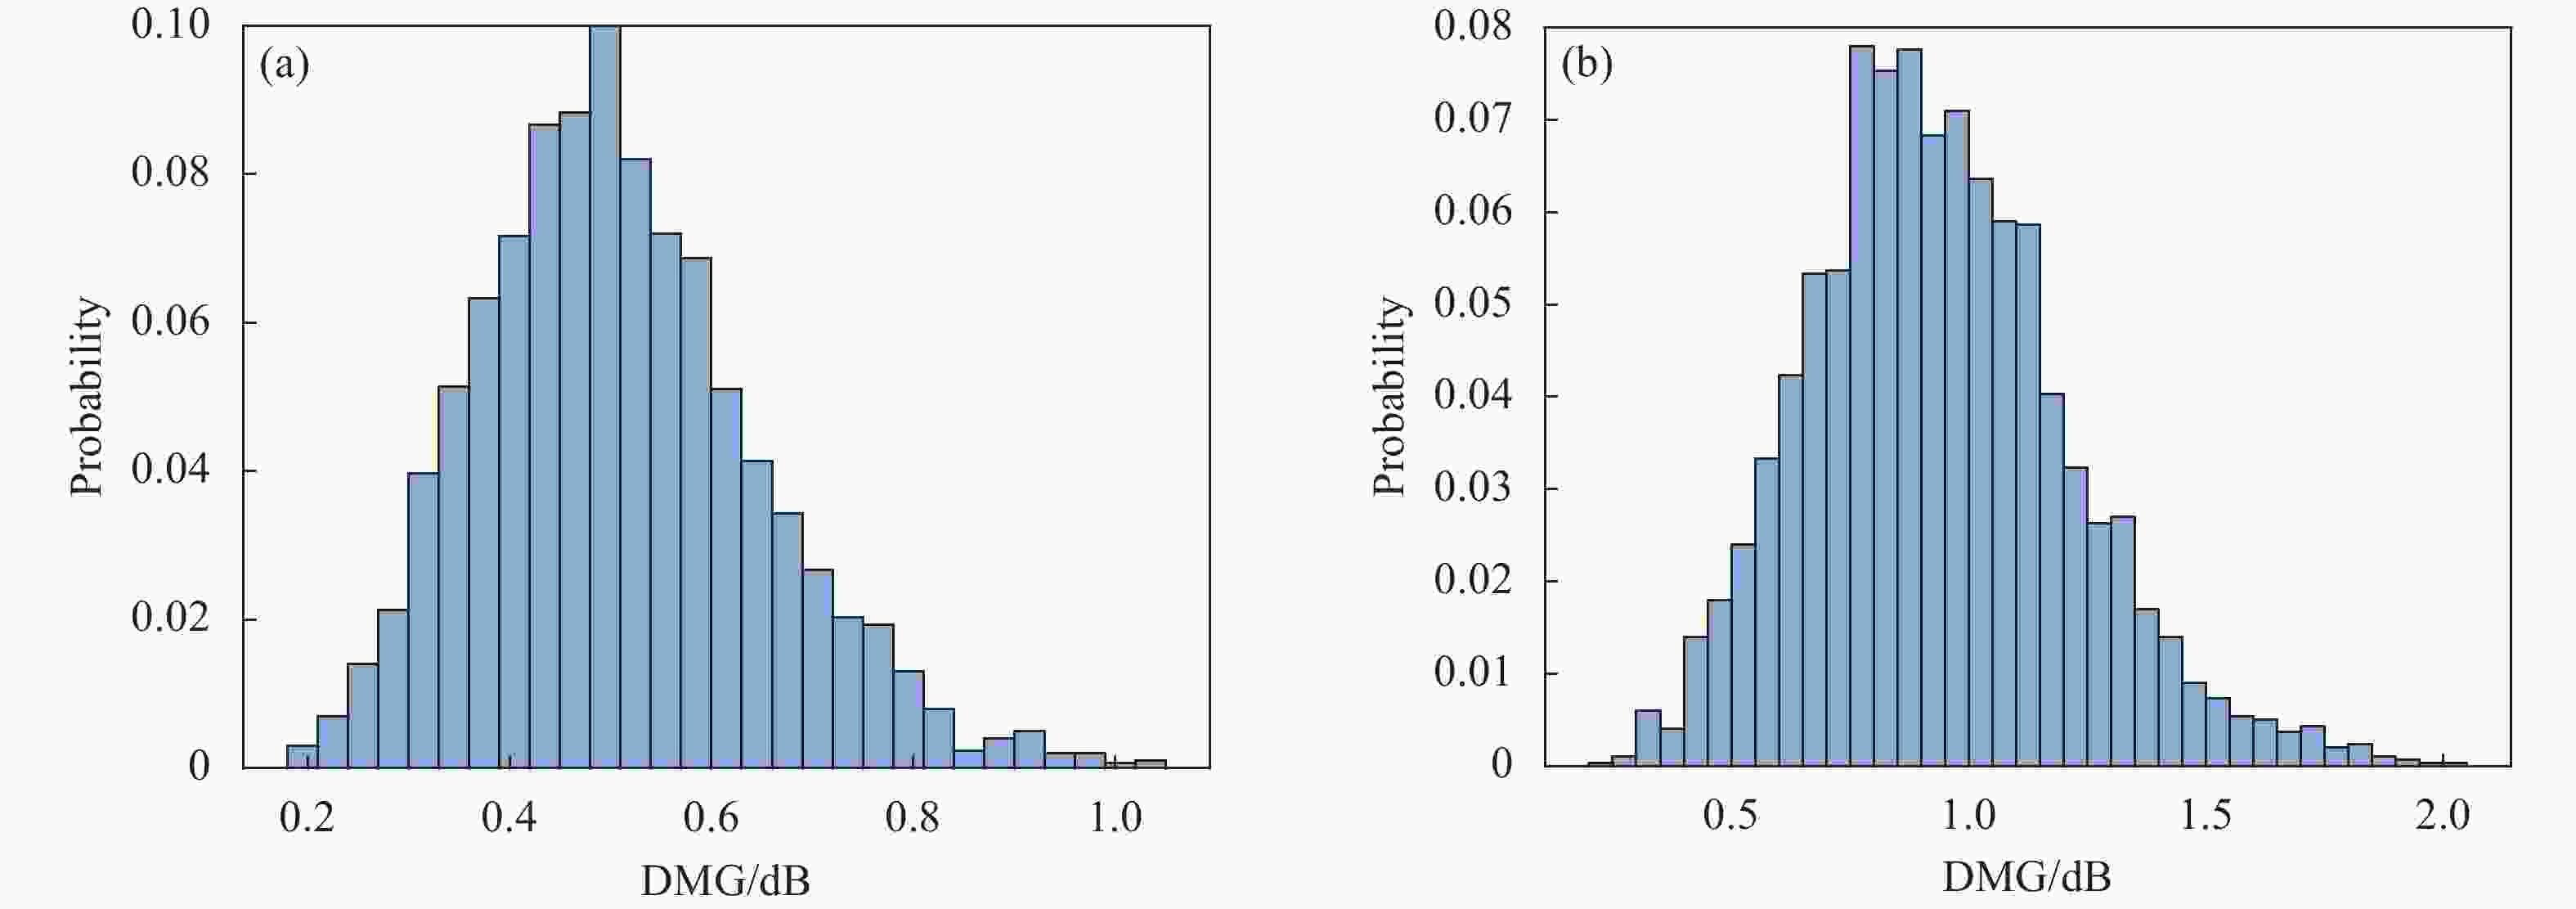
图 8 DMG的分布特性。(a)掺铒浓度变化范围为 −5 % ~ 5 %;(b)掺铒浓度变化范围为 −10 % ~ 10 %
Figure 8. Distribution characteristics of DMG. (a) Erbium-doped concentration varies from −5% to 5%; (b) Erbium-doped concentration varies from −10% to 10%
-
文中利用粒子群算法优化MCSMF中各纤芯的掺铒浓度,该算法通过降低不同超模的交叠积分因子,从而减小模式增益差(DMG),实现了支持10模式($ {{\rm{LP}}_{01}} $,$ {{\rm{LP}}_{11{\text{a}}}} $,$ {{\rm{LP}}_{11 {\text{b}}}} $,${{\rm{LP}}_{21 \text{a}}}$,$ {{\rm{LP}}_{21 {\text{b}}}} $,$ {{\rm{LP}}_{02}} $,${{\rm{LP}}_{31 \text{a}}}$,$ {{\rm{LP}}_{31 {\text{b}}}} $,${{\rm{LP}}_{12 \text{a}}}$和$ {{\rm{LP}}_{12 {\text{b}}}} $)MC-SM-EDFA中各信号模式的同时放大以及增益均衡。仿真结果表明,当MC-SM-EDFA中铒离子以不同浓度灵活地掺杂于各纤芯时,10模式在1 550 nm信号波长处的DMG为0.20 dB,且在C波段(1 530~1 565 nm)上信号各模式增益均超过26.99 dB,DMG小于0.26 dB以及NF小于4.37 dB,同时整个C波段的增益平坦度低于1 dB。最后,对DMG在光纤制造偏差方面的容忍度进行分析,结果显示所提出的MC-SM-EDFA增益性能稳定。此外,MC-SM-EDFA采用纤芯内铒离子单层均匀掺杂以实现增益均衡,并不需要类似于少模掺铒光纤放大器(FM-EDFA)的纤芯内铒离子分层掺杂设计,所以MC-SM-EDFA在设计与制造方面也存在一定优势。
Design of gain equalization for multi-core supermode fiber amplifier (inside back cover paper)
-
摘要: 多芯超模光纤(MCSMF)的芯间距较小,多个芯子共同形成芯区支持多个超模传输,与普通单芯少模光纤相比,其具有较大的有效模场面积和较小的模式串扰,备受关注。MCSMF用于长距离传输时,与其相匹配的新型增益均衡放大器是实现信号中继并保持信号稳定传输的必要器件。文中提出了一种基于粒子群优化算法的19芯超模光纤增益均衡放大器,该光纤支持10个超模共同传输。通过粒子群算法分别优化各纤芯内掺铒浓度来降低不同超模的交叠积分因子,从而减小模式增益差(DMG)。结果表明,在包层泵浦条件下,最大DMG从1.33 dB (各纤芯均匀掺杂)降低至0.20 dB,在1 550 nm信号波长处10模式的平均增益为27.79 dB,且该放大器在整个C波段的增益平坦度低于1 dB。Abstract:
Objective Multi-core supermode fiber (MCSMF) with small inter-core spacing enable multiple cores to form a core region that supports the transmission of multiple supermodes. In comparison to conventional single-core few modes fiber, MCSMF has a larger effective mode field area and lower mode crosstalk, making it highly attractive. When used for long-distance transmission, novel gain equalization amplifier that is compatible with MCSMF is a necessary device to achieve signal relaying and maintain stable signal transmission. Current research on MCSMF mainly focuses on increasing the number of spatially multiplexed channels, optimizing pumping methods, and adjusting the length of the erbium-doped fiber (EDF) to expand communication capacity and reduce differential mode gain (DMG). However, there are few reports on the structural design of MCSMF. Therefore, it is of great significance to optimize the fiber's structural parameters and erbium ion distribution to further reduce DMG. In this study, the particle swarm optimization algorithm was employed to flexibly control the erbium doping concentration in each fiber core, determining the optimal doping structure of the EDF. This approach reduces the overlap integral factors of different supermodes and achieves gain equalization for $ {{\rm{LP}}_{01}} $, $ {{\rm{LP}}_{11{\text{a}}}} $, $ {{\rm{LP}}_{11{\text{b}}}} $, $ {{\rm{LP}}_{21{\text{a}}}} $, $ {{\rm{LP}}_{21{\text{b}}}} $, $ {{\rm{LP}}_{02}} $, $ {{\rm{LP}}_{31{\text{a}}}} $, $ {{\rm{LP}}_{31{\text{b}}}} $, $ {{\rm{LP}}_{12{\text{a}}}} $ and $ {{\rm{LP}}_{12{\text{b}}}} $ in the MC-SM-EDFA. Methods The designed MCSMF in this study consists of 19 fiber cores (Fig.1), including a central core (1), the first layer of cores (2-7), and the second layer of cores (8-19). These 19 cores are uniformly distributed in a hexagonal pattern. In the MCSMF, erbium ions are uniformly doped within a single layer of each fiber core. The doping concentration (volume fraction) in each core is denoted as $ {N}_{1} $, $ {N}_{2} $, ···$ {N}_{19} $ according to the core numbering. The particle swarm optimization algorithm is utilized to optimize the erbium doping concentration in each fiber core, aiming to reduce the overlap integral factors of different supermodes and further minimize DMG. This optimization process enables the achievement of gain equalization for various signal modes. Results and Discussions After optimization, the MC-SM-EDFA achieved an average gain of 27.79 dB, DMG of only 0.20 dB, and NF below 3.79 dB at a signal wavelength of 1 550 nm. Furthermore, the MC-SM-EDFA exhibited gains higher than 25 dB and gain flatness below 1 dB for different signal wavelengths in the C-band (Fig.7). The noise figure ranged from 3.4 dB to 4.4 dB, and the DMG showed minimal variation with signal wavelength. Additionally, using the Monte Carlo method, this study conducted simulations to analyze the impact of erbium ion doping concentration deviations on the balancing performance of the MC-SM-EDFA. The results demonstrated that the proposed MC-SM-EDFA structure exhibits good robustness (Fig.8). Conclusions The proposed MC-SM-EDFA in this study supports simultaneous amplification and gain equalization of 10 modes. Simulation results demonstrate that when erbium ions are flexibly doped at different concentrations in each fiber core of the MC-SM-EDFA, the DMG at a signal wavelength of 1 550 nm for the 10 modes is 0.20 dB. In the C-band (1 530-1 565 nm), all signal modes achieve gains exceeding 26.99 dB, with DMG below 0.26 dB and NF below 4.37 dB. Additionally, the gain flatness in the C-band is below 1 dB. Furthermore, the tolerance analysis of DMG to fiber manufacturing deviations indicates stable gain performance of the proposed MC-SM-EDFA. Moreover, the MC-SM-EDFA achieves gain equalization by uniformly doping erbium ions in a single layer within each fiber core, eliminating the need for a layered doping design, as required in few-mode erbium-doped fiber amplifier (FM-EDFA). Therefore, the MC-SM-EDFA offers certain advantages in terms of design and manufacturing. -
图 1 19芯超模光纤的折射率分布(1~19为纤芯编号)以及模场分布。(a)折射率分布;(b)模场分布
Figure 1. Refractive index distribution (cores numbered 1-19) and mode field distribution of the 19-core supermode fiber. (a) Refractive index distribution; (b) Mode field distribution
图 2 (a) MCSMF的$ {A_{eff}} $和$ \Delta {N_{{\text{e}}ff}} $随$ d/r $的变化;(b) MCSMF的群时延随信号波长的变化;(c) MCSMF的Γ随$ d/r $的变化
Figure 2. (a) Variation of $ {A_{eff}} $ and $ \Delta {N_{{\text{e}}ff}} $ of MCSMF with $ d/r $; (b) Variation of group delay of the MCSMF with signal wavelength; (c) Variation of Γ of the MCSMF with $ d/r $
图 3 MC-SM-EDFA的增益和DMG随泵浦功率和光纤长度的变化。(a)泵浦功率;(b)光纤长度
Figure 3. Variation of gain and DMG of MC-SM-EDFA with pump power and fiber length. (a) Pump power; (b) Fiber length
图 5 MC-SM-EDFA的增益和噪声系数随泵浦功率变化。(a)增益和DMG;(b)噪声系数
Figure 5. Variation of gain and noise figure of MC-SM-EDFA with pump power. (a) Gain and DMG; (b) NF
图 6 MC-SM-EDFA的增益和噪声系数随光纤长度的变化。(a)增益和DMG;(b)噪声系数
Figure 6. Variation of gain and noise figure of MC-SM-EDFA with fiber length. (a) Gain and DMG; (b) NF
图 7 MC-SM-EDFA的增益和噪声系数随信号波长的变化。(a)增益和DMG;(b)噪声系数
Figure 7. Variation of gain and noise figure of MC-SM-EDFA with signal wavelength. (a) Gain and DMG; (b) NF
-
[1] Essiambre R J, Foschini G, Winzer P, et al. Capacity limits of fiber-optic communication systems[C]//2009 Conference on Optical Fiber Communication, New York: IEEE Press, 2009: 1-37. [2] Alam S U, Jung Y M, Kang Q Y, et al. Recent progress in the development of few mode fiber amplifier[C]//2015 Optical Fiber Communications Conference and Exhibition (OFC), New York: IEEE Press, 2015: Tu3C.1. [3] Ferreira F M, Fonseca D, Da Silva H J. Design of few-mode fibers with M-modes and low differential mode delay [J]. Journal of Lightwave Technology, 2013, 32(3): 353-360. [4] Xie Y H, Pei L, Zheng J J, et al. Design of steering wheel-type ring depressed-core 10-mode fiber with fully improved mode spacing [J]. Optics Express, 2021, 29(10): 15067-15077. doi: 10.1364/OE.424554 [5] Hayashi T, Tamura Y, Hasegawa T, et al. 125-μm-cladding coupled multi-core fiber with ultra-low loss of 0.158 dB/km and record-low spatial mode dispersion of 6.1 ps/km[C]//2016 Optical Fiber Communications Conference and Exhibition (OFC), New York: IEEE Press, 2016: Th5A. 1. [6] Sakamoto T, Matsui T, Saitoh K, et al. Low-loss and low-dmd few-mode multi-core fiber with highest core multiplicity factor[C]//Optical Fiber Communications Conference Postdeadline Paper, Washington: OSA, 2016: Th5A.2. [7] Xie Y H, Pei L, Zheng J J, et al. Low-DMD and low-crosstalk few-mode multi-core fiber with air-trench/holes assisted graded-index profile [J]. Optics Communications, 2020, 474: 126155. doi: 10.1016/j.optcom.2020.126155 [8] Saitoh K, Koshiba M, Takenaga K, et al. Crosstalk and core density in uncoupled multicore fibers [J]. IEEE Photonics Technology Letters, 2012, 24(21): 1898-1901. doi: 10.1109/LPT.2012.2217489 [9] Xia C, Bai N, Ozdur I, et al. Supermodes for optical transmission [J]. Optics Express, 2011, 19(17): 16653-16664. doi: 10.1364/OE.19.016653 [10] Ho K H, Kahn J M. Statistics of group delays in multimode fiber with strong mode coupling [J]. Journal of Lightwave Technology, 2011, 29(21): 3119-3128. doi: 10.1109/JLT.2011.2165316 [11] Rademacher G, Luís R S, Puttnam B J, et al. A comparative study of few-mode fiber and coupled-core multi-core fiber transmission [J]. Journal of Lightwave Technology, 2022, 40(6): 1590-1596. doi: 10.1109/JLT.2021.3124521 [12] Hayashi T, Sakamoto T, Ryf R, et al. Randomly-coupled multi-core fiber technology[C]//Proceedings of the IEEE, 2022. [13] Fontaine N K, Antonio-Lopez J, Chen H, et al. Coupled-core optical amplifier[C]//Optical Fiber Communication Conference. IEEE, 2017. [14] Wada M, Sakamoto T, Yamamotoet T, et al. Cladding pumped randomly coupled 12-core erbium-doped fiber amplifier with low mode-dependent gain[J]. Journal of Lightwave Technology, 2018, 36(5): 1220-1225. [15] Wada M, Sakamoto T, Aozasa S, et al. L-band randomly-coupled 12 core erbium doped fiber amplifier[C]//2019 Optical Fiber Communications Conference and Exhibition (OFC), 2019: 1-3. [16] Sakamoto T, Wada M, Aozasa S, et al. Characteristics of randomly coupled 12-core erbium-doped fiber amplifier[J]. Journal of Lightwave Technology, 2021, 39(4): 1186-1193. [17] 叶华, 谭冠政, 李广等. 基于稀疏表示与粒子群优化算法的非平稳信号去噪研究[J]. 红外与激光工程, 2018, 47(07): 0726005. Ye Hua, Tan Guanzheng, Li Guang, et al. De-noising nonstationary signal based on sparse representation and particle swarm optimization [J]. Infrared and Laser Engineering, 2018, 47(7): 0726005. (in Chinese) [18] 张尧, 王宏力, 陆敬辉等. 基于粒子群算法的星敏感器光学误差标定方法[J]. 红外与激光工程, 2017, 46(10): 172-179. Zhang Yao, Wang Hongli, Lu Jinghui, et al. Calibration method of optical errors for star sensor based on particle swarm optimization algorithm [J]. Infrared and Laser Engineering, 2017, 46(10): 1017002. (in Chinese) [19] Herbster A F. Few-mode erbium-doped fiber amplifier design challenges for WDM optical networks[C]//2019 SBFoton International Optics and Photonics Conference (SBFoton IOPC). IEEE, 2019. -

 点击查看大图

计量
- 文章访问数: 96
- HTML全文浏览量: 21
- PDF下载量: 31
- 被引次数: 0

