2023 Vol. 52, No. 10

Optical communication and sensing
Research on spatial resolution improvement of distributed optical fiber temperature measurement based on Raman signal segmentation and reconstruction
Li Shuo, Wang Jiqiang, Gao Zhongguo, Gao Jianxin, Hou Zemin, Jiang Long, Hou Moyu
2023, 52(10): 20230076. doi: 10.3788/IRLA20230076
[Abstract](91) [FullText HTML] (29) [PDF 1292KB](40)
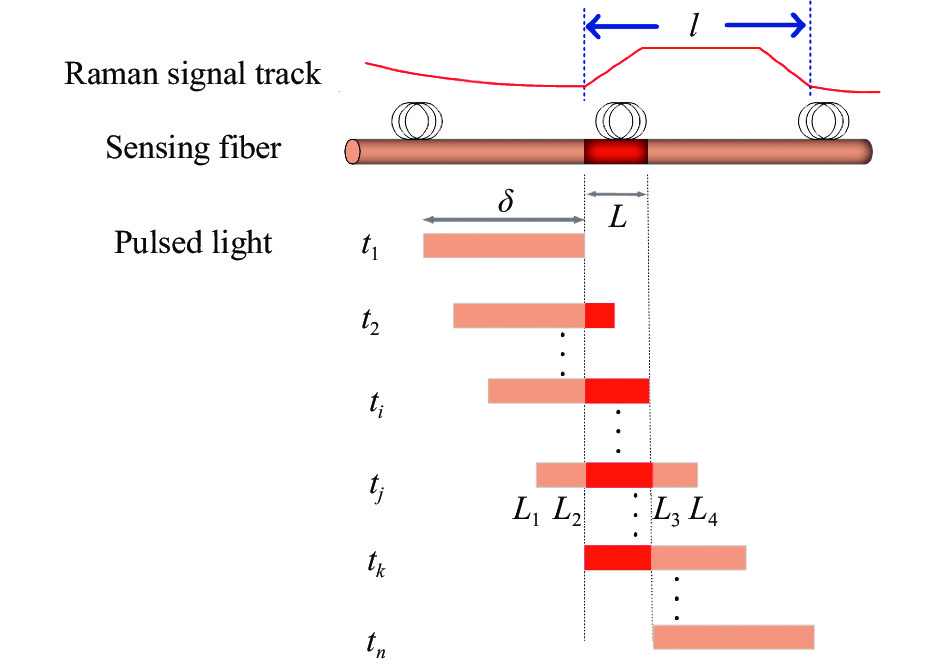
  Objective  Currently distributed fiber optic temperature sensor has become an important tool for oil and gas storage tank seal ring fires, high temperature furnace crack detection, and thermal pipeline leakage detection. Most detection methods are judged by the temperature threshold and temperature rise rate. And when the leak area is too small and the system spatial resolution is insufficient, the temperature and temperature rise rate will be much lower than the actual value. As one of the main factors of the spatial resolution of the distributed optical fiber temperature measurement system, the pulse width of the laser determines whether the sensor can detect the occurrence of accidents in time. Therefore, it is necessary to use a method to reduce the impact of laser pulse width on the spatial resolution of the system.  Methods  A Raman signal segmentation and reconstruction method is proposed. By analyzing the signal characteristics of the laser pulse in the optical fiber at the region to be measured, the relationship between the laser pulse width and the temperature deviation is obtained. According to this relationship, the original Raman signal at different temperature regions is segmented into known temperature segments and temperature segments to be measured, and the Raman signal intensity at the region to be measured is reconstructed from the signal of the temperature segment to be measured with the help of a fitted signal to eliminate the Raman signal offset at the known temperature segment.   Results and Discussions   The method was tested using a laser source with 20 ns pulse width (the theoretical spatial resolution is about 2 m) and 0.72 m test fiber. The results show that within the test temperature range of 40-90 ℃, the temperature error is reduced from a maximum of 33.9 ℃ to below 5.8 ℃, and the spatial resolution of the system was improved from 2.27 m to 1.13 m.  Conclusions  By analyzing the signal characteristics of the laser pulses passing through the high-temperature region, a Raman signal segmentation reconstruction method is proposed. By dividing the high temperature area covered by the laser pulse into the known temperature region and the temperature region to be measured, the signal offset of the known temperature segment is removed and the signal of the high temperature area is reconstructed according to the signal intensity of the temperature segment to be measured. A test is carried out using 20 ns laser pulses and 0.72 m test fiber. The results show that the temperature error is reduced from 33.9 ℃ to 5.8 ℃ at 90 ℃, and the spatial resolution of the system is improved from 2.27 m to 1.13 m. This method mainly solves the temperature measurement error when the length of the optical fiber in the area to be measured is less than the laser pulse width, and has outstanding advantages for small-scale leakage monitoring. The remaining temperature error mainly comes from insufficient APD bandwidth. This method can gradually shorten the measurable temperature region length and temperature accuracy with the increase of APD bandwidth.
Research status and trend analysis of beam deflection technology based on space laser communication
Li Fuhao, Zhao Jiguang, Du Xiaoping, Zhang Jianwei, Duan Yongsheng, Chen Pan
2023, 52(10): 20230004. doi: 10.3788/IRLA20230004
[Abstract](249) [FullText HTML] (63) [PDF 4789KB](99)
  Significance   Space laser communication has the advantages of large capacity, high bandwidth, strong confidentiality and great anti-electromagnetic interference ability. It is widely used in the field of space communication. Laser communication is one of the important ways to realize large capacity secure communication between space and earth, starry sky, interspace, air and sea, air and air links. It has become a research hotspot for realizing space communication links at present. The fast and stable space laser communication needs to be based on high performance ATP (Acquisition, Tracking and Pointing) technology. In order to achieve the purpose of optical signal acquisition, the working direction of the transmitter and receiver needs to be changed. However, due to orbit and energy constraints, space targets and spacecraft cannot change their attitude and position at will. The application of beam deflection technology can solve this problem well.  Progress   In the study, the research progress of 6 types of beam deflection technologies, mechanical and non-mechanical, is systematically summarized. According to the deflection characteristics of different technologies, the characteristics of each type of beam deflection technology are compared and analyzed from the aspect of key performance index. Table 1 is used to visually compare and analyze the key index that affect the deflection performance. In addition, the research progress of electro-optical deflection technology in recent years is analyzed. KTN (Potassium Tantalate Niobate) electro-optical crystal has good quadratic electro-optic effects and can achieve better deflection performance compared with other deflection technologies. By following up the progress of major research institutions at home and abroad, such as, NTT (Nippon Telegraph and Telephone) in Japan, University of Pennsylvania in the United States, Shandong Academy of Sciences, Harbin Institute of Technology, Nankai University, etc., sorted out their own research context of the main line, summed up and analyzed the problems to be solved. Then, the development trend and prospect are presented from the perspective of space application performance requirements.  Conclusions and Prospects   Comparing various beam deflection technologies, it is found that mechanical beam deflection technology has a large deflection Angle, but it is difficult to meet the high requirements of miniaturization and lightweight for space laser communication in spaceborne environment due to its complex structure, large volume, high energy consumption and easy wear. In the non-mechanical deflection technology, the acoustic and optical deflection technology has high deflection efficiency, but it has a strong dependence on the incident wavelength and angle of the beam. The liquid crystal deflection technology has low power consumption and large deflection angle, but the response speed is slow, and it is difficult to meet the task requirements of large-bandwidth transmission. The beam deflection device based on electro-optical crystal has the advantages of continuous deflection angle, fast response speed and high sensitivity. It is considered to be one of the leading directions for realizing high-speed optical deflection technology. Among all kinds of electro-optical materials, the electro-optical deflection device based on KTN crystals have many advantages, such as large angle deflection, fast response speed, high deflection efficiency and deflection accuracy, and wide bandwidth operation, etc., which have more potential applications in space laser communication and other fields. However, there are still some shortcomings: 1) The uniformity of the components in KTN crystal is a major factor affecting the deflection performance. At present, the preparation of KTN crystal with uniform components cannot be realized. 2) The regulation mechanism of beam deflection by polar nanoregions in KTN crystals near Curie temperature is not clear yet and needs further study. In the future work, on the one hand, the crystal growth method can be studied, and KTN crystals can be grown according to the growth law of other crystals. On the other hand, the microscopic deflection mechanism of KTN crystals should be gradually studied to find the internal causes affecting the beam deflection performance.
Photoelectric measurement
Research on spectral emissivity characteristics of blackbody coatings
Ding Jingwei, Hao Xiaopeng, Yu Kun, Song Jian, Zhou Jingjing
2023, 52(10): 20230033. doi: 10.3788/IRLA20230033
[Abstract](89) [FullText HTML] (14) [PDF 2154KB](49)
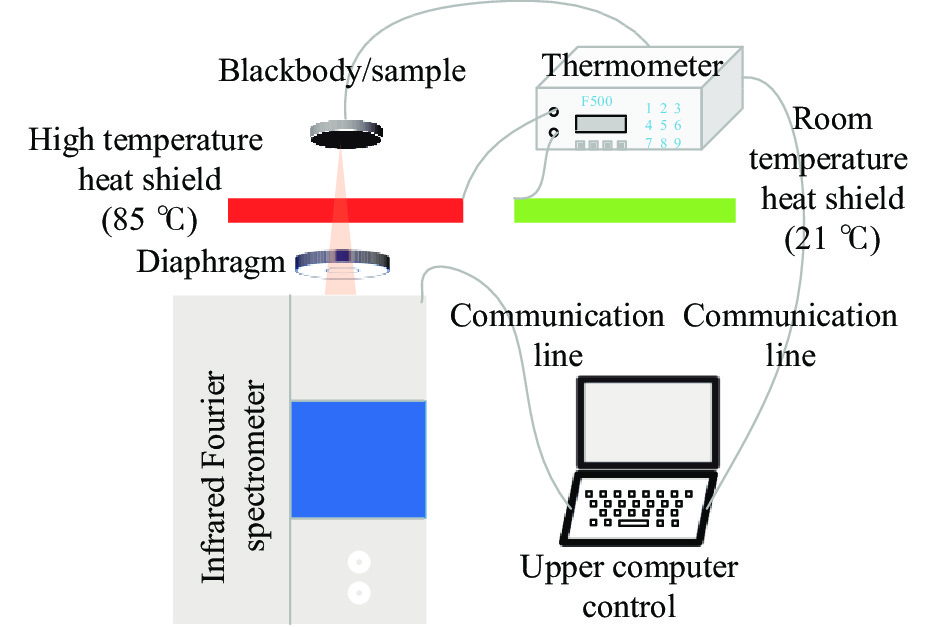
  Objective  Blackbody radiation source is a standard instrument used to calibrate radiation thermometer and infrared thermal imager, etc. Weather satellites are equipped with blackbody radiation source for real-time calibration in orbit. As one of the most important indicators of black body, infrared spectral emissivity is defined as the ratio of the radiation capacity of an object to that of an ideal blackbody at the same temperature and wavelength. The actual emissivity of the blackbody is closely related to the surface microstructure of the blackbody and the emissivity of the coating material, that is, the emissivity of the blackbody is affected by the radiation characteristics of the surface coating under a specific structure. Therefore, it is necessary to explore the infrared radiation characteristics of blackbody coating, which is of great significance to achieve high-precision infrared remote sensing calibration.   Methods  Based on the emissivity measuring device of controlling environmental radiation emission ratio method established by National Institute of Metrology, China (Fig.1), three kinds of high-emissivity blackbody coatings of different materials were prepared by manual spraying (Fig.3), and factors affecting the spectral emissivity of the coatings were explored, including the measuring environment, thickness and angle. The spectral emissivity of the blackbody coating before and after irradiation was compared by simulating the space radiation environment with ground equipment.   Results and Discussions   There are a lot of gases such as carbon dioxide and water vapor in the air, and the spectral emissivity of the three coatings all show a large jitter at 5-7 µm in the atmosphere, while the emissivity results are relatively smooth under vacuum (Fig.4). When the blackbody coating thickness is relatively thick, the emissivity decreases by 0.01 at most (Tab.1). The reason is that when the coating thickness is relatively thick, the pores will decrease, which is not conducive to the multiple reflection and absorption of electromagnetic wave (Fig.6). The emissivity of GR and Nextel 811-21 coatings is almost constant while that of Nextel 811-21+MWCNT coatings is slightly reduced when the measurement angle is in the 30° range. Space irradiation has little influence on the emissivity of the coating. The maximum emissivity variation of GR coating is 0.000 9, the maximum emissivity variation of Nextel 811-21 coating is 0.001 7, and the maximum emissivity variation of Nextel 811-21+MWCNT coating is 0.002 1 (Tab.4).   Conclusions  The emissivity of blackbody coating will change under the influence of measurement environment, measurement angle, coating thickness and space irradiation. The emissivity under vacuum coating is similar to that under atmosphere, but the measured results are better than those under atmosphere. When the measured angle changes within 30°, the spectral emissivity of GR and Nextel 811-21 coating is basically unchanged and still high, while the Nextel 811-21+MWCNT coating decreases with the increase of the measured angle. When the coating of GR and Nextel 811-21 is thick, the porosity of the coating will be reduced, resulting in lower emissivity, which is not conducive to high-precision infrared remote sensing calibration. The surface color of the coating changed from black to gray black after irradiation by ground simulation equipment, but the coating did not fall, crack and other phenomena did not occur, which proved that the coating has a certain spatial stability. At the maximum irradiation dose, the emissivity of GR coating decreases by 0.000 9, that of Nextel 811-21+MWCNT coating decreases by 0.002 1, and that of Nextel 811-21 coating increases by 0.001 7.
Analysis of coverage of the near space spaceborne wind interferometer
Wen Zhenqing, Feng Yutao, Fu Di, Zhu Jun, Wang Chao
2023, 52(10): 20230106. doi: 10.3788/IRLA20230106
[Abstract](67) [FullText HTML] (21) [PDF 3024KB](30)
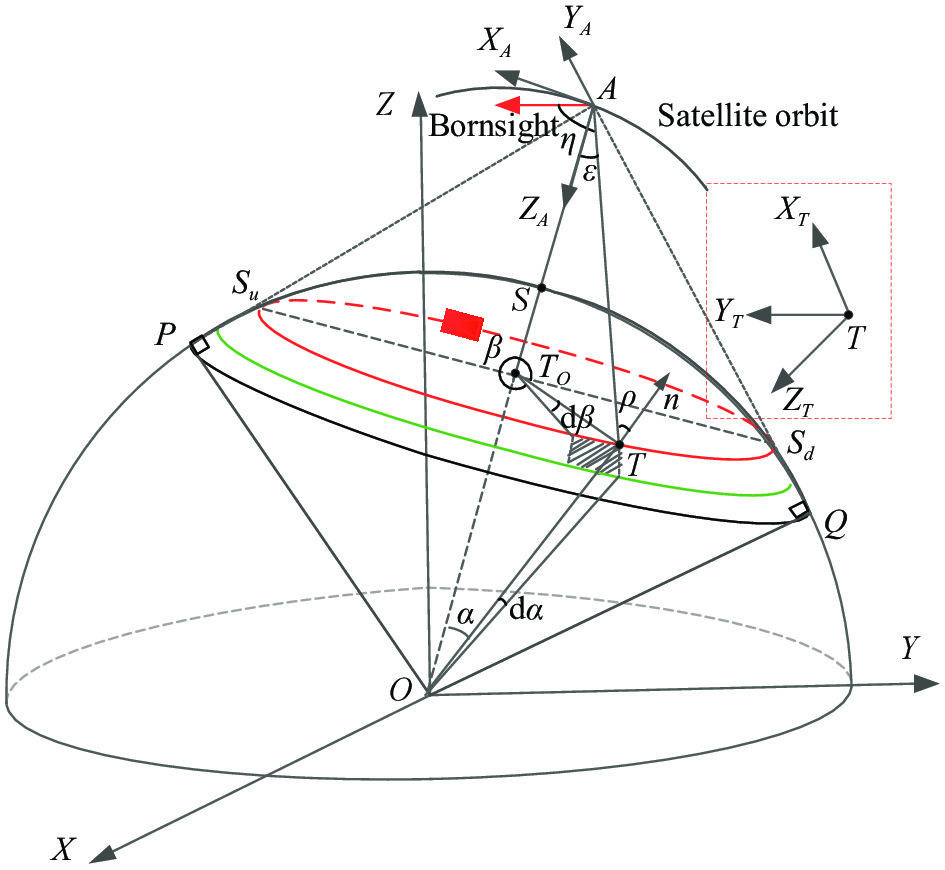
  Objective  Spaceborne wind interferometer uses the limb observation mode to measure the Doppler shift of atmospheric airglow lines to realize atmospheric wind field detection. The effective coverage of interferometer will be limited by the source and satellite mode. It is of great significance for the application of wind field data to analyze the observation data at the front end of satellite mission planning to determine whether it meets the scientific objectives.  Methods  According to the satellite orbit parameters and the instrument boresight parameters, the geometric model of limb observation is established (Fig.1), and the distribution of limb tangent points of instruments during satellite operation is simulated. Then, the main factors affecting the effective observation of the instrument are discussed, and the relationship between the solar incidence angle and the effective spatio-temporal coverage of the interferometer at different time periods is analyzed by taking the detection of dayglow as an example (Fig.5). Finally, the method of variable separation is applied to study the influence of satellite orbit parameters on the effective coverage of the wind interferometer, and the coverage percentage of the interferometer under different orbit parameters on the Eurasian is evaluated.  Results and Discussions  1) The main factors affecting the effective observation of the instrument are the zenith angle and the scattering angle of the sun. The solar incidence angle affects both the latitude coverage and the local time of the tangent point. (Fig.6-8). 2) The coverage efficiency of the instrument is affected by both orbital inclination and orbital altitude. Moreover, orbital inclination is the main orbital parameter affecting the coverage percentage of Eurasia continent. When the orbital inclination is between 60° and 80°, the coverage percentage can reach 100% (Fig.12).  Conclusions  This paper provides an observational geometric framework for the subsequent design and performance evaluation of the spaceborne interferometer, and realizes the quantitative analysis of the coverage efficiency of payload observation. The model has the ability to be widely used in the analysis of observation models of other types of atmospheric optical remote sensing payloads.
Long distance single photon precision time digital conversion circuit based on FPGA
Xie Da, Wang Chunyang, Yuan Kai, Wei Xuyang, Liu Xuelian
2023, 52(10): 20230094. doi: 10.3788/IRLA20230094
[Abstract](112) [FullText HTML] (25) [PDF 2409KB](50)
  Objective  Single photon ranging system is a system that uses the photon level detection sensitivity of GM-APD detector and obtains the distance information of far-field target based on the principle of photon time-of-flight ranging. The system has the advantages of long range and high ranging accuracy, and has great application potential in laser imaging, target detection and other fields. As the core module of single photon ranging system, the range and accuracy of time digital conversion circuit directly determine the working range and ranging accuracy of the ranging system. And in the field of spaceborne detection, the ranging system is required to have the ranging range of more than 100 km and centimeter-level ranging accuracy. At this time, the traditional time digital conversion circuit, limited by the counter number, in order to ensure the ranging accuracy, often lead to the limited system's measuring range, and if the system's range is increased, the system's ranging accuracy is difficult to meet the needs. In this paper, a time digital conversion circuit satisfying both wide range and high precision is designed to realize the wide range and high precision measurement of photon flight time interval. It provides technical support for single photon ranging in the field of spaceborne laser detection.   Methods  In order to solve the contradiction between wide range and high precision, a refined time digital conversion circuit design method for long-distance single photon ranging is proposed. Firstly, based on the piecewise counting principle, a coarse and fine two-stage counting architecture is designed to ensure the wide range measurement of TDC (Fig.5, Fig.10). Secondly, for the fine counting unit, the clock equal phase shift π/N is used to generate an equivalent high-frequency pulse clock (Fig.6), which improves the timing accuracy of the fine counting unit by N times. The timing accuracy of the fine counting unit was further improved to 2N times by using the multi-counter double-edge interval counting method (Fig.7).   Results and Discussions   Vivado software was used to verify the accuracy and range of the proposed algorithm, and the simulation results of the accuracy (Fig.11) and range (Fig.12) were given. In order to further verify the performance of GM-APD laser ranging system designed in this paper based on equivalent pulse two-stage time digital conversion circuit, the indoor and outdoor ranging experiments were carried out respectively, and the indoor ranging results (Tab.1) and outdoor ranging results (Fig.16-17, Tab.3) were given. The experimental results show that the coarse and fine two-stage counting system can effectively reduce the limit of TDC timing accuracy to its range. The timing resolution of TDC is 416.67 ps, and the ranging range is 196.608 km, which solves the contradiction between wide range and high precision.   Conclusions  A fine time digital conversion circuit for distance single photon ranging is designed, and a TDC module with high precision, high stability and easy to expand is implemented on FPGA. By using the TDC design method of coarse and fine two-stage counting, the clock signal of the same frequency phase shift and equal phase difference, and the two-side edge precision time counting, the wide range and high precision measurement of photon flight time are realized. The structure of the proposed refined time digital converter circuit is relatively simple and flexible. The number of counter bits is 16 and the number of clocks with equal phase shift in the same frequency is 6. The range and timing accuracy of TDC conversion can be further improved by increasing the number of counter bits and the number of clocks with phase shift.
Space optics
Method for retrieving thermal deformation of scanning mirror of remote sensing camera via the neural network algorithm
Li Zhengda, Sun Shengli, Sun Xiaojin, Chen Yifan, Han Yixiao, Ma Xiaohao, Shen Xiaotian
2023, 52(10): 20230065. doi: 10.3788/IRLA20230065
[Abstract](89) [FullText HTML] (25) [PDF 4954KB](32)
  Objective  Wide-range and high-resolution imaging is one of the important development directions of remote sensing cameras. In order to achieve wide-range and high-resolution imaging, the most common method is to scan a large field of view through a scanning mirror. As an important component of remote sensing cameras to achieve large field of view imaging, scanning mirrors are usually located at the forefront of the entire imaging system, and expand the imaging field of view by changing the incident optical angle. It is easily to expose the scanning mirror to the direct influence of external heat flow, such as sunlight and Earth's reflected light, which may lead to change in the temperature of the scanning mirror, and the thermal stress can lead to change in the surface figure of the scanning mirror, thereby affecting the imaging quality of the camera and limiting the available time of the camera in orbit. Therefore, when more resources cannot be provided to ensure the temperature stability of the scanning mirror, the best way to achieve high-quality imaging is to compensate for surface change caused by thermal deformation. How to accurately test the surface change of the scanning mirror in orbit becomes a key step in whether to compensate for thermal deformation surface change.  Methods  The proposed method is based on an algorithm that combines the interferometer data and the temperature of the mirror to establish a relationship model between the temperature of the mirror and the deformation of the mirror surface. In this paper, a neural network algorithm is adopted, which puts the temperature measurement values of the mirror as the input and the surface figure change of the mirror as the output (Fig.4). The function of inverting the surface mirror change of the mirror through the temperature values of the mirror can be realized. The input temperature values are provided by eight temperature measuring points on the back of the mirror (Fig.7). The surface figure of the mirror is expressed using a Zernike expression, including Power, Astigmatism, Coma, Trefoil, and Spherical aberration (Tab.5).   Results and Discussions   The method can achieve better performance than RMS 12.6 nm (Fig.8), which is a good performance. The core of the algorithm is how to establish the relationship between the temperature of the mirror and the surface figure change. Therefore, this paper proposes to use the neural network algorithm to reverse the surface figure change of the mirror based on the temperature measurement points on the back of the mirror, providing a basis for the use of deformable mirror in the rear optical path for correction. This method eliminates the need for additional wavefront testing systems, which can reduce the implementation difficulty of optical systems, as well as additional load burdens such as weight and power consumption. And The method is also more conducive to in-orbit applications.  Conclusions  The scanning mirror of a remote sensing camera has a significant impact on the imaging quality under the influence of external heat flow. In order to achieve more efficient imaging compensation in orbit, this paper proposes a method of using neural network algorithms to invert the surface figure change of the scanning mirror through the temperature measurement points of the scanning mirror itself. The method can accurately reflect the surface figure change of the scanning mirror caused by external heat flow, thereby providing accurate surface figure change for the compensation of the optical path after implementation. Through analysis, The residual errors between the retrieved surface figure and the theoretical surface figure is less than 12.6 nm, providing a new solution for remote sensing cameras to achieve better surface figure test method in orbit and to compensate for the impact of external heat flow.
Modeling and analysis of earth stray radiation of earthlimb/deep space background detection system
Wang Hao, Ma Wenpo, Zhang Qian, Jin Libing, Wang Siheng, Chen Ming
2023, 52(10): 20230041. doi: 10.3788/IRLA20230041
[Abstract](119) [FullText HTML] (27) [PDF 3246KB](46)
  Objective  Target detection with earthlimb and deep space background is an important imaging method for spaceborne optical remote sensors, which can effectively reduce the impact of earth stray radiation. It is widely used in weak target detection, such as mid-course warning of ballistic missile, space target monitoring, and astronomical detection. Usually, the earth is controlled outside the field of view of sensors, but the earth stray light will still reach the focal plane through the non-imaging optical path, which will affect the detection of targets. The earth radiation received by a remote sensor includes earth surface energy through the atmosphere, atmospheric spontaneous radiation energy and atmospheric backscattering energy of solar radiation. The earth radiation is related to the types of ground objects, atmospheric conditions, observational geometry, and the geometry of the sun. Due to its complexity, the stray light analysis software has not been able to accurately analyze the influence of earth stray light. In order to evaluate the influence of the earth stray radiation and guide the stray light suppression design of remote sensors, the earth stray radiation is modeled and analyzed.  Methods  Based on the radiation theory, the radiation model of earth spherical crown is established, and the spherical cap region that contributes to its optical payload stray light at any satellite position is given. The total stray radiation of earth is solved using the method of region meshing and small facet integration (Fig.1). The radiation energy of a small facet includes surface energy passing through the atmosphere, atmospheric spontaneous radiation energy, and atmospheric backscattered energy of solar radiation. For accurate characterization, a latitude longitude model and a solar vector model of small facets are established based on satellite parameters to calculate their solar irradiation geometry (Fig.3-4). Combined with the satellite observation geometry, surface parameters and atmospheric parameters, etc., the radiance is obtained using the atmospheric radiation transfer model.   Results and Discussions   Taking the visible and long wave infrared band of a spaceborne remote sensor as an example, the comparative analysis of the earth stray radiation is carried out in terms of the nadir location, time and sensor boresight direction (Fig.8-9).The earth stray radiation changes periodically with time. The fluctuation in the visible light band is nearly 10 times at different times and in the long wave infrared band can be ignored. The earth stray radiation is sensitive to the change of boresight elevation angle. There are seven orders of magnitude fluctuations in the visible light band and two orders of magnitude fluctuations in the long wave infrared band when the elevation angle changes 25°. The boresight azimuth angle has an influence on the earth stray radiation in the visible light band and can be ignored in the long wave infrared band. It has nearly five times of fluctuations varying with different azimuth angles. The geographical latitude has an influence on the earth stray radiation in the visible light band and can be ignored in the long wave infrared band. The lower the latitude is, the greater the influence of stray radiation is.  Conclusions  In order to solve the problem that the earth stray radiation can not be accurately simulated for the spaceborne optical remote sensor used for earthlimb and deep space background target detection, the mathematical model of earth spherical crown stray radiation is established. The visible and long wave infrared band of a spaceborne remote sensor is taken as an example to simulate the earth stray radiation from various dimensions such as the position of the satellite nadir, time and the direction of the payload's line of sight. The research results can be widely used in stray light suppression design of spaceborne remote sensors with earthlimb and deep space background.
Optical design
Optical system design of common-aperture multimode remote sensing camera
Peng Liwei, Zhang Minglei, Chen Yu, Jiang Lusong, Dong Dapeng
2023, 52(10): 20230066. doi: 10.3788/IRLA20230066
[Abstract](92) [FullText HTML] (39) [PDF 3159KB](52)
  Objective  Scenery changes on the earth are utilized for space remote sensing cameras to perform imaging during flying around the earth. The larger field of view a space remote sensing camera has, the larger observation area on the earth the system will obtain. However, high-resolution imaging is usually achieved by using an optical system with large aperture, which will lead to more aberration. This will further limit the field of view of the system. At present, the remote sensing cameras equipped in most satellites cannot have both large-field-of-view detection and high-resolution recognition. Aiming at this problem, a compact space remote sensing camera with large-field-of-view search and multi-band high-resolution imaging is designed in this paper.   Methods  The integrated optical system with functions of large-field-of-view search and high-resolution imaging is shown (Fig.10). A primary mirror with large aperture is shared by the large-field-of-view search module and the high-resolution imaging module, to reduce the weight and overall size volume of the system. Cassegreen structure is adopted in the high-resolution imaging module, involving a visible-light imaging module and a mid-wave infrared imaging module, which are splitted by the secondary mirror. An off-axis four-mirror structure is adopted in the large-field-of-view search module. Two freeform mirrors with the Biconic-Zernike shape are used to correct the aberrations.   Results and Discussions   In this paper, an optical system for a compact space remote sensing camera with both large-field-of-view search and high-resolution imaging is proposed. The overall weight of the optical system is about 140 kg, and the overall volume is 0.8 m×0.8 m×1.1 m. The focal length of the large-field-of-view search module is 945 mm with field of view in the sagittal direction of 10°. The diameter of the entrance pupil is 130 mm and the working waveband is 0.45-0.9 μm. The optical structure is shown (Fig.1). The resolution of 4 096×4 096 for the detector is adopted with pixel size of 15 μm×15 μm. When the orbit height is 500 km, the system can search the ground with line width of 33 km and ground resolution of 8 m. The high-resolution imaging module is composed of a visible light imaging module and a mid-wave infrared (MWIR) imaging module. The focal length of the visible-light imaging module is 4 200 mm. The resolution of 6 252×4 176 for the detector is adopted with pixel size of 3.76 μm×3.76 μm. The MWIR imaging module has a focal length of 4 000 mm, a detector resolution of 384×288 and a pixel size of 25 μm×25 μm. A large-aperture primary mirror is shared by a visible-light module and a MWIR imaging module, with the same diameter of 800 mm. When the orbital height is 500 km, the visible-light and MWIR imaging modules can image the area of 2.813 km×1.879 km and 1.228 km×0.922 km respectively, within the full field of view of 0.4°. The ground resolution for the visible-light imaging module and MWIR imaging module are better than 0.45 m and 3.2 m respectively. The tolerance values are given according to the processing requirements. The tolerance analysis of the system is then carried out, in which the random-statistical method is used in the search module to perform surface-tolerance analysis on freeform surfaces. The analysis results show the MTF values of the visible-light imaging module, MWIR imaging module and search module within full FOV are all greater than 0.2 at Nyquist frequency (133 lp/mm, 20 lp/mm and 33 lp/mm). The optical system can meet the requirements of actual processing and assembly.   Conclusions  With the rapid development of space remote sensing technology, space remote sensing cameras need to obtain larger field of view and higher resolution. In this paper, an optical system in remote sensing camera is proposed, involving a high-resolution imaging module and a large-field-of-view search module, which has the functions of both large-field-of-view search and multi-band high-resolution imaging. The system has a compact structure, which is beneficial to realize miniaturization and lightweight of the system. The optical system has certain reference value for the design of multi-mode satellite optical payload.
Research on the method of co-focus detection for sparse aperture telescope based on curvature sensing
An Qichang, Wu Xiaoxia, Li Hongwen
2023, 52(10): 20230050. doi: 10.3788/IRLA20230050
[Abstract](78) [FullText HTML] (29) [PDF 8375KB](35)
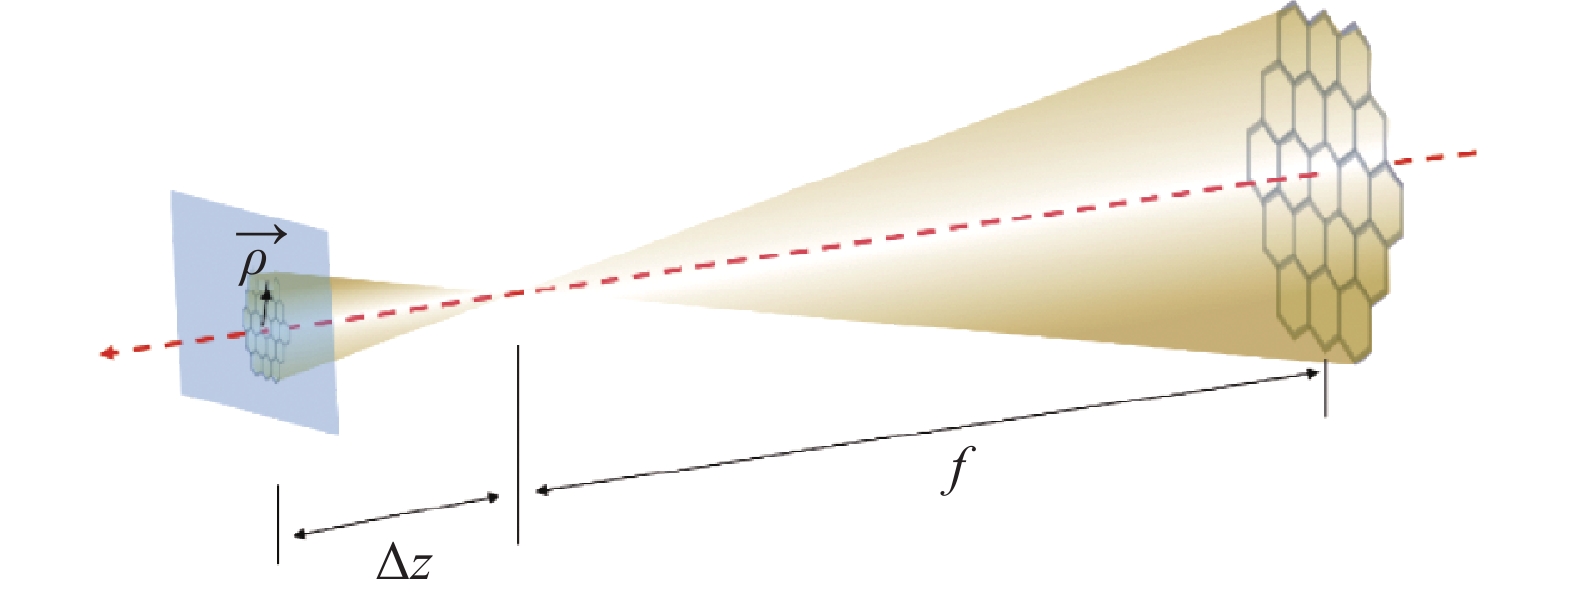
  Objective  For larger light collection area and detection sensitivity, the aperture of future telescopes is becoming larger and larger. The large sparse aperture telescope is one of the important tools for the future astronomy. Currently, the largest sparse aperture telescope is the Large Magellan Telescope (24 meters). For large sparse aperture telescopes, it is necessary to focus the direction of multiple sub mirrors on a single point, namely, co-focus. Co-focus (optical axis alignment) for sparse aperture is the foundation for achieving the established scientific goals of telescopes, and it is also the key to achieving functional synthesis of multi-channel systems. The dynamic range of wavefront sensing required for relatively large co-focus detection. For Hartmann sensors, a large sub aperture can be used to enhance the dynamic range, but it can lead to the addition of other aberration components in the sub aperture, deviating from the Gaussian assumption. For application scenarios such as fine astronomical observation, there will be huge limitations. At the same time, an excessive dynamic range can exacerbate the nonlinearity of the solution, leading to control degradation of the wavefront correction system.  Methods  The co-focus measurement of large sparse aperture telescopes is mainly divided into two methods of using the focal plane and the pupil plane. Here, we first obtain two defocused star point images before and after focusing, and calculate the wavefront based on the wavefront curvature sensing method through the defocused star donut image. Afterwards, a mask is used to suppress the edge noise of the star image, which involves physical constraining. Then, co-focus perception and regulation can be achieved through plane fitting. The co-focus detection method for sparse aperture telescopes based on curvature sensing is shown (Fig.2), which overcomes the disadvantage of traditional methods where light points overlap and are lost, requiring recalibration.  Results and Discussions   By using segmented deformable mirrors to generate higher-order wavefront aberrations, the ability of curvature sensing to perceive boundary anomalies can be verified through testing the wavefront tilt. The verification platform for wavefront tilt calculation using deformable mirrors is shown (Fig.6). By utilizing the tilt component obtained from wavefront sensing, combined with the mapping relationship between aberration space and mirror space, the driving force of hard points can be obtained through inverse solution. In this analysis, it is assumed that the system has a total of 7 primary mirrors, each with tilt errors. By utilizing the difference in light intensity before and after focus plan, wavefront sensing is achieved, and closed-loop correction is achieved based on this. According to Fig.3 and Fig.4, the total adjustment range is greater than 20 wavelengths.  Conclusions  By utilizing the non-interference, wide range, and band robustness characteristics of curvature sensing, co-focus measurement of large sparse aperture telescopes is achieved. This method can achieve parallel perception and control of multiple mirror tilts without performing focus recognition. In this analysis, it is assumed that the system has a total of 7 primary mirrors, and each sub mirror has tilt errors, utilizing the difference in light intensity before and after focusing. Finally, the correlation between the wavefront tilt detection results is higher than 0.83, and the measurement accuracy is better than 0.2λλ=633 nm). By utilizing curvature sensing, the drawbacks of multiple moving calibrations and individual adjustments can be overcome. High throughput co-focus error perception and rapid regulation are realized. The method in this paper lays a technical foundation for the construction of future large aperture sparse aperture telescopes.
Lasers & Laser optics
Optical imaging
Full-color single-pixel endoscopic imaging system
Yang Xu, Ran Yue, Zhou Wei, Xu Baoteng, Liu Jialin, Yang Xibin
2023, 52(10): 20230077. doi: 10.3788/IRLA20230077
[Abstract](176) [FullText HTML] (45) [PDF 2356KB](58)
  Objective  Single-pixel imaging (SPI) technology has excellent application prospects in biomedical imaging because of its weak light detection ability and wide working band. In recent years, some research works on full-color SPI imaging methods have been reported one after another. The current technical route of full-color SPI is roughly divided into two directions: one is to use RGB trichromatic light sources for illumination, to capture the light intensity after modulation of different color light through a single-pixel detector respectively, and finally to synthesize full-color images through reconstructed RGB three-channel images. The other is to use a white light source for illumination and capture the color and spatial information of the target scene through a beam-splitting prism and multiple single-pixel detectors. With the rapid development of single-pixel imaging technology, some researchers have applied full-color single-pixel imaging technology to biomedical imaging systems. However, most of them only apply full-color single-pixel imaging to wide-field imaging systems without taking full advantage of the low light detection ability and a broad spectrum of single-pixel imaging technology. Moreover, most of the optical imaging systems built in the laboratory are only validation prototypes, and further modularization and miniaturization of them have yet to be developed. Therefore, it is necessary to combine full-color single-pixel imaging technology and endoscopic imaging technology to design and build a modular and miniaturized full-color single-pixel endoscopic imaging system. To this end, two full-color SPI endoscopic imaging systems were designed and built by combining the two main technical routes of full-color SPI with endoscopic imaging technology. The advantages and disadvantages of the two full-color SPI endoscopic imaging schemes were systematically analyzed. Moreover, the modular and miniaturized design and modification according to the proposed imaging scheme make it possible to match various laparoscopes for endoscopic imaging.  Methods  Two modular full-color single-pixel imaging systems were designed and built based on Hadamard single-pixel imaging technology. The system's optical paths and modular schematics are shown in Fig.2 and Fig.4. The experimental setup used the group's self-developed four-band LED light source box as the light source, a digital micromirror device (DMD) as the spatial light modulator, and silicon-based photodetectors as the single-pixel detectors. The two full-color single-pixel imaging systems were used to perform endoscopic imaging experiments on the color bars. The reconstructed images of the color bars of the two imaging schemes were compared and analyzed using PSNR and SSIM as evaluation criteria (Tab.1). The imaging times of the color bar endoscopic imaging experiments of the two imaging schemes were also analyzed for comparison (Tab.2). Further endoscopic imaging experiments were performed on human intestinal models using a modular full-color single-pixel system.  Results and Discussions   The PSNR of the RGB trichromatic light scheme was 18.5717 dB, SSIM was 0.6431, and total imaging time was 6.5506 s. The PSNR of the white light scheme was 18.4988 dB, SSIM was 0.6860, and total imaging time was 3.8726 s. The difference between the PSNR of the white light scheme and the RGB trichromatic scheme is only 0.0729 dB. However, the SSIM of the white light scheme is 0.0429 higher than that of the RGB trichromatic scheme. The measurement time of the white light scheme is shorter than that of the RGB trichromatic scheme by one-third, and the reconstruction time is shorter by 0.012 s. Therefore, the total imaging time of the white light scheme is 2.678 s faster than that of the RGB trichromatic scheme. From the experimental results, the white light scheme is more suitable for the endoscopic imaging system. The human intestinal model was imaged using the white light scheme, and the results are shown in Fig.7. Complex targets can also be imaged, which can meet the needs of endoscopic imaging.  Conclusions  Two full-color single-pixel endoscopic imaging systems were designed and built. A quantitative comparison of the two proposed imaging schemes was made to analyze their advantages and disadvantages. By calculating the imaging quality and time, the white imaging scheme is more suitable for the full-color endoscopic imaging system than the RGB tri-color scheme. Meanwhile, the two imaging systems are miniaturized and modularized to be adapted to various types of laparoscopes for endoscopic imaging.
Image processing
A review of image processing methods in target atmospheric disturbance detection
Ren Weihe, Li Kang, Zhang Yue, Zheng Guoxian, Su Yun, Zhang Xuemin, Liu Yi
2023, 52(10): 20230044. doi: 10.3788/IRLA20230044
[Abstract](130) [FullText HTML] (76) [PDF 1932KB](71)
  Significance   The demand of target information acquisition and application is becoming more and more urgent all over the world, and all countries are focusing on the research of new target information acquisition technology, especially for all kinds of targets, especially for air targets. In today's information society, the new information acquisition technology is of great significance, which can promote social development and improve people's living standards, and also play a significant role in improving the national defense system and ensuring national security. Therefore, it is necessary to study the new target information acquisition technology. Target detection technology based on atmospheric disturbance is a new information acquisition technology system. The use of atmospheric disturbance in target detection is not affected by the performance of the target itself, and has great application potential.  Progress  In this paper, four main image processing algorithms of target atmospheric disturbance detection are introduced, which are cross-correlation method, optical flow method, frame difference method and background detection method. The technical principle is described and the technical advantages and disadvantages are analyzed (Tab.4). The cross-correlation algorithm has good real-time performance, but will reduce the resolution; The optical flow method has high precision but poor real-time performance. Inter-frame difference method has good real-time performance, but poor accuracy and applicability. Background detection method has good accuracy and poor applicability. According to the development status of the four algorithms at home and abroad, through comprehensive research, the optimization methods of various algorithms are analyzed and summarized, which can be divided into three categories (Tab.2) of optimization algorithm itself, integration with other image processing algorithms, and neural network based. Through the analysis of relevant literature, the advantages and disadvantages of the three algorithm optimization methods are revealed (Tab.3). The optimization algorithm itself has low complexity and can achieve high real-time performance, but limited by the basic principles of the algorithm, the optimization effect is not obvious; The method of fusion with other image processing algorithms can make up for the technical limitations of the algorithm, achieve high performance and high robustness, but the complexity of the algorithm increases, and the real-time performance is affected. The optimization method based on neural network can greatly improve the algorithm performance and achieve high adaptability, but it requires a lot of prior information and has poor real-time performance. Based on this, the four methods and the future development direction of target atmospheric disturbance image processing are prospected and summarized.  Conclusions and Prospects  Based on the analysis and summary of the research progress of target atmospheric disturbance image processing methods at home and abroad, the optimization method of image processing algorithm in target atmospheric disturbance detection is given as follows. At present, it is necessary to develop the technical direction of optimizing the image processing methods of atmospheric disturbance target detection by using other algorithms, such as inter-frame difference method combined with optical flow method, and overall optimization of multiple target atmospheric disturbance algorithms by using machine learning technology. Facing the future, the image processing method of atmospheric disturbance target detection based on small sample unsupervised learning has great application prospect.
Comparison and analysis of high precision DEM production and quality in typical glacier regions of domestic stereometric mapping satellites
Zhu Siao, Li Guoyuan, Guo Jinquan, Zhang Kun, Zhang Shuaitai, Pei Liang
2023, 52(10): 20230231. doi: 10.3788/IRLA20230231
[Abstract](97) [FullText HTML] (44) [PDF 12657KB](50)
  Objective  The glaciers on the Qinghai-Tibet Plateau are an important freshwater reserve resource in China. In the context of global warming, glaciers on the Qinghai-Tibet Plateau are generally in retreat, affecting China’s water resources reserves. Therefore, it is necessary to monitor changes in glaciers on the Qinghai-Tibet Plateau. The existing DEM (Digital elevation model) for complex terrain applications in the Qinghai-Tibet Plateau region have insufficient descriptions of glacier details or data gaps, which cannot reflect glacier characteristics well and are not suitable for monitoring elevation changes in mountain glaciers and small ice caps. This article is based on the autonomous and controllable production of high-precision and finer grid DEMs in the glacier area of the Qinghai-Tibet Plateau using domestic stereo mapping satellites.   Methods  When producing DEM using satellite remote sensing stereo images, field control points are often required. However, the research area is located in high mountain glacier areas, making it difficult for personnel to reach and collect control points. The GF-7 satellite laser altimetry data product has the characteristic of high elevation accuracy and can be used as elevation control points in complex terrain areas. The specific methods are as follows: Firstly, conduct preliminary screening of GF-7 laser points and select laser points in bare areas; Secondly, the matching algorithm based on phase correlation is used to determine the homonymous points of GF-7 laser points on the stereo image, establishing the connection between the laser points and the stereo image; Thirdly, establish the Affine transformation model between the laser point and the stereo image to realize the image square compensation of the stereo image, update the RPC (Rational Polynomial Coefficients, RPC) information of the stereo image, optimize the orientation parameters of the stereo image, and improve its stereo mapping accuracy; Finally, high-precision DEM is extracted through dense image matching to complete high-precision DEM extraction based on stereo images.   Results and Discussions   In the research area, comparing the elevation accuracy of domestic three-dimensional surveying satellite DEM with medium spatial resolution DEM, as shown in Tables 4 and 5, it was found through ATL08 laser point verification that GF-7 DEM has the highest elevation accuracy, followed by ZY-3 DEM, AW3D, SRTM, and TanDEM has the worst accuracy, with a maximum error of over 20 m. Verify its accuracy with high spatial resolution HMA (High Mountain Asia, HMA) DEM data. From the validation results in Tab. 6, it can be seen that the elevation accuracy of GF-7 DEM is superior to HMA DEM, and the accuracy of HMA DEM is higher than ZY-3 DEM. The main reason is the limitation of basic data source resolution. HMA originates from sub meter resolution images, so it has more advantages in accuracy compared to ZY-3 DEM. From the perspective of DEM coverage, GF-7 DEM and ZY-3 DEM have comprehensive coverage, while HMA data has many data holes and poor quality, especially in glacier regions with less data coverage. In terms of detailed description of the glacier end, due to the finer grids of GF-7 DEM, ZY-3 DEM, and HMA, they have more advantages compared to other large grids, and the detailed texture features are clearer.   Conclusions  Select laser data with similar collection times in the glacier area to verify the accuracy of GF-7 DEM and ZY-3 DEM. The accuracy of GF-7 DEM is better than 1.5 m when the slope is less than 6°, and the accuracy of ZY-3 DEM is better than 3.5 m when the slope is less than 6°. Both have high accuracy and can be applied to monitoring elevation changes in glacier areas. Domestic stereo mapping satellites have the advantage of being autonomous and controllable, providing stable data for glacier scientific research in the Qinghai-Tibet Plateau region. Over time, they can also form long-term time series data, better serving the monitoring of glacier changes in the Qinghai-Tibet Plateau.
Research on LSTM method of high dynamic dim and small targets detection for space-based infrared early warning
Zhai Guang, Hu Shengran, Sun Yiyong
2023, 52(10): 20230010. doi: 10.3788/IRLA20230010
[Abstract](124) [FullText HTML] (24) [PDF 2626KB](67)
  Objective  Infrared target detection technology has the advantages of large observation range, short scanning period and strong anti-interference ability, which is of great significance in space-based early warning missions. The infrared targets in space-based early warning missions have the characteristics of small size and weak signal, and it is difficult to use their texture and shape features for detection. In scenes with strong noise and clutter interference, it is necessary to use target motion features for detection. The traditional target detection algorithm generally assumes that targets move with constant velocity, which is not capable of detecting high dynamic nonlinear moving targets with unknown motion rules, and effective detection algorithms for nonlinear moving targets still need further development. To solve the problem of high dynamic and nonlinear moving target detection in space-based early warning missions, an infrared dim and small target detection algorithm based on LSTM is proposed.   Methods  Firstly, an adaptive preprocessing block is proposed, which can extract the location information of suspicious targets and solves the problem of mismatch between LSTM network structure and sequence images. At the same time, some spatial characteristics of target signals are discarded in order to reduce the amount of computation. Then, due to the problem that traditional algorithms are unable to detect nonlinear motion trajectory, a target trajectory detection method based on LSTM is designed to realize the detection of high dynamic nonlinear moving targets in sequence images. Finally, a post-processing algorithm, which selects target points from the pre-processing results based on the LSTM estimation results is designed to improve the target positioning accuracy.   Results and Discussions   Aiming at the targets with different motion laws, two experiments are designed and carried out based on the image sequence with an average signal-to-noise ratio of 4.07. In the first experiment, the target performs simple nonlinear motion with a sinusoidal law. This experiment proves that the proposed algorithm can correctly estimate the existence and position coordinates of the target with a precision rate of 0.934 7 and a recall rate of 0.885 1 (Fig.6-7). In the second experiment, the target performs complex nonlinear motion described by the superposition of multiple sine functions, the proposed algorithm achieves a precision rate of 0.936 2 and a recall rate of 0.863 3 at a detection speed of 0.008 326 s/frame and a peak memory usage of 1 214.13 MiB (Tab.2). Compared with four algorithms including Sequential Hypothesis Testing, the proposed algorithm is proved to have better performance in terms of precision rate, recall rate and detection speed. Through some additional experiments, it is proved that the algorithm is applicable to the detection task in the scenes where the average speed of target is between 1-6 pixels/frame and the average SCR and SNR of sequence images are both higher than 2.   Conclusions  Experiments results demonstrate that the proposed algorithm has the ability to detect dim and small targets with high dynamic nonlinear motion from noise and clutter. The proposed algorithm makes use of the spatial and temporal features of the target in the sequence images, and is able to detect targets in low signal-to-noise ratio scenes. And at the same time, with the help of LSTM's ability to extract temporal features, the proposed algorithm is capable in the task of nonlinear moving targets detection. In addition, as the lightweight structure of the LSTM is maintained, the proposed algorithm shows high real-time performance.
Infrared ship target detection algorithm based on YOLOv5
Liu Fen, Sun Jie, Zhang Shuai, Sang Hongqiang, Sun Xiujun
2023, 52(10): 20230006. doi: 10.3788/IRLA20230006
[Abstract](198) [FullText HTML] (57) [PDF 3896KB](84)
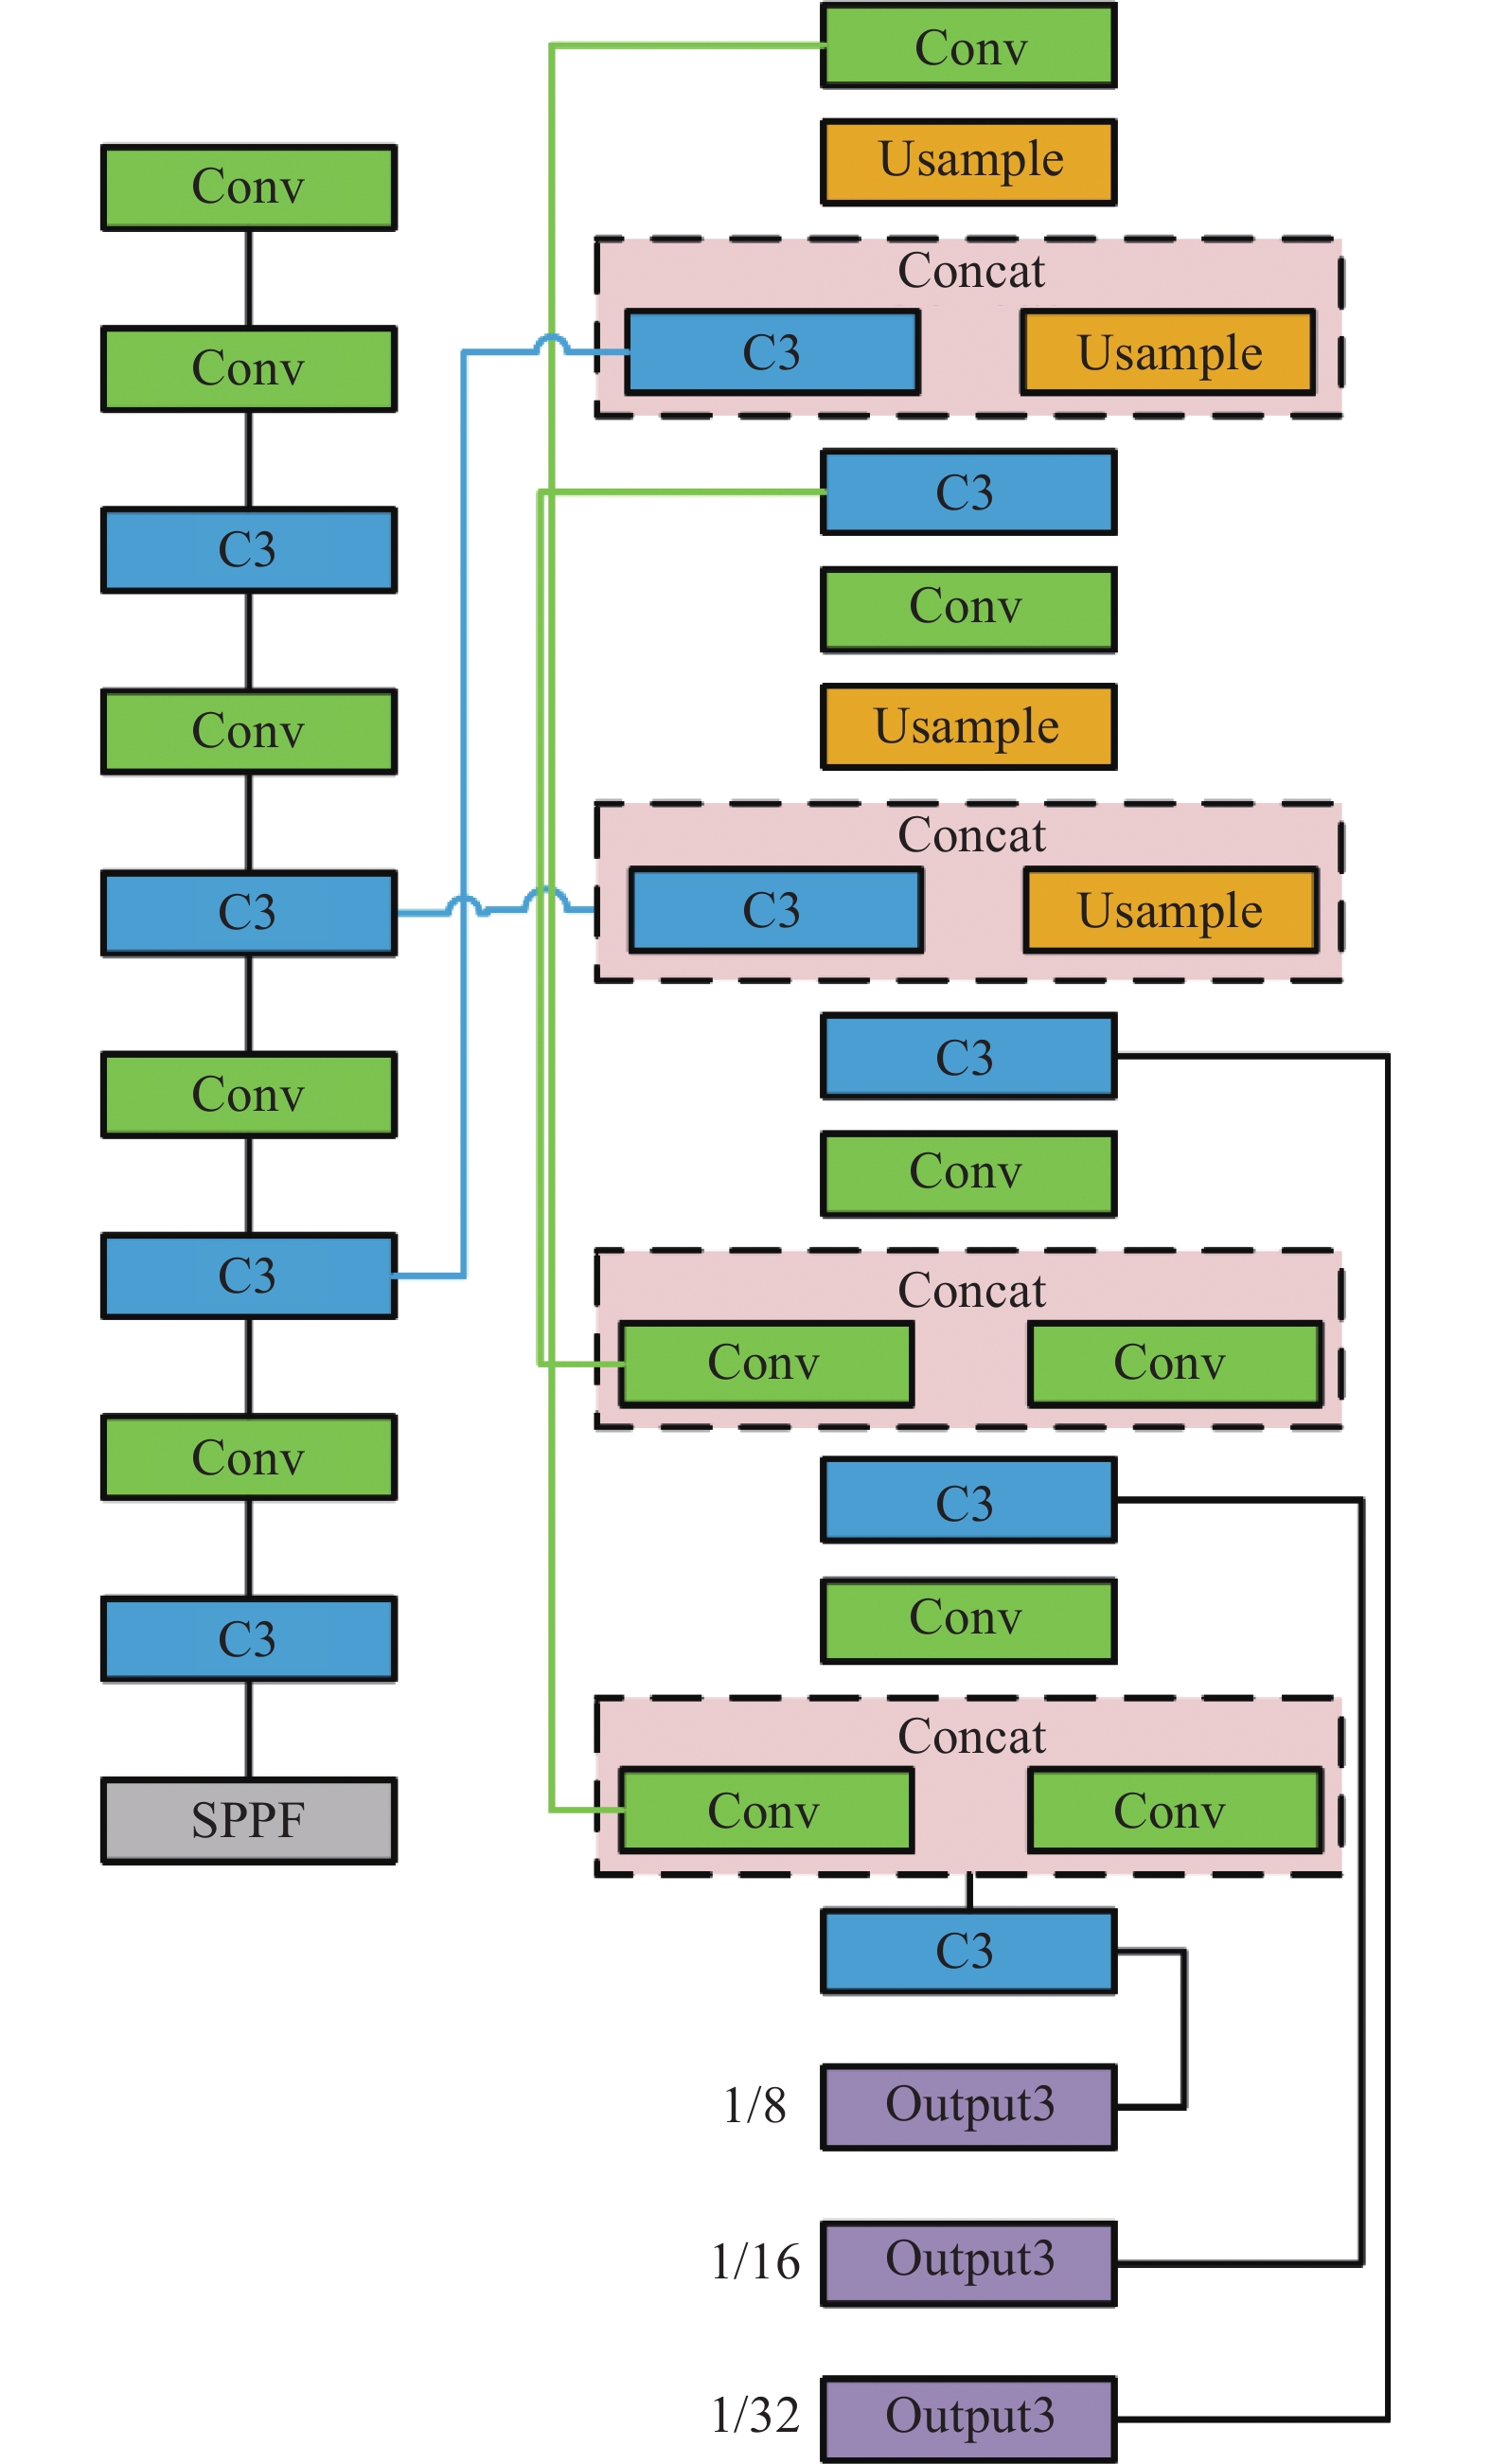
  Objective  Infrared image has the advantages of long detection distance and wide selectable working time, and plays an important role in infrared target detection in the field of ship image detection. Due to the existence of a large amount of interference information, ship target detection in a complex sea and sky background is facing enormous challenges. The target detection algorithm based on deep learning has strong ability to extract features, strong adaptability of the model to the environment, and good detection effect and stability. YOLOv5 algorithm is a widely used target detection algorithm based on deep learning, but there are still shortcomings in the process of infrared ship target detection. To solve the gradient explosion problem of YOLOv5 algorithm in marine infrared ship target detection, the border regression loss function based on CIoU is improved, the regression process is optimized, the convergence effect of the model is improved, and the gradient explosion problem is solved in this paper. To address the problem of inconsistency between the size of the target dataset and the anchor frame, the K-means algorithm is improved to obtain an anchor frame suitable for the infrared ship dataset used in this algorithm, which improves the algorithm's detection ability for infrared ship targets.  Methods  The K-means clustering algorithm is improved, median is used instead of the average as the selection criteria for the clustering center to reduce the impact of discrete points on the clustering results. By improving the penalty term of the aspect ratio in the frame regression loss function, a regression loss function named MIoU (Multivariate intersection over union) is proposed, which optimizes the regression process, improves the convergence speed and detection accuracy, and avoids false detection and missed detection of similar targets.  Results and Discussions   Using the anchor frame generated from the infrared ship dataset to train the YOLOv5 algorithm model, the experimental results show that it improves by 0.7% compared to the standard YOLOv5 algorithm on the mAP (Fig.5). Comparative experiments are conducted using different border regression loss functions in the YOLOv5. The border regression loss functions include the border regression loss function Smooth L1 based on center distance and the border regression loss function based on the overlapping area of IoU, GIoU, DIoU, and CIoU. The results show that except for CIoU and MIoU, other loss functions can detect two small targets that are relatively close to each other as a single target. Only CIoU and MIoU border regression function can accurately detect the target and avoid false detection (Fig.8). Compared to other frame loss functions, MIoU frame regression loss functions can detect more targets in the image and avoid missing detection of some targets (Fig.9). Comparing MIoU and CIoU with better test results in terms of frame loss (Fig.10) shows that the MIoU loss function Box-loss decreases by 1.5%. Comparative experiments are conducted to compare the improved YOLOv5 algorithm with other improved YOLOv5 algorithms. The experimental results are given (Tab.2). The ablation experiments are conducted on the improved method, and the results (Tab.4) and the recognition results (Fig.11) of various comparison algorithms are given.  Conclusions  The infrared ship target detection algorithm based on improved YOLOv5 is proposed to address the issues of inaccurate detection and poor boundary regression performance of the anchor frame and dataset target sizes that do not match the YOLOv5 algorithm. Firstly, the K-means anchor frame clustering algorithm is improved, the median is used instead of the average to select the cluster center, the impact of discrete points is avoided, and the intersection ratio of the border represented by two points to replace the distance between the two points is used. The anchor box is made more compatible with the dataset target. At the same time, the aspect ratio penalty term of the border regression function is improved, which effectively avoids gradient explosion in the regression process, and optimizes the border regression process. The ablation and contrast experiments are carried out on the infrared ship data set. The experiment results show that the average detection accuracy of the improved algorithm is 1.1% higher than the standard YOLOv5 algorithm and has higher average detection accuracy than other improved YOLOv5 algorithms, which verifies the superiority of the improved algorithm and improves the detection effect of the infrared ship target.
Infrared technology and application
Non-symmetrical five-sided mirrors based single viewpoint catadioptric infrared omnidirectional imaging system
Zhou Yunyang, Wu Yuzhen, Wang Lingxue, Rong Ningtao, Li Hongbing, Gu Yiting, Cao Fengmei, Cai Yi
2023, 52(10): 20230266. doi: 10.3788/IRLA20230266
[Abstract](168) [FullText HTML] (59) [PDF 3081KB](98)
  Objective  Infrared omnidirectional imaging system can provide 360° image of the surrounding environment, enhancing vehicle safety and autonomous driving ability in low visibility and nighttime conditions. Recent developments in uncooled infrared focal plane detectors have paved the way for large-scale application of low-cost infrared imaging modules in vehicles. Therefore, an aperture-divided non-symmetrical five-sided mirrors based single viewpoint constraint catadioptric omnidirectional infrared imaging system is proposed, which combines the strengths of both multi-viewpoint omnidirectional imaging system and single-viewpoint catadioptric omnidirectional imaging system, taking advantages of the high spatial resolution of the former and the direct imaging without splicing of the latter.   Methods  To solve the problem that the requirement for detection distances of pedestrian in the front and lateral view, such as 200 m, is generally higher than that in the rear view, such as 145 m (Fig.4). Three sets of infrared imaging modules with focal length of 5.8 mm, two sets with focal length of 4.1 mm (Tab.1), and structure based on stitching multi-mirror are used to construct prototype. The structure of the non-symmetrical five-sided mirrors and the spatial position of the infrared imaging modules (Fig.7) are adjusted so that the virtual viewpoints formed by multiple infrared imaging modules with different focal lengths are overlapped at the same point (Fig.6).   Results and Discussions   The design process of single viewpoint constraint non-symmetrical five-sided mirror structure is established (Fig.9). The imaging model of the planar projection converted into omnidirectional image by cylindrical projection is analyzed (Fig.10). A mechanical structure scheme that can be adjusted and aligned with the viewpoint is proposed (Fig.11). The prototype system is processed and assembled (Fig.12), which can provide 360° horizontal azimuth and ±29° elevation field of view (Fig.13).   Conclusion  To address the different requirements for pedestrian detection distances in different direction, a non-symmetrical five-sided mirrors based single viewpoint constraint catadioptric omnidirectional infrared imaging system which has 64° FOV for the front view, left and right lateral view respectively and two 84° FOV for the rear view is proposed. According to the spatial resolution and distance, the appropriate infrared imaging modules are selected, and the specific size of the non-symmetric mirror is determined with the constraint of the single viewpoint. Then the system structure is further optimized with the imaging analysis until the system has small structure size and can image without occlusion. After successfully processing and installing the system, a series of omnidirectional image processing steps including cylindrical projection, scaling, center alignment, redundant part cutting, grayscale balance are also proposed. This system has the potential to serve all-round, large-pitch vehicle-mounted infrared imaging information, which can provide theoretical basis and technical support for applications in military and civilian fields such as intelligent transportation, automatic driving, and military reconnaissance.
Pixel design of large-scale resistor array infrared scene projector
Zhai Diaohao, Chen Yongping, Zhai Houming, Ma Bin
2023, 52(10): 20230028. doi: 10.3788/IRLA20230028
[Abstract](129) [FullText HTML] (47) [PDF 3958KB](79)
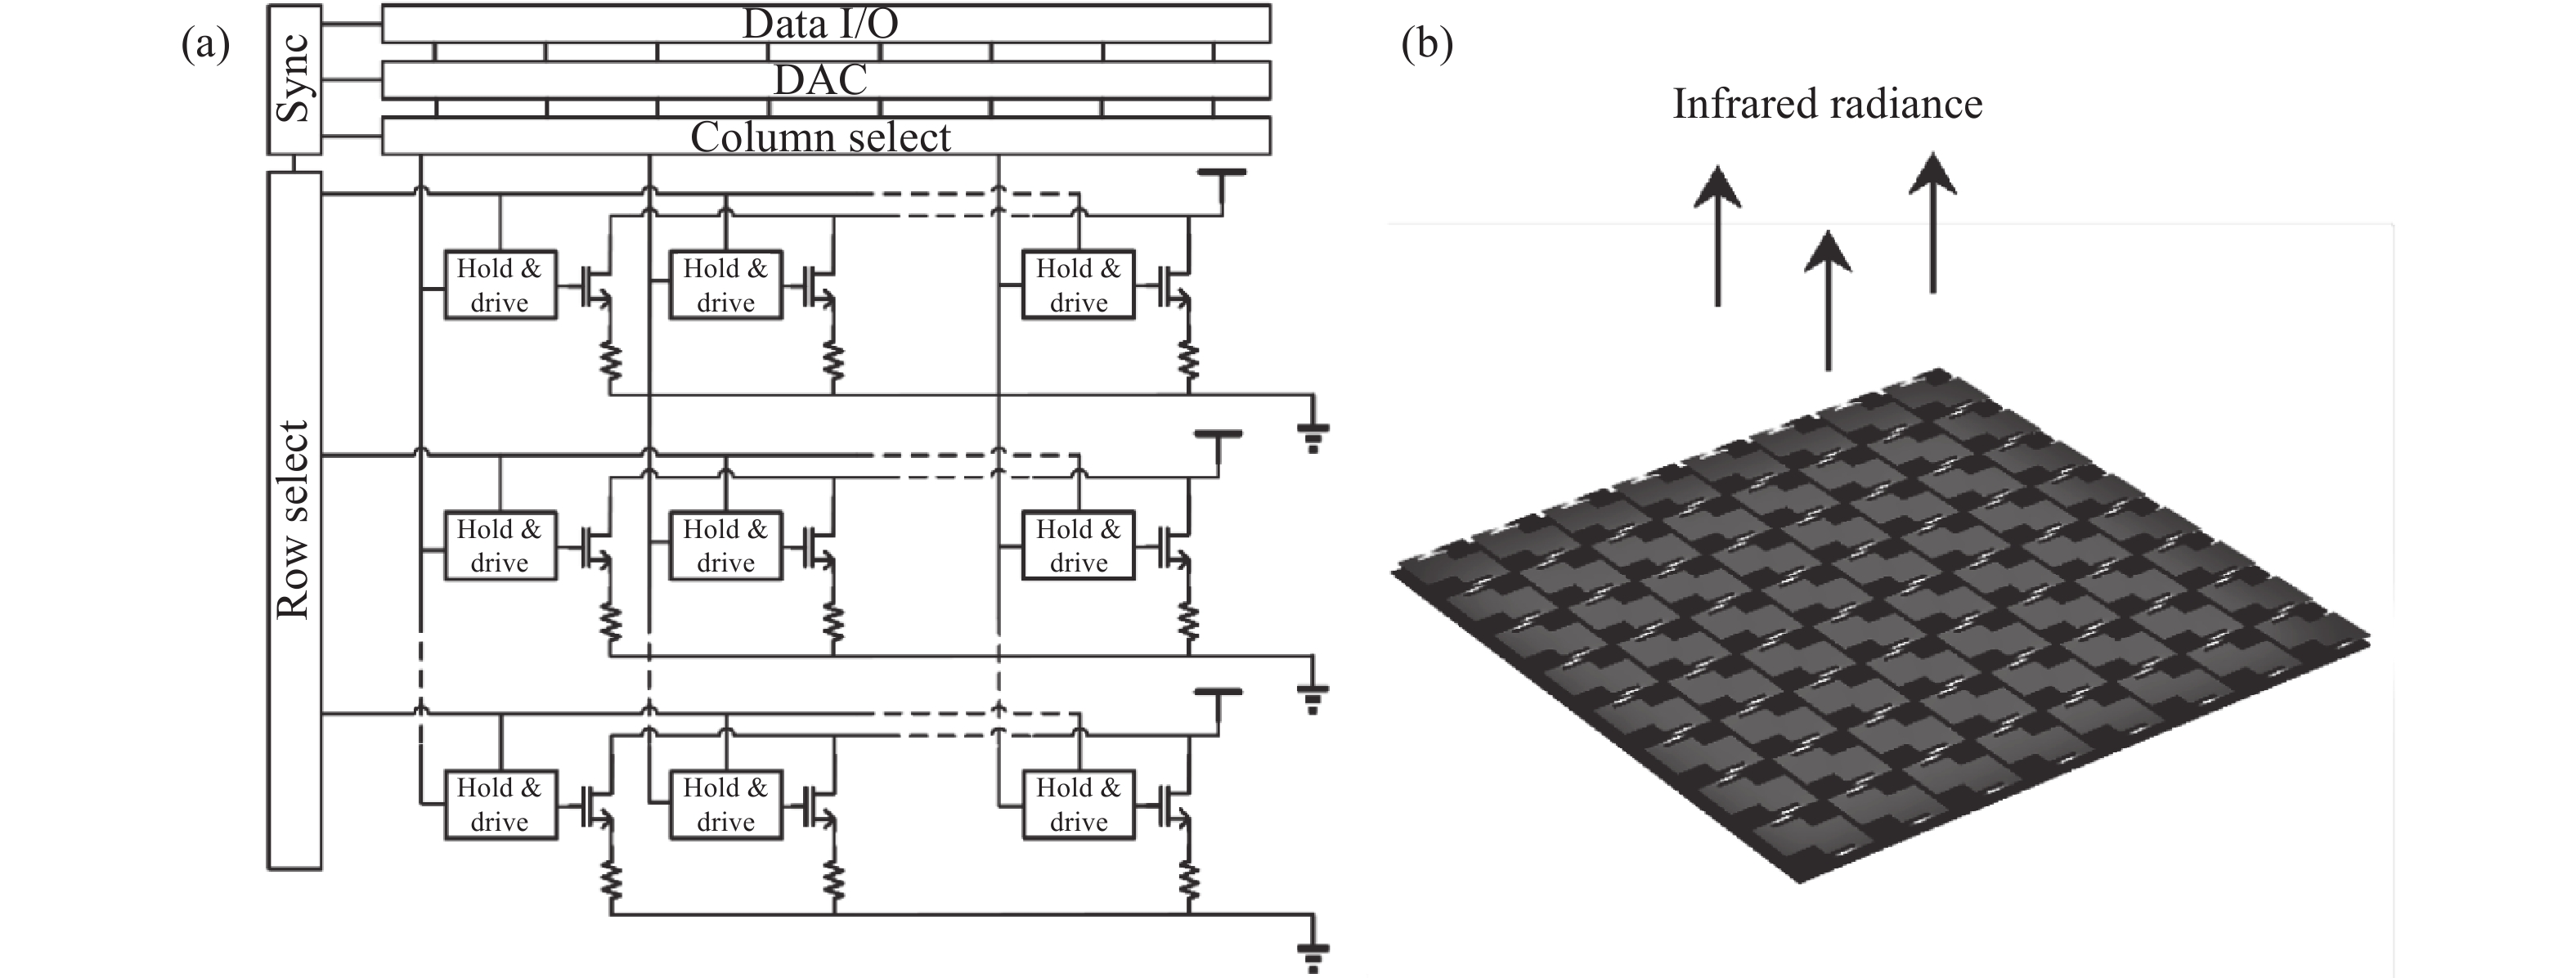
  Objective  As an infrared scene projector, the resistor array device played an important role in hardware-in-the-loop infrared simulation system. Due to the emitted infrared image similar to the real target, it can generate dynamic infrared scene for infrared detectors. Usually, the scale of the infrared detector was 512 × 512 or 640 × 480, meaning the scale of the target simulator should be four times larger to ensure high-quality simulations, and developing a 1 024 × 1 024 scale resistor array device is necessary. The pixel design is the basis of resistor array and it determines the achievable scale and performance of the resistor array. Therefore, a pixel array that can be scalable to 1 024 × 1 024, can operate at 200 Hz, and has an apparent temperature close to 600 K must be achieved. For this purpose, a design scheme for integrating the pixel driving circuit and MEMS structure was proposed, and a scalable high-fill-factor pixel was designed in this paper.  Methods  A pixel circuit operating in snapshot mode was designed according to the functional requirements of the resistor array device (Fig.2). By investigating the design scheme for integrating the pixel driving circuit and MEMS structure, four key factors influencing the pixel performance were deduced, including fill factor, thermal conductance, heat capacity, and surface emissivity. Using the high extinction coefficient materials and an optical resonator structure, the surface emissivity of the micro emitter in mid-wave infrared and long-wave infrared reaches 0.7 (Fig.5). Through proper film thickness design and geometric structure design, the fill factor of the micro emitter array reaches 51% (Fig.4). The thermodynamic simulation was used to assist the design of the micro emitter and evaluate its performance (Fig.6). A MEMS fabrication process was proposed to prepare pixel array sample (Fig.8).  Results and Discussions   The thermodynamic simulation results of the designed pixel show that the apparent temperature of mid-wave infrared and long-wave infrared at 0.6 mW power drive reaches 658 K and 582 K, respectively (Fig.7). The thermal response time for both heating and cooling is less than 5 ms, meaning the pixel can work at 200 Hz. The displacement of the emitter is less than 300 nm, which benefited from the geometry structure and the materials applied. The 640 × 410 array sample showed excellent geometry uniformity (Fig.9). The sample pixel was tested in air at 0.6 mW power drive and showed a long-wave infrared apparent temperature of about 400 K. The image result of this sample proved that the pixel design was achievable and functional (Fig.10).  Conclusions  Aiming at the requirements of developing large-scale resistor array devices, a design scheme for integrating the CMOS driving circuit and the MEMS structure into the pixel was proposed. The pixel driving circuit can work in snapshot mode. Benefiting from the MEMS structure, the fill factor of the micro emitter reaches 51%, which is much higher than that of the traditional resistor array. The thermodynamic simulation results showed that the radiation efficiency of the designed pixel was sufficiently high and capable of being applied in 1 024 × 1 024 resistor array device design. An array sample was fabricated using the proposed MEMS process. The test result of this sample proved the pixel design is achievable. The design research indicates the direction for developing domestic large-scale and high-fill-factor resistor array devices.
SWIR focal plane array cooled assembly of Tianwen-1 mineralogical spectrometer
Zeng Zhijiang, Li Xue, Zhou Songmin, Zhuang Fulong, Fan Guangyu, Hao Zhenyi, Fan Cui, Gong Haimei
2023, 52(10): 20230005. doi: 10.3788/IRLA20230005
[Abstract](116) [FullText HTML] (40) [PDF 5180KB](90)
  Objective  Mars mineralogical spectrometer (MMS) is one of the scientific instruments for China's first Mars exploration mission. It is installed in the Mars exploration orbiter and performs spectral remote sensing detection of targets on the surface of Mars while in motion. The instrument has made breakthroughs in key technologies such as infrared background suppression, high efficiency spectroscopic structure, and on-device combined calibration. The characteristics of the instrument are light and small, low power consumption and high performance. The 512 pixel × 320 pixel short wave infrared (SWIR) integrated detector Dewar cooler assembly (IDDCA) is an important part of the MMS and is used for hyperspectral imaging. This paper analyzes the characteristics of the IDDCA in MMS, focuses on the development and technical difficulties of the infrared focal plane detector, integrated Dewar and integral rotary cooler, and also proposes approaches and methods to solve the technical problems.  Methods  The 512 pixel × 320 pixel SWIR focal plane arrays (FPAs) is made of mercury cadmium telluride epitaxial material, prepared by n-on-p planar junction technology, is integrated CTIA input readout circuit, using indium column flip chip welding interconnection to form an infrared focal plane device. The detection signal of the 512 pixel × 320 pixel IR FPA is integrated, stored, converted, and outputted by using the window mode. The FPA architecture provides temporal detection in the SWIR bands using the frame integration incorporated into the readout integrated circuit (ROIC). The mechanical support of the integrated Dewar cold platform is a high-strength single cantilever cold finger, and a radial impact-resistant oblique support structure design is adopted (Fig.2). For the infrared Dewar in the MMS, the following designs have been applied: 1) Lightweight and impact-resistant integrated package structure; 2) Spectroscopic spectrum inside the assembly; 3) Special-shaped cold platform. The miniaturized integral Stirling cooler is selected, and the cooler drive control board is designed with an independent thick-film circuit required by aerospace.   Results and Discussions   The overall technical requirements of the IDDCA for the MMS are shown (Tab.1). The results of the detector show that the signal to noise ratio (SNR) is 225 in the typical band of 1.595 μm. The thermal noise generated during the 40 ms long integration time of the detector is effectively eliminated by the integrated optimized cold platform (Fig.6). Moreover, the Dewar assembly is structurally sound after being subjected to random vibration of 14 grms (20-2000 Hz) and mechanical shock of 1400 g. The results of different fill pressure and cool down time of the cooler are shown (Fig.9). The actual installed product has the fill pressure of 42 mbar, which can ensure a long enough life from leakage to failure. Through the development of the above-mentioned key components, a good performance IDDCA was successfully obtained, and its main performance parameters are shown (Tab.6). The spectral test curve of the IDDCA for the MMS and the good infrared imaging effect in the spectrometer are shown (Fig.10).  Conclusion  The IDDCA has advantages in aerospace applications of deep space exploration and interplanetary exploration due to their compact structure, low size, weight and power (SWaP). The application of this component for spaceflight is of great significance. This paper focuses on the design and implementation of key technologies such as high sensitivity, high signal to noise ratio FPA, anti-noise Dewar structure with long integration times, integrated long-life integral cooler. A series of mechanical and thermal environmental tests have been completed for the IDDCA. It was successfully launched with Tianwen-1 and reached Mars orbit, providing a certain reference for China subsequent deep space infrared spectroscopy detection.
Calculation model of surface temperature of ground target under the coupling effect of wind-driven rain and moisture and heat
Su Xindi, Han Yuge, Ren Dengfeng
2023, 52(10): 20230009. doi: 10.3788/IRLA20230009
[Abstract](117) [FullText HTML] (19) [PDF 6455KB](52)
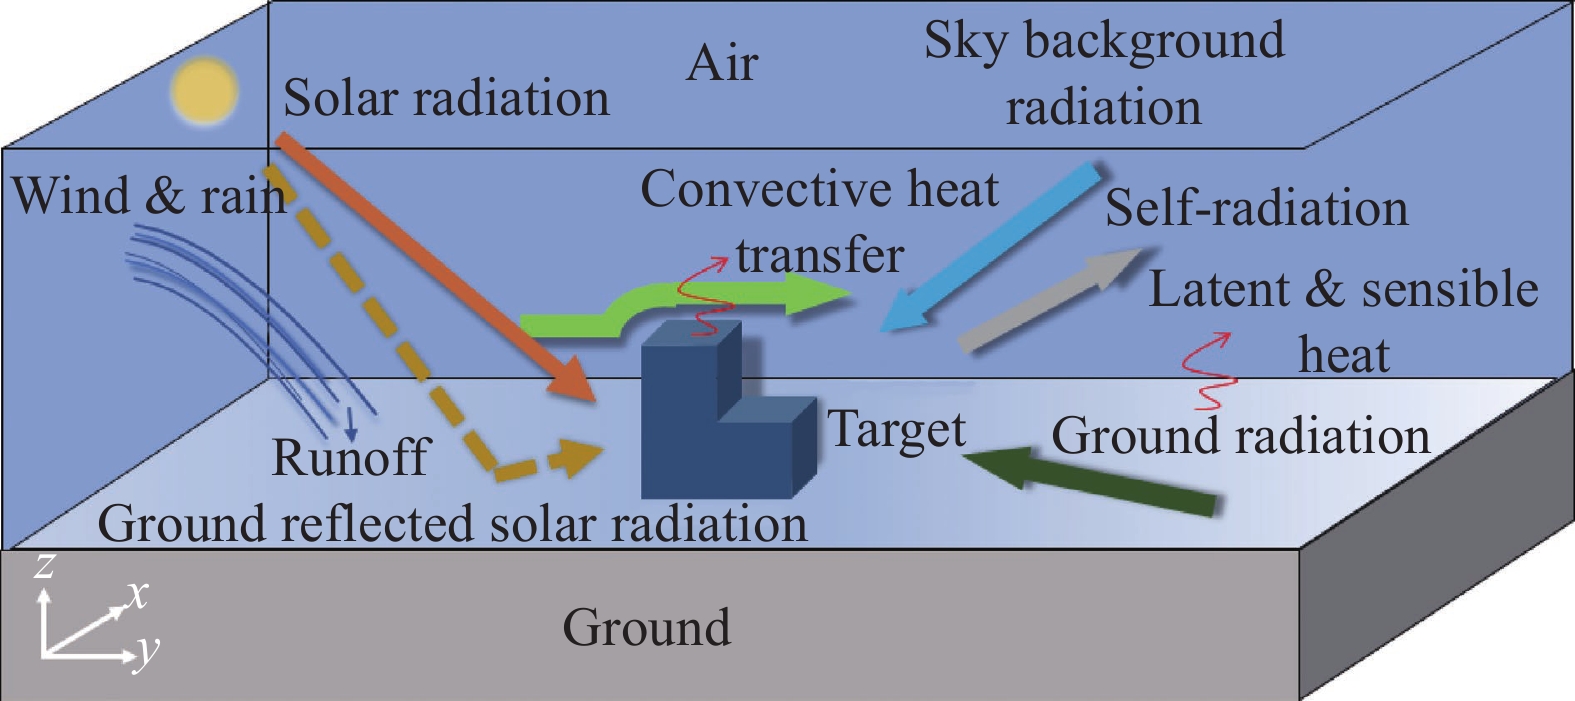
  Objective  The weather environment is unpredictable, and rainy weather is even more inevitable. Studying the surface thermal characteristics of ground targets can better serve thermal infrared detection and guidance, improving the accuracy of target positioning. Most of the existing research on the thermal and infrared characteristics of ground targets is based on sunny conditions, while few studies have been conducted on the surface temperature characteristics of ground targets under cloudy and rainy conditions. The distribution of rainfall on the surface of ground targets under overcast and rainy weather conditions is affected by rainfall and wind force; The ground background is affected by the latent heat caused by moisture absorption and evaporation of permeable materials, resulting in uncertainty in the thermal characteristics of the ground target surface. Therefore, this paper proposes a calculation model for surface temperature of ground targets that integrates wind-driven rain and moisture heat coupling, and studies the thermal characteristics of surface targets under overcast and rainy weather conditions, as well as the effects of rainfall intensity and wind direction on surface temperature characteristics of targets.  Methods  In Open FOAM, an open source platform, combining air flow model, radiation heat transfer model, wind-driven rain model, and moisture heat coupling model, a ground target surface temperature calculation model integrating wind-driven rain and moisture heat coupling is established (Fig.2), and the call and coupling process is given (Fig.3). The reliability and accuracy of the integrated model were verified using CUBI model experiments. The calculated temperature curve was similar to the temperature variation trend of the characteristic points on the surface of the CUBI model in the experiment (Fig.9), and the average absolute error was 0.95 K. The calculation model is used to study the thermal characteristics of the surface of a ground target under overcast and rainy weather conditions, as well as the effects of rainfall intensity and wind direction on the temperature characteristics of the target surface (Fig.11, Fig.13).  Results and Discussions   The simulated value of the target surface temperature calculated by the integrated calculation model has a highly consistent trend with the measured value of the thermocouple, and the average absolute error of each surface during the 24-hour numerical calculation is 0.95 K; At the time of the rainfall, the temperature difference on the target surface is small, and due to the impact of rainfall and wind direction, the temperature on the windward side of the target is usually lower than the temperature on the leeward side due to the high rainfall capture rate; Changes in rainfall intensity, wind speed, and direction will affect the distribution of rainfall capture rate on the target surface (Fig.10, Fig.12), thereby affecting the distribution of surface temperature characteristics.  Conclusions  In this study, a calculation model of surface temperature of ground targets considering the coupling of wind-driven rain and moisture heat is presented for overcast and rainy weather conditions. This method uses a fully integrated three-dimensional numerical model to study the temperature distribution characteristics of ground targets and backgrounds, fully considering water and heat transfer. The calculation model can provide detailed spatial distributions of velocity, temperature, and humidity, which can be used to study the temperature distribution characteristics of ground targets affected by solar radiation, air humidity, wind speed, and wind direction under complex weather conditions. The model has reliability and good accuracy, and can provide methodological support for the thermal characteristics analysis of complex ground targets under cloudy and rainy weather conditions.
Optical devices
Digital lock-in amplifier controlled by FPGA for spectral measurement
Zhang Leilei, Cao Zhensong, Zhong Qing, Huang Yinbo, Yuan Zihao, Huang Jun, Qi Gang, Pan Wenxue, Lu Xingji
2023, 52(10): 20230023. doi: 10.3788/IRLA20230023
[Abstract](285) [FullText HTML] (60) [PDF 3630KB](82)
  Objective  The effect of thermal blooming in the laser propagation experiment is an important factor affecting the propagation evaluation. The thermal blooming is due to the absorption of gas, which causes the local air to be heated, causing the air to form a density gradient, resulting in refraction and scattering during laser transmission, thus causing the distortion of the laser spot and affecting the experimental results. In the inner channel of the laser propagation, because the laser energy density is high and the air velocity is slow, the thermal blooming is more obvious. Even the trace greenhouse gases will affect the laser propagation. CO2 is the greenhouse gases of highest concentration and the most difficult to completely remove in the inner channel of laser propagation. Therefore, high-precision detection of CO2 in the propagation channel is of great significance for propagation evaluation. The inner channel of the laser propagation is characterized by small space and low CO2 concentration, so a miniaturized and highly sensitive detection system is required. Wavelength Modulation-Tunable Diode Laser Absorption Spectroscopy (WM-TDLAS) technology as an effective detection method is widely used in the detection of trace gas. However, WM-TDLAS system has complex structure and large volume. Therefore, the lock-in amplifier as the core device of WM-TDLAS system is studied in this paper to meet the requirements of high-precision detection of CO2 and make the WM-TDLAS system more miniaturized.   Methods  The principle of wavelength modulation detection and lock-in amplifier deeply is analyzed, and the key technologies of digital lock-in amplifier are optimized. The reference signal is generated internally based on DDS principle, and the frequency of sine and cosine reference signal is designed to be adjustable which can expand the scope of application (Fig.2). Combined with the characteristics of wavelength modulation, the integral length of CIC filter is improved based on the number of periodic data points of the modulated signal, and the average is achieved by shifting (Fig.3). The narrow-band low-pass filtering is achieved by CIC filter cascaded FIR filter (Fig.4). JPL algorithm and CORDIC algorithm used to calculate root of sum of squares are simulated. According to the simulation results, the CORDIC algorithm is more suitable for lock-in amplifier (Fig.5). The functions of the lock-in amplifier are implemented based on FPGA (Fig.6). In order to make the system more miniaturized, the software is realized based on Qt and serial communication is combined, so that the lock-in amplifier has the function of data acquisition and processing (Fig.7). Relevant hardware circuits are designed (Fig.9). A WM-TDLAS system is built based on multi-pass cell and the experiments are carried out to verify the function of the designed digital lock-in amplifier (Fig.10).   Results and Discussions   The reference signal frequency of the designed digital lock-in amplifier is 1-40 kHz adjustable and integration time is 200 μs-20 ms adjustable. The high precision ADC module is designed, and the voltage resolution can reach 0.3 mV. The volume of the final hardware circuit is about 150 cm3, which is far smaller than the commercial lock-in amplifier (Tab.1). Under the condition of normal temperature and pressure and optical path of 30 m, absorption spectrum of CO2 was measured at 2 μm band, the signal-to-noise ratio of the wavelength modulated absorption spectrum is 102.6, which is about 11.7 times of the direct absorption signal-to-noise ratio of 8.8 (Fig.11). Calibration experiment of low concentration CO2 is designed and carried out to obtain the linear correlation of the second harmonic amplitude and CO2 concentration of 0.996 (Fig.12). Under the condition of pure nitrogen, Allan variance is used to evaluate the system performance. When the average time is 2 s, the lower limit of system detection is 1.30 ppm, and when the average time is 180 s, the lower limit of system detection is 0.19 ppm (Fig.13). The system response time is analyzed, and the gas concentration can be obtained within 0.5 s (Fig.14).  Conclusions  A digital lock-in amplifier is designed based on FPGA and Qt. The key algorithms in the lock-in amplifier are analyzed and optimized, and the relevant software and hardware are implemented. Experiments such as harmonic detection of low concentration CO2, calibration of low concentration CO2, analysis of detection sensitivity and analysis of system response time were carried out. The experimental results show that the designed digital lock-in amplifier has the characteristics of high sensitivity, adjustable parameters, real-time processing and miniaturization, and can meet the requirements of low concentration CO2 detection in the inner channel of laser propagation.
Low-dimensional flexible light-emitting device based on quantum dots & nanowire composite
Liu Chunyang, Sheng Yujie, Tong Jinyang, Lu Xingqiao, Yu Changming, Mu Yining, Wang Xuewen
2023, 52(10): 20230433. doi: 10.3788/IRLA20230433
[Abstract](108) [FullText HTML] (59) [PDF 4015KB](42)
  Objective  Flexible self-luminescent devices are the frontier subject in the field of illumination and display. Compared to organic light-emitting diodes, inorganic semiconductors offer more stable physical and chemical properties. However, crystalline inorganic films do not have good flexibility and are easy to crack after bending. Low-dimensional nanowire array structures have become a new breakthrough in the research of flexible devices. Wide bandgap semiconductor zinc oxide (ZnO) is an ideal material for developing short wavelength luminescence and laser devices. ZnO is also one of the most researched nanomaterials currently. Recently, all inorganic cesium lead halide perovskite materials (CsPbX3 (X=I, Br, Cl)) have sparked a new research boom due to their excellent optical properties. Cesium lead halide perovskite quantum dots have high luminescent quantum yields. By dispersing perovskite quantum dots as fluorescent layers in nanowire arrays, the high fluorescence efficiency of perovskite materials can be utilized to achieve visible band flexible devices.   Methods  ZnO nanowire array was prepared by hydrothermal synthesis method. Zinc foil was used as a flexible substrate. Due to the polycrystalline nature of the zinc foil substrate and the random orientation of surface Zn grains, nano ZnO layer was deposited on the pre-cleaned substrate surface by sputtering method as the seed layer for nanowire growth (Fig.1). In order to construct MIS heterojunction devices, MgO layer was deposited on the surface of ZnO nanowire arrays by magnetron sputtering. Au electrode with a diameter of 1 mm was deposited on the surface of MgO layer using thermal evaporation method and mask technology. The MIS junction light emitting device based on ZnO/MgO nanowire array heterostructure was constructed (Fig.9). Then, CsPbBr3&CsPbI3 perovskite quantum dots were prepared by thermal injection method. Lastly, CsPbBr3&CsPbI3 quantum dots/PMMA saturated solution were spin coated and dispersed into the ZnO nanowire array to form a packaging layer. Using MIS heterojunction as a short wavelength excitation source and perovskite quantum dots as a fluorescent layer, a flexible fluorescent LED prototype device is constructed (Fig.13).   Results and Discussions   As the concentration of precursor solution is 20 millimoles per liter, the size of the top and root of the nanowire is uniform, showing a highly oriented growth perpendicular to the substrate direction (Fig.3). ZnO nanowires exhibit a strong ultraviolet emission peak near 375 nm with a narrow width of ~23 nm, which can be attributed to exciton related transition recombination (Fig.4). In the visible wavelength range of 450-700 nm, the emission related to deep level defects commonly observed in ZnO was almost invisible. The photoluminescence spectra of ZnO nanowire arrays exhibit a high UV visible luminescence ratio, indicating that the prepared nanowires have high crystal and optical quality, further reflecting the high crystallinity of the nanowires. After depositing the MgO film layer, the UV emission peak position, line width, and deep level emission of the ZnO nanowire array remained almost unchanged. Compared to the uncoated nanowire array, the UV intrinsic emission of ZnO increased by ~10.3% after depositing MgO layer (Fig.8). Nanowire light-emitting devices exhibit pure ultraviolet emission under different bias voltages, and no deep level defect related emission in the visible region is observed. Electrically pumped UV random lasing was realized under very low forward bias voltage from this flexible light-emitting device (Fig.10). As to the flexible light-emitting devices of nanowire/quantum dot composite system, the proportion of green light is larger than red light and blue light (Fig.14). Therefore, the device exhibits warm white light.   Conclusions  In this work, ZnO/MgO nanowire array heterostructures were prepared and synthesized on flexible zinc foil substrate, and MIS junction light-emitting prototype device was constructed. By changing the concentration of precursor in hydrothermal synthesis, controllable synthesis of ZnO nanowire arrays with appropriate surface density was achieved. The deposition of MgO not only formed a continuous coating layer, but also effectively passivated the non radiative recombination centers on the nanowire surface, further improving the UV intrinsic emission of ZnO nanowires. In this flexible heterojunction devices of nanowire arrays, ultraviolet electroluminescence and electrically pumped lasing from ZnO nanowires have been achieved. Subsequently, CsPbBr3&CsPbI3 perovskite quantum dots were synthesized using thermal injection method, and the quantum dots/PMMA saturated solution were spin coated and dispersed into ZnO nanowire arrays. A flexible fluorescent warm white LED prototype device was constructed using MIS heterojunction as a short wavelength excitation source and perovskite quantum dots as a fluorescence layer. This paper explores new development ideas for flexible luminescence and display.
High resolution microwave photonic filter with arbitrary filtering shape
Wang Jingwen, Yin Zikai, Yin Feifei, Dai Yitang
2023, 52(10): 20230015. doi: 10.3788/IRLA20230015
[Abstract](192) [FullText HTML] (58) [PDF 2626KB](67)
  Objective   Microwave photonic filter is one of hot research topics in recent years due to their ability to achieve high bandwidth, anti-electromagnetic interference, fast tunability and reconfigurability with the advantage of optical devices. In order to realize the flexible reconfiguration of the filter response, the response can be flexibly configured by constructing a finite impulse response filter in the optical domain, where the taps can be flexibly configured. Optical frequency combs are capable of providing a larger number of combs as filter taps and are now widely used. A large number of combs allow for more taps, implying a larger quality factor and a larger time bandwidth product, which also allows for higher frequency resolution. However, in optical frequency comb-based filter schemes, simply having a large number of taps are not enough to achieve arbitrary reconfigurability of the filter shape. It is well known that positive coefficient tapped finite impulse response filters can only achieve a low-pass response, whereas bandpass, high-pass or more complex waveforms require the introduction of negative coefficients in the taps. With the help of programmable waveshaper to differentially control different combs of the optical frequency comb in the optical domain, combined with optical devices such as photodetectors, filters with positive and negative coefficients can be realized. In addition, in the process of realizing the response, the beat frequency between the comb lines of the optical frequency comb introduces unwanted spuriousness. Therefore, the operating frequency of existing optical comb-based microwave photonic filter schemes must be strictly limited to a single "Nyquist zone," which undoubtedly limits the operating frequency range of the filter. By introducing proper pre-dispersion, this spurious signal can be effectively suppressed and the operating frequency range of microwave photonic filter can be expanded.  Methods   A high-resolution reconfigurable microwave photonic filter scheme based on optical frequency comb is proposed to address the above problem (Fig.1). By using waveshaper to realize the independent and flexible configuration of each tap, combined with balanced photodetectors, the positive and negative taps of the filter are realized, which can complete the formation of arbitrary filter waveforms without low-pass response. By using a flat optical frequency comb with a large number of combs generated by a cascaded electro-optic modulator as a light source, the filter is able to achieve high resolution in the order of tens of MHz. At the same time, the spurious signals are effectively suppressed by introducing pre-dispersion so that different values of dispersion are introduced to the carrier and sidebands (Fig.2).  Results and Discussions   The simulation verifies that the filter has a high resolution of 93MHz (Fig.3), (Fig.4), the spurious suppression of more than 40 dB (Fig.7), and the innovative construction of low-pass, band-pass, high-pass, and band-stop filters with different center frequencies, as well as arbitrary filter shapes such as rectangular, Gaussian, and sinc (Fig.5), (Fig.6), which plays a leading role in the subsequent research of microwave photonic filter.  Conclusions   The theory of microwave photonic filter based on optical frequency combs proposes a high-resolution reconfigurable microwave photonic filter scheme capable of realizing arbitrary filter shapes. By using the optical frequency comb generated by the cascaded electro-optic modulator method as a light source, the amplitude of the signal is flexibly configured using a waveshaper, and the signal is split into two outputs from two independent ports. In recovering the broadband radio frequency signal, coherent detection technique is used to physically realize the positive and negative taps of the filter, which ultimately accomplishes the reconstruction of arbitrary response shapes without low-pass response. A flat optical frequency comb with a large number of combs increase the number of taps and realizes the high resolution of the filter. In addition, the filter is able to effectively suppress the spurious frequency components due to the different dispersion values introduced by the carrier and sidebands. Simulations demonstrate the high-resolution response of the filter at 93 MHz, and low-pass, band-pass, high-pass, and band-stop filters with different center frequencies, as well as arbitrary filter shapes such as rectangular, Gaussian, and sinc shapes, are constructed. In addition, by introducing pre-dispersion, the filter achieves a spurious rejection ratio of more than 40 dB.
Design of speckle calculation recombination spectrometer based on chalcogenide glass-polymethyl methacrylate spectroscopic structure
Shen Wenli, Tan Qiulin, Zhang Lei, Xie Hao
2023, 52(10): 20230038. doi: 10.3788/IRLA20230038
[Abstract](99) [FullText HTML] (22) [PDF 3442KB](35)
  Objective  After nearly half a century of development, infrared spectroscopy has been widely used in food, medicine, biological diagnosis, agriculture, textile, oil refining and chemical industries. The optical path of the traditional infrared spectrometer is more complex, and often with moving parts, so the requirement of machining accuracy is very high, and the optical components in the optical path are also expensive. These factors make the infrared spectrometer expensive and the stability, reliability and working environment adaptability of the system weak. Small spectrometers have received extensive attention and developed rapidly due to their significant advantages in size, weight, and power consumption. In particular, computational spectral analysis technology based on speckle detection can obtain high-precision spectral information by recording and analyzing the speckle patterns formed by scattering elements on the measured light. Speckle computational reconstruction spectrometer has the advantages of both small size and high resolution, and because the preparation of scatterers is simpler and costs less than various strictly designed micro-nano structures or materials with different components, it is a spectral analysis technology with great application potential.   Methods  A set of speckle calculation recombination spectrometer system is designed in this paper. The spectroscopic structure was designed using chalcogenide glass IG2 and polymethyl methacrylate (PMMA) materials. The uniform random distribution method of these two materials was studied. The disordered scattering structure was constructed based on the difference in refractive index changes of the two materials (Fig.3). The spectrometer system was tested by Tracepro software design simulation experiment.  Results and Discussions  The speckle calculation recombination spectrometer system adopts a special spectroscopic structure. The spectroscopic structure is designed based on the uniform random distribution of chalcogenide glass IG2 and polymethyl methacrylate (PMMA), which can generate speckles with uniform distribution and high contrast, and has good spectroscopic effect (Fig.6). Multiple sets of simulation experiments were designed by Tracepro software to verify the performance of the system. In the 1-10.9 μm wavelength range, the relative error of the simulation results of the test light composed of the calibration light is 1.29% (Fig.7). The relative error of the simulation results of the uncalibrated 5.01 μm wavelength monochromatic light is 3.37% (Fig.8). The simulation results of uncalibrated 3 000 K blackbody radiation are fitted by 6-order polynomial. The maximum absolute error of the calculated value is 2.581 6 W, and the maximum absolute error of the fitting curve is 0.678 7 W (Fig.9). In the high-resolution simulation of 1-2 μm wavelength range, the simulation results of 3 000 K, 4 000 K and 5 000 K blackbody radiation are fitted by 6-order polynomial. The maximum relative errors of the fitting curves are 2.07%, 5.32% and 4.28%, respectively (Fig.10). The results of the simulation test show that the system can maintain small error under the condition of wide range or high resolution.   Conclusions  A speckle calculation recombination spectrometer system with working wavelengths of 1-10 μm and 1 000-2 000 nm was designed. The system is characterized by small size, no moving components, simple and stable structure, low production cost and easy production. The system function was simulated by using Tracepro software. The resolution reached 0.1 μm in the spectral range of 1-10.9 μm, and the maximum relative error of the test results was 3.77%. The resolution reaches 10 nm in the spectral range of 1 000-2 000 nm, and the maximum relative error of the test results is 5.32%. The simulation results show that the system has large range, high resolution and low error, and can select the corresponding wavelength range according to the actual situation to meet different application requirements.
Lasers & Laser optics
Method for characterizing frequency of frequency-stabilized semiconductor lasers
Li Shanshan, Yang Jiewei, Yang Tianxin, Wang Zhaoying, Zhang Hengkang
2023, 52(10): 20230063. doi: 10.3788/IRLA20230063
[Abstract](156) [FullText HTML] (47) [PDF 1382KB](63)
  Objective  The demand for on-line and real-time monitoring of frequency-stabilized semiconductor laser is very high and urgent. Especially, the continuous wave lidar developed in recent years usually takes a single frequency semiconductor laser as a seed source, and obtains the frequency of the radar signal through coherent detection, so as to obtain the distance of the target. It results in the frequency accuracy of the seed light source directly determing the ranging accuracy. Therefore, new requirements are proposed for the characterization of the frequency stabilization of the light source. More attention is paid to short-term (in coherent time of sub-microsecond up to milliseconds) frequency change patterns, rather than the absolute frequency accuracy in a long duration of minutes, even up to 24 hours; At the same time, the frequency monitoring system is required to have functions of on-line and real-time monitoring.  Methods  Aiming at these requirements, based on the principle of delay self-heterodyne, this paper proposes a method for characterizing the frequency of frequency stabilized laser. By deriving the principle rigorously and programming the algorithm, the monitoring system not only has a simple structure (Fig.1), but also realizes the functions of online and real-time monitoring.   Results and Discussions  The frequency variation curve of a frequency-stabilized distributed feedback semiconductor laser (DFB-LD) using hydrogen cyanide (H13C14N) gas absorption spectrum based on side frequency locking technique is measured. The result is that the maximum frequency range of the stabilized laser is about 25 MHz in 10 ms, and it is clearly observed that the frequency changes of the laser are not in one-way drift pattern (Fig.2). In order to further verify the accuracy of this method, the mainstream femtosecond optical frequency comb beat method is adopted to measure the frequency change of the same frequency-stabilized DFB-LD offline (Fig.3-4). The experimental results show that the frequency range is about 30 MHz within 50 minutes (Fig.5).   Conclusions  The measurement results of the two methods are in the same magnitude order of MHz, which proves that the method is a fast and reliable way for optical frequency analysis, and can be used to adjust a servo-loop system of frequency stabilized laser in real time and on-line in application systems.
End-pumped Nd:YAG/Cr4+:YAG/KTA passive Q-switched cascade Raman laser
Qi Ziqin, Mao Wenjie, Wang Hongyan, Zhu Xiaolong, Qiu Xinnan, Lu Huanqia, Zhu Haiyong
2023, 52(10): 20230079. doi: 10.3788/IRLA20230079
[Abstract](129) [FullText HTML] (35) [PDF 1514KB](43)
  Objective  KTA crystal as Raman gain medium has attracted increasing attention. Its larger Raman gain and smaller Raman shift make it more advantageous for cascade Raman conversion to obtain new wavelength Stokes laser of 1 178 nm and 1 212 nm. The frequency doubling of both two Stokes laser could realize yellow and orange emissions which have important applications in remote sensing, laser medicine and so on. In particular, 1 212 nm laser has an absorption affinity for lipid-rich tissues and can be used to stimulate adipose cells and mesymal fine tissue in subcutaneous tissues, which is an ideal source for laser assisted skin healing and prevention of excessive scar formation. In view of the important applications of 1 178 nm and 1 212 nm laser, KTA cascade Raman operation driven by passive Q-switched laser for these two wavelengths generation was further investigated.  Methods  The laser system for KTA cascade Raman operation is shown (Fig.1). Nd:YAG/Cr4+:YAG composite was used for passive Q-switched laser generation. Cr4+:YAG crystal, with an initial transmittance of about 85%, was used as saturable absorber crystal and diffusion bonded to Nd:YAG crystal to make the laser system more compact and easy to dissipate heat. An x-axis cut KTA crystal with 25 mm in length was used as the Raman crystal. The plano-concave cavity with the total cavity length of about 50 mm guarantees the effective oscillation of the fundamental laser and Raman laser. The specific coating parameters are shown (Fig.2). The transmittance of Stokes wavelengths based on the Raman shift of 234 cm−1 and 671 cm−1 is also given (Fig.2).  Results and Discussions  With the increase of Raman laser output power, we found the Stokes laser was accompanied by a small amount of yellow laser output, and the corresponding yellow light spectrum was shown (Fig.3). Under an incident pumping power of 10.05 W, an average output power of 280 mW was obtained, and the conversion efficiency is 2.8%. The output power and laser wavelength are shown (Fig.4-5). From the threshold to 8 W incident pump power, the main intensity laser wavelength was 1 178 nm, accompanied by a weak 1 146 nm wavelength. With the further increase of incident pump power, 1 212 nm wavelength laser appeared. As the incident pump power gradually further increased, the proportion of 1 212 nm line in the total output intensity also increased. A dual-wavelength laser with 1 178 nm and 1 212 nm output was obtained under the incident pump power of 10.05 W. The results show that the third- and fourth- Stokes laser generation with a Raman shift of 234 cm−1, as well as the yellow laser produced by frequency doubling of 1 146 nm would lead to gain competition, and reduce the conversion efficiency of Stokes laser at 1 178 nm and 1 212 nm. The recorded pulse profile and pulse train at the highest output power are shown (Fig.7). The pulse repetition frequency was 10.3 kHz and the pulse width was about 1.2 ns. The compact passive Q-switched Raman laser cavity increased the power density, and resulted in the improvement of the Raman conversion, so as to realize the high-order Stokes waves.  Conclusions  In this study, a diode end-pumped passive Q-switched cascade Raman laser with the Raman shifts of 671 cm−1 and 234 cm−1 based on KTA crystal is reported. Nd:YAG/Cr4+:YAG composite crystal is used to generate pulsed fundamental laser and then to drive KTA crystal. The output power, spectrum and pulse characteristics of cascade Raman laser with different incident pump power are studied. With the increasing pump power, the output laser wavelength shifted from single wavelength of 1 178 nm based on 671 cm−1 and 234 cm−1 cascaded Raman shifts to dual-wavelength output of 1 178 nm and 1 212 nm. Under an incident pump power of 10.05 W, a dual-wavelength laser with an average output power of 280 mW and a conversion efficiency of 6.2% was obtained. The corresponding pulse width and pulse repetition frequency are 1.2 ns and 10.3 kHz, respectively. The single pulse energy and peak power are 27.2 μJ and 22.7 kW, respectively. The results show that rich Stokes laser wavelengths could be obtained based on two comparable gain Raman shifts of KTA crystal with the coating control of the cavity mirror.
Thermal stability and compensation of compact dual-path TEA CO2 laser resonant cavities
Zhu Ziren, Bai Jinzhou, Fu Jingjing, Su Xinjun, Ye Jinghan, Liu Yu, Yang Yinhui, Huang Wenwu, Li Hui, Zheng Yijun, Tan Rongqing
2023, 52(10): 20230020. doi: 10.3788/IRLA20230020
[Abstract](117) [FullText HTML] (23) [PDF 2033KB](45)
  Objective  Transversely Excited Atmospheric (TEA) CO2 laser can achieve tunable output at 9-11 μm which covers several atmospheric windows. It has improved a lot towards higher peak power and repetition frequency in the applications such as laser radar and laser manufacturing since the beginning of the 21st century. Heat effect as a product of gas discharging may bring unwelcomed effects on laser components and parts. Previous researches mainly focused on thermal deformation of laser windows under the situation of multi-kilowatt output. With the finite element theory, specific deformation data features were studied and corresponding compensation methods were proposed as well. However, thermal deformation of laser resonant cavities was commonly neglected as the huge bulk of cavities had large thermal capacity and good heat dissipation. With the recent development of lidar applications, opposite demand of TEA CO2 lasers for small size and high reliability was put forward. Consequently, thermal deformation of resonant cavity instead of laser window is more likely to take place due to local heat effect. By far rare research works were carried out on this topic. For this purpose, thermal stability and compensation of compact dual-path TEA CO2 laser resonant cavities were studied.  Methods  A compact dual-path TEA CO2 laser was developed. Deformation of resonant cavity in the action of local heat effect was measured with an indication beam (Fig.2, Eq.(14)). It was also simulated in both azimuth and pitch directions with Ansys Workbench (Fig.4-5). Hypothesis of the deformation counteract by balancing the local heat effect with thermal expansion was calculated (Fig.7) and experimentally realized by an axial flow DC fan assisted heat extraction structure (Fig.6, Fig.8). Moreover, angular compensation measures were taken after restraining the local heat effect. The azimuth angular compensation was achieved by adjusting servo motor steps under different ambient temperatures. The pitch angular compensation was realized by changing the bottom displacement of the cantilever tuning structure with a PZT actuator.  Results and Discussions  The angular deviation of resonant cavity mirrors changed linearly regardless the presence of local heat effect. While local heat effect caused unequal angular deviation between resonant cavity mirrors. By adjusting heat exchanging efficiency, local heat and overall heat expansion reached a balanced counteraction in cavity deformation, thus the deviation of resonant cavities mirrors was limited to a low level within 13-22 ℃. Output pulse energies decreased more gently in the condition of enhanced heat exchange. Angular compensation slopes were confirmed to realize the stability of resonant cavities within a wider temperature range, they were 0.28 step/℃ for servo motor in the azimuth direction and 0.79 μm/℃ for PZT actuator in the pitch direction respectively.  Conclusions  Thermal stability and compensation of compact dual-path TEA CO2 laser resonant cavities was studied. The heat effect of distributed inner heat sources was studied both in experimental and simulated method. Active heat exchange plan by adopting an axial flow DC fan was adopted to constrain the local heat effect. Hypothesis of the deformation counteract between local heat effect and thermal expansion was proposed and demonstrated. Moreover, the adaptability in wider temperature range was realized by precise angular compensation. Investigation results provided comprehensive view about thermal deformation in compact volume and angular compensation idea would be a reference for similar laser devices.
Frequency stability study of the laser source for iron resonance fluorescence Doppler lidar
Li Cheng, Wu Decheng, Liu Shuang, Deng Qian, Bi Guojiang, Wang Bangxin, Wang Zhenzhu, Liu Dong, Wang Yingjian
2023, 52(10): 20230025. doi: 10.3788/IRLA20230025
[Abstract](144) [FullText HTML] (41) [PDF 2897KB](47)
  Objective   Temperature and wind, as important environmental parameters, characterize the state of the atmosphere. In the region of upper mesosphere and lower thermosphere (UMLT, 75-115 km), due to a lack of effective tools, there is a relative lack of observation data. The resonance fluorescence lidar uses metal atoms in the UMLT region as a neutral tracer, and it is possible to measure temperature and wind by stimulating resonance fluorescence signals of the tracer. Among many in-situ and remote sensing measurement methods, the resonance fluorescence lidar, with its high spatial and temporal resolution, high accuracy and continuous observation, has become a powerful tool. Sodium resonance fluorescence lidar is widely used in the world, while iron resonance fluorescence Doppler lidar (Fe lidar) has the advantage of whole day measurement and is also an effective means to measure temperature and wind profile. The narrow-band, frequency-stabilized laser operating at 372 nm wavelength is one of core technology in the development of Fe lidar, especially for wind measurement. To yield pulsed laser with outstanding characteristic of frequency stabilization, a theoretical and experimental study of the frequency stability of laser sources are presented.  Methods  The technical solution for the generation of pulsed laser is to use Nd: YAG laser to generate pulsed laser at 1 116 nm wavelength, and then convert to 372 nm wavelength through subsequent second and third harmonic generation. Since the performance of oscillator determines the characteristics of the entire laser system, a theoretical and experimental study of the frequency stability mainly focuses on the oscillator. Frequency stability of pulsed laser at 1 116 nm wavelength from the oscillator is simulated to be less than 1 MHz (RMS) by using the Monte Carlo method (Fig.1). A detailed description for the modified Ramp-Fire method is conducted (Fig.2), and this technology is used in the optical path of the oscillator (Fig.3(a)). In the beat frequency experiments, because of the high-frequency stability of seeder laser, it can be used as a frequency reference, and the frequency difference can indirectly reflect the frequency stability of the pulsed laser by beating with the continuous-wave laser output from seeder laser. To record the beat frequency signal accurately, an indium gallium arsenic (InGaAs) detector with 5 GHz bandwidth is used for photoelectric conversion, and the interference waveform is acquired by a high-speed oscilloscope with a sampling rate of 40 GS/s. A fast Fourier transform algorithm is applied to the digitized beat frequency signal to obtain the spectrum information.  Results and Discussions  Frequency stability of 543.24 kHz root mean square over 10 min is obtained by using beat frequency experiments (Fig.5). It is verified that injection-seeded technique combined with the modified Ramp-Fire method can meet the requirements of frequency stability. According to the Monte Carlo method (Fig.1), the systematic error of temperature and wind measurement are estimated to be 0.51 K and 0.61 m/s.  Conclusions   The long-term frequency stability is a prerequisite for the high-precision measurement of temperature and wind. The frequency stability of laser source of Fe lidar is studied in this paper. By Monte Carlo method, the simulation analysis shows that the frequency stability for temperature and wind measurement should be less than 3 MHz at 372 nm wavelength, and thus, it should be less than 1 MHz at 1 116 nm wavelength. In the oscillator, injection-seeded technique combined with modified Ramp-Fire method is applied to maintain resonance with the seeder laser. The frequency stability of pulsed laser output from the oscillator over 10 min was measured to be 543.24 kHz by the beat frequency experiment. This work promotes the practical application of Fe lidar, and it also provides ideas for the development of other lidar systems with frequency stability.
Speech enhancement method of laser microphone based on ResUnet and TFGAN network
Dai Xinxue, Fan Songtao, Zhou Yan
2023, 52(10): 20230051. doi: 10.3788/IRLA20230051
[Abstract](118) [FullText HTML] (37) [PDF 4604KB](37)
  Objective  Laser microphone is a kind of equipment which employs optical Doppler effect to acquire acoustic vibration information (speech). Compared with conventional microphones, laser microphones have the characteristics of extended range, high precision and non-contact. It is capable of collecting distant sound field information in a directional fashion while avoiding interference from the sound field close to the equipment. However, when the laser microphone is used to collect the remote sound field speech information, the quality of the obtained speech is affected by many factors, which leads to the severe decline of the laser speech quality. At present, the research of speech enhancement algorithm for laser microphone speech is relatively preliminary. The traditional single-channel speech enhancement method requires the signal and noise to satisfy the conditions of stationarity or correlation, and its performance is significantly reduced under complex conditions such as low signal-to-noise ratio and non-stationarity noise. The method based on deep neural network can understand the complex mapping relationship between noisy speech and clear speech, and the performance is better than the traditional method. This technique, however, has poor generalizability for laser speech from complex targets in unpreset environments because different targets have different frequency response characteristics. Therefore, in order to increase the quality of far-field speech captured by laser microphones, a laser microphone speech enhancement method based on ResUnet network and TFGAN network is proposed in this paper.   Methods  Using laboratory-made laser microphones, four different types of objects were used in this paper's remote speech acquisition tests (Fig.6). The technique described in this paper is used to process the recorded speech, and it is contrasted with methods for nonlinear function harmonic reconstruction and DNN+ harmonic reconstruction (Fig.9). Finally, objective speech quality assessment (PESQ) and time-domain segmented signal-to-noise ratio (SNRseg) were used to quantitatively evaluate the processed laser speech (Fig.11).   Results and Discussions   Compared with the above two methods, the method proposed in this paper can better suppress the broadband noise and pulse noise and reconstruct the more accurate high-frequency information after the stepwise enhancement processing of the collected laser speech. The laser speech PESQ scores of A4 paper, A4 paper box, corrugated box and PET plastic bottle after this method are 2.126, 1.818, 1.804 and 1.951, respectively increased by 0.129, 0.113, 0.117 and 0.22. The corresponding SNRseg scores were −5.31 dB, −3.36 dB, −5.07 dB and −3.40 dB, which were increased by 1 dB, 6.25 dB, 1.41 dB and 0.17 dB, respectively. The experimental results show that the ResUnet+TFGAN network method proposed in this paper can effectively improve the laser speech quality of the above targets.   Conclusions  In this study, a laser microphone speech enhancement method based on ResUnet and TFGAN network is proposed. Speech pieces are gathered on various targets by self-made laser microphones in the lab, and the proposed method is demonstrated through experiments. The experimental results show that this method can enhance the speech of laser microphone from a variety of objects. Compared with the nonlinear function harmonic reconstruction method and DNN+ harmonic reconstruction method, the advantages of this method are that ResUet and TFGAN networks can respectively realize the clear Mel spectrum prediction and time domain waveform recovery of laser speech, avoiding the high-frequency noise introduced by the harmonic reconstruction method in the reconstruction of speech signal, and at the same time recover the more clear high-frequency information of laser speech. PESQ and SNRseg results demonstrate that using the proposed method results in improved speech quality for the laser microphone. This method extends the application range of laser microphones to a certain extent, and we will further verify and improve this method on objects with more complex materials and shapes.
Bidirectional reflectance distribution function model of rough surface based on backscatter intensity of hyperspectral LiDAR
Tian Wenxin, Chen Yuwei, Tang Lingli, Li Ziyang, Qiu Shi, Wu Haohao, Zhang Huijing, Chen Linsheng, Jiang Changhui, Hu Peilun, Jia Jianxin, Sun Haibin, Wang Yicheng, Hu Yihua
2023, 52(10): 20230108. doi: 10.3788/IRLA20230108
[Abstract](78) [FullText HTML] (39) [PDF 8435KB](46)
  Objective  The traditional LiDAR system operates at a single wavelength, which limits the acquisition of target attribute information. The spectral information captured by laser backscatter intensity is relatively insufficient, and the detection ability of ground object categories is also limited. Hyperspectral LiDAR, on the other hand, is an active remote sensing method that can obtain spectral and spatial information of targets simultaneously. In addition to 3D coordinates, hyperspectral LiDAR also records the backscatter intensity of each point, enabling the detection of the geometric and reflection characteristics of targets. However, the backscatter intensity of the laser is affected by multiple factors during scanning, making it unsuitable for directly reflecting the reflection characteristics of the target surface. One of the most crucial factors is the laser incidence angle. In practical applications, there are few complete Lambertian targets, and the reflection characteristics of the scanned objects are very complex. Moreover, the roughness of the scanned target deviates from the Lambertian model. Therefore, considering the roughness and micro-structure of the target surface, this study proposes a BRDF model for rough surfaces based on the backscatter intensity of hyperspectral LiDAR through the combination of bidirectional reflection distribution function (BRDF) and radar equation.   Methods  This paper proposes a BRDF model based on the Oren-Nayar model for rough surfaces to address the effect of incident angle on the backscatter intensity data of hyperspectral LiDAR. The hyperspectral LiDAR system comprises key components such as a laser transmitting unit, a laser receiving unit, a scanning and control unit. By combining theory with experiments, eight typical rough targets were selected to analyze the relationship between backscatter intensity and incident angle of hyperspectral LiDAR and quantify the effect of surface roughness on intensity. The radiometric correction method for the incident angle effect was studied based on the constructed model.   Results and Discussions   The incident angle of the laser has a significant effect on the backscatter intensity of the original record, and the intensity decreases with the increase of the incident angle. For the white paper sample, the curve of the backscatter intensity of 21 wavelengths with the incident angle shows a trend similar to the cosine function. However, the changing trend of other samples deviates from the Lambertian model to varying degrees. After radiometric correction based on the constructed model, the standard deviation of reflectance at different angles was no more than 0.06, and the average improvement rate of the standard deviation was 67.86% compared to before correction. The proposed model exhibited higher correction accuracy than the Lambertian model. The results show that the proposed method successfully eliminates the influence of the incident angle of hyperspectral LiDAR.   Conclusions  In this study, we analyze the relationship between the backscatter intensity of hyperspectral LiDAR and the incident angle for rough surfaces. We construct a BRDF model that considers target roughness by combining the Oren-Nayar model with the radar equation. By quantitatively calculating the standard deviation of the slope of the rough surface, we establish an accurate radiometric correction model. This correction model enables us to effectively eliminate the impact of incident angles on reflectance. We selected eight typical rough samples for experiments and obtained experimental results at different incident angles. These results show that the backscatter intensity of the hyperspectral LiDAR does not completely follow the Lambertian model, especially for targets with large roughness. The larger the standard deviation of the slope is, the more the backscatter intensity deviates from the Lambertian model. The proposed correction model offers higher accuracy compared to the Lambertian model. The maximum improvement rate of the sample in the experiment is 80.95%, and the average improvement rate for all samples is 67.86%. Our study opens up new prospects for improving the accuracy of point cloud segmentation and classification based on the hyperspectral LiDAR. The quantitative calculation of roughness also provides new ideas for feature extraction of point clouds. This proposed method offers an effective solution for the radiometric correction of incident angle effects of hyperspectral LiDAR and provides a good physical basis for data analysis and application.
Research and application of picosecond accuracy time delay calibration for satellite laser ranging system
Lin Haisheng, Wu Zhibo, Zheng Min, Long Mingliang, Geng Renfang, Yu Rongzong, Zhang Zhongping
2023, 52(10): 20230070. doi: 10.3788/IRLA20230070
[Abstract](105) [FullText HTML] (32) [PDF 1900KB](49)
  Objective  Satellite laser ranging (SLR) is a highly accurate space geodesy technology that uses short pulse lasers, optical receivers, onboard reflectors, and event timers to measure the distance between a satellite and the ground, with a measurement accuracy of up to sub-centimeter level. It is widely used in various scientific studies, including the precise geocentric position and motion of ground stations, satellite orbits, Earth's gravity field components and their temporal variations, and Earth's directional parameters. The SLR system calibrates its delay by measuring a ground target at a known distance, which enables calibration accuracy to reach millimeter level. This calibration method is currently used in most SLR stations. With the development of SLR technology, new applications have emerged, such as one-way laser ranging, laser time transfer, interplanetary laser ranging, and multi-station collaborative laser ranging. These applications require accurate one-way delay calibration of the SLR system, which is difficult to obtain by measuring ground targets, limiting the development of these applications. To meet the requirements of laser time transfer at the Chinese Space Station (CSS) and carry out high-precision system transmission and reception delay calibration research, this article focuses on calibrating the one-way delay of the SLR system.   Methods  This paper presents a high-precision method for measuring the transmission and reception delay of SLR. Firstly, the composition delay of the SLR system was comprehensively analyzed, which includes the optical delay generated during laser propagation, the photoelectric conversion delay during photon detection, and the electrical delay of transmitting electrical signals (Fig.1). Secondly, various time delays were measured, such as electrical, optical, and optoelectronic conversion at the Shanghai Astronomical Observatory (SHAO). For this purpose, an event timer A033 with a measurement accuracy of 3 ps, a dead time of 50 ns, a signal generator ETTG-100 with an accuracy of 4 ps, a laser with a 532 nm wavelength, 2 kHz repetition rate, and energy fluctuation of less than 3%, as well as adapters and signal converters are used. And a high measurement accuracy of these delays was achieved, reaching the picosecond level. Finally, the time delay of each segment is combined to calibrate the transmission delay (Fig.4), reception time delay (Fig.5), and ground target distance of the SLR system.   Results and Discussions   The SLR system of SHAO was used as an experimental platform to measure time delays. The cable delay was measured at (107 100 ± 2) ps, the delay of the optical path from the 45° mirror of the transmitting cylinder to the fixed target was measured at (8 563 ± 2) ps, and the delay of the linear detector was measured at (13 444 ± 8) ps. The accuracy of these measurements was at the picosecond level, which meets the required standards. Using these measurement results, the transmission and reception delay were calibrated with calibration results of −4 698 ps and 192 269 ps, respectively. The calibration accuracy was better than 11 ps and 13 ps (Tab.5). This calibration method was then applied to verify the ground target distance deviation, and the difference between the calibration results and the feedback value from the International Laser Ranging Organization was only 11 ps.   Conclusions  In this paper, a novel method for accurately measuring the transmission and reception delay of the satellite laser ranging system is presented. This method is crucial in meeting the requirements of the laser time comparison task at CSS. The method comprehensively considers the delay of the signal transmission cable, optical path, lens, and linear detector, resulting in picosecond calibration of their delay. The calibration of the transmission and reception delay of the SLR system at SHAO was achieved with calibration errors of less than 11 ps and 13 ps, respectively. This method can reduce the systematic deviation of observation stations when applied to the calibration of fixed ground target distance deviation. Moreover, it provides technical support for laser time comparison engineering and a reference for improving the quality of the SLR data.
Design and implementation of real-time laser power monitoring system in laser ranging
Wu Fan, Zhai Dongsheng, Li Zhulian, Tang Rufeng, Pi Xiaoyu, Li Yuqiang
2023, 52(10): 20230109. doi: 10.3788/IRLA20230109
[Abstract](105) [FullText HTML] (28) [PDF 1540KB](57)
  Objective  In laser ranging processes, Single-Photon Avalanche Diode (SPAD) is commonly used as a detector. However, this type of detector exhibits a time-walk effect, where different input energies result in different photon detection times. In such cases, it is necessary to monitor the laser power in real-time to analyze the variations in laser energy and the impact of the detector itself on ranging accuracy. Furthermore, due to the complexity of satellite laser ranging systems, troubleshooting typically requires a significant amount of time. Real-time monitoring of laser power allows for quick identification and troubleshooting of laser transmitter energy, reducing the time required for identifying system faults. Therefore, obtaining real-time laser emission power data serves as a crucial basis for subsequent analysis of data accuracy and troubleshooting of laser ranging system faults.  Methods  To address the limitations of traditional real-time laser power monitoring techniques, such as laser energy attenuation, susceptibility to introducing optical axis deviation, and difficulties in practical application, a real-time laser power monitoring method is proposed for laser ranging systems. Here is the method: Before ranging, insert laser power meter II into the optical path and adjust the laser diode current to obtain multiple sets of different laser emission powers. Use laser power meters I and II to measure the transmitted light and reflected light from the reflector respectively, establishing the corresponding relationship between transmitted and reflected light (Fig.4). During ranging, remove laser power meter II from the optical path, and laser power meter I continuously measures the transmitted light from the reflector in the laser emission path (Fig.3). Utilize the previously established corresponding relationship between transmitted and reflected light to obtain real-time reflected light power through relative measurement. This achieves the effect of real-time monitoring of laser emission power. Validate the method by constructing an experimental platform based on the 53 cm dual-tube telescope at Yunnan Observatory.   Results and Discussions   By adjusting the laser diode current to change the laser power, multiple sets of data for the transmitted laser power and reflected laser power were measured. The data was then used to perform a linear fit using the least squares method. The significance of the regression equation was evaluated using the F-test, yielding an F-value of 3 171.039 5. Consulting the F-distribution table revealed that the regression was highly significant, indicating a strong linear relationship between the reflected and transmitted laser powers. The residual standard deviation (σ) of the regression equation was found to be 0.007 3. The maximum deviation between the measured values of reflected laser power and the fitted results was 1.49% of the current measurement, demonstrating that the regression line accuracy meets the requirements for laser ranging (Fig.5). The proposed method was subjected to intermittent measurements over a duration of 7 hours. The F-value obtained from the F-test was 1057.7779, which means the regression was still highly significant. The residual standard deviation (σ) was calculated to be 0.0165, and the maximum deviation value of the reflected laser power measurement from the fitted result is 3.75% of the current measurement value. This meets the accuracy requirements, demonstrating that the proposed method can maintain long-term stability and fulfill the needs of long-time satellite laser ranging (Fig.6).  Conclusions  The experimental results indicate that the proposed method of real-time laser power monitoring can accurately obtain the laser emission power without loss in the laser emission path. The reflected laser power and transmitted laser power exhibit a strong linear relationship, with a Spearman correlation coefficient of 0.999 1. This linear relationship remains stable and reliable during long-duration laser ranging experiments. The feasibility of this method has been verified, meeting the power measurement requirements for laser ranging of various spatial targets. Therefore, this method can be applied to the real-time monitoring of laser power for various spatial objects laser ranging.
A dynamic range compression method for coaxial warning LiDAR based on overlap factor
Liu Jing, Jin Weiqi, Que Kailiang
2023, 52(10): 20230027. doi: 10.3788/IRLA20230027
[Abstract](87) [FullText HTML] (22) [PDF 1920KB](37)
  Objective  The warning LiDAR used in industries such as autonomous driving and smart mining obtains target distance and alerts by threshold detection of echo. When an warning LiDAR works in an adverse environment (fog, dust, etc.), the emitted laser pulse will be scattered when it hits water drops or dust. Backscattered light will form backscattering echo, and forwardscattered light will be reflected when encountering an object to form a target reflection echo. Backscattering echo will interfere with the detection of target reflection echo. Therefore, backscattering echo compression is essential for the warning LiDAR.   Methods  For the detection of surface targets, the intensity of the LiDAR echo is inversely proportional to the square of the distance, resulting in the intensity of the near-distance echo being several orders of magnitude greater than the intensity of the far-distance echo. Because the optical path of the backscattering echo is shorter than that of the target reflection, the backscattering echo is in front of the target reflection echo. The optical and mechanical structure of the LiDAR transmission module obstructing the receiving field of view can affect the near-distance responsibility, resulting in the echo strength not monotonically decreasing with distance, but first increasing and then decreasing with distance. By reverse utilizing this attribute, we can model the LiDAR echo based on the optical and mechanical structural parameters (overlap factor) to achieve near-distance echo compression, thereby compressing backscattering echo in adverse environments (fog, dust, etc.) without affecting target reflection echo, and thus reducing false alarm rate. A dynamic range compression method for coaxial warning LiDAR based on overlap factor is proposed utilizing the influence of coaxial occlusion and non-uniformity of laser spot energy distribution on overlap factor (Fig.4-7).   Results and Discussions   LiDAR with parameters in Tab.1 is used to measure response curve and parameters in Tab.1 is used to get simulated response curve. Table 2 presents datas of the measured normalized response curves, simulated normalized response curves, and overlap factors. The response curve plotted according to Tab.2 is shown (Fig.10). Comparative analysis of measured data and simulation data is conducted. The measured data showed a peak echo intensity at 1 096 mm and decreased to both sides; The echo intensity of the simulated data before correction monotonically decreases with the target distance and does not match the measured data; The simulated data after correction showed a peak echo intensity at 895 mm, which was closer to the measured peak position of 1 096 mm. Moreover, the corrected echo intensity decreased towards both sides of the peak and showed a similar trend to the measured data. Considering the influence of factors such as processing and adjustment errors in the manufacturing process of LiDAR, the actual peak position should be slightly larger than the predicted 895 mm by the modified model, which is closer to the measured 1 096 mm. The Pearson correlation coefficient between the corrected simulation data and the measured data is 0.908 5, indicating a strong correlation between the simulation response curve and the measured response curve, effectively proving the effectiveness of the model built in this paper. Based on the above conclusions, simulation analysis is conducted to investigate the effects of four parameters on the response curve, which are the radius of the transmitting lens d, the radius of the aperture R, the divergence angle of the laser 2t, and the focal length of the receiving lens f. The simulation results show that an increase in the radius d of the transmitting lens, a decrease in the laser divergence angle 2t, or an increase in the focal length f of the receiving lens can slightly compress the dynamic range of the response curve, but not significantly; Increasing the aperture radius R can significantly compress the dynamic range of the response curve.   Conclusions  Therefore, in the optical and mechanical design stage of LiDAR, it is possible to effectively compress the response at near distance relative to far distance by increasing the aperture radius of the warning LiDAR, thereby achieving compression of the backscattering echo relative to the target reflection echo to reduce the impact of adverse weather conditions on warning LiDAR. This model has been used to guide the optimization of existing warning LiDAR products, especially for the optimization design of warning LiDAR applications in adverse weather environments such as autonomous driving and smart mining. It has important practical guidance significance and broad application prospects.