2023 Vol. 52, No. 12

Image processing
Construction and development of LSS target prevention and control system
Li Liya, He Song, Zhao Zhu, Song Ya, Cai Rong, Zhang Changmeng, Fan Ruifeng, Yu Dongyi
2023, 52(12): 20230034. doi: 10.3788/IRLA20230034
[Abstract](230) [FullText HTML] (28) [PDF 2031KB](64)
  Significance   In recent years, there has been a significant proliferation of "low-slow-small" targets (LSS) represented by unmanned aerial vehicles (UAVs), which are extensively utilized in industries such as film and television aerial photography, low-altitude logistics, security monitoring, and aerial surveying. However, owing to their easily accessible, controllable and concealable characteristics, micro-drones are susceptible to exploitation by hostile forces for illegal activities like reconnaissance and sabotage that pose serious risks to confidentiality and security for both military and civilian sectors. Furthermore, the LSS represented by UAVs have demonstrated their substantial combat capabilities in modern warfare while representing the development trend of future information warfare. However, existing defense systems and operational equipment continue to confront numerous technological challenges pertaining to effective detection and discovery mechanisms, intelligent information fusion techniques, reliable defense and interception capabilities, as well as system platform integration issues. In practical applications though, problems such as varying degrees of standardization across different contexts exist alongside inadequate operational capabilities under complex environmental conditions and unreliable regular usage.   Progress   Firstly, based on the analysis of the characteristics associated with LSS, a fundamental approach for detection and disposal is proposed. In terms of detection requirements, it is essential to design systems that address three specific characteristics of low-altitude/ultra-low-altitude flights, slow speeds, and weak infrared radiation characteristics/small radar cross-sections. Regarding disposal strategies, effective communication interference should be implemented based on the target's data link traits and navigation methods. Additionally, the physical attributes of LSS should guide the design of interception and destructive measures.   Subsequently, this study addresses the development of a robust target defense and control system architecture with emphasis on LSS. Operational procedures are also designed to ensure efficient execution. During operations, the detection system provides real-time target information including position, motion characteristics, electromagnetic spectrum data, and other relevant details for multiple targets within the defense zone through multimodal information fusion. This enables the creation of a comprehensive situational awareness map for effective defense and control. Target classification and identification are performed using advanced feature extraction and classification methods. The command system then prioritizes target threats based on three-dimensional situational analysis in conjunction with current contextual information to issue appropriate disposal orders according to allocation principles. Finally, selected disposal methods are implemented to effectively address the identified targets while completing the operational loop of OODA (observe, orient, decide, act).   Lastly, this paper proposes the key trends in the development of LSS defense and control. The construction of such systems requires addressing key issues and implementing development strategies including standardization, normalization, and cost-effectiveness.   Conclusions and Prospects  Among these strategies, optical detection emerges as a significant passive method with promising application prospects for future low-altitude detection tasks focused on urban warfare. It offers advantages such as all-weather capability, visualization, high precision, and strong anti-jamming capabilities to overcome challenges related to target discovery and identification. The increasingly complex battlefield environment and evolving advanced operational modes like UAV swarms impose new technological requirements on optical detection. On one hand, integrating optical detection into early warning systems can leverage its advantages through comprehensive coordination of airspace management, platform deployment optimization, spectrum utilization efficiency enhancement, and information perception improvement to enhance overall operational efficiency. On the other hand, optical detection should address the challenges associated with large field-of-view coverage, detection at high resolutions, multi-target tracking, and positioning capabilities while also enhancing intelligent identification performance. It should also expand optical information perception dimensions, such as polarization analysis and multispectral imaging, to provide robust support in addressing low-altitude detection challenges.   As drone technology continues to advance, the defense and control of LSS represented by drones emerge as crucial areas and technical challenges in the future development of low-altitude defense. The consensus is to develop an integrated defense and control system that encompasses agile command, composite detection, and multimodal disposal. However, due to the unique characteristics of LSS and their diverse operational scenarios, existing technological means are insufficient in fundamentally addressing the issues related to detection and disposal. Therefore, it is imperative to gradually enhance the construction of the LSS defense and control system through continuous testing and utilization while summarizing relevant experiences. This iterative process will provide valuable feedback for optimizing the existing defense mechanisms in order to effectively safeguard LSS.
Deep learning-based impact mitigation method for UWB NLOS propagation
Liu Wanqing, Wei Guo, Gao Chunfeng, Yu Xudong, Tan Zhongqi, Zhang Chengzhong, Hou Chengzhi, Zhu Xu
2023, 52(12): 20230183. doi: 10.3788/IRLA20230183
[Abstract](75) [FullText HTML] (25) [PDF 1766KB](21)
  Objective  With the continuous development of intelligent technologies and devices, precise positioning technology in the military field is becoming increasingly widespread, and its application scenarios cover both outdoor and indoor environments. Global Navigation Satellite System (GNSS) positioning technology is commonly used for its high positioning accuracy and rich information provision in outdoor environments; However, its positioning accuracy in indoor environments is significantly reduced due to the obstruction of walls and other obstacles. Ultra-Wideband (UWB) technology shows obvious advantages with its high positioning accuracy, firm spatial and temporal resolution, fast transmission rate, and low cost. These advantages make UWB technology particularly suitable for indoor high-precision positioning. In the indoor environment, various obstacles block the propagation channel between the base station and the tag of the UWB system, due to the Non-Line-Of-Sight (NLOS) phenomenon of UWB signals, the positioning accuracy of UWB systems is significantly reduced. Therefore, it is necessary to research the impact mitigation method for UWB NLOS propagation.   Methods  A deep neural network based on deep learning techniques is proposed for UWB NLOS propagation impact mitigation. This deep neural network takes the initial channel impulse response (CIR) of the UWB device as input and the ranging error of the UWB device as output. The experimental analysis shows that the characteristics of CIR data are significantly different under LOS and NLOS propagation conditions (Fig.7), which provides a solid theoretical basis for establishing the mapping relationship between CIR and ranging error using deep learning methods. Meanwhile, the network performance is related to the dimensionality of the input CIR data. The network performance is best when the input CIR data is 128 dimensions (Fig.8). When the input of the deep neural network is 128-dimensional data, too long input will lead to the structural design of the network becoming difficult. And the number of network layers is too small, the network performance can not meet the requirements to achieve good NLOS propagation impact mitigation effect; After the number of network layers increases to a certain degree, the network performance will decrease with the increase of the number of layers. For this reason, the ResNet network is selected in this paper, which enables the gradient to flow effectively to the early layers near the input layer by introducing residual connections in the deep neural network, thus improving the network performance with the increase of layers. At the same time, CIR data, as a time-series signal, correlates its data points. The global features of CIR data must be considered, while local module such as convolution can only extract local features. For this reason, this paper introduces the Non-local module, which can capture the long-distance dependence between locations and extract global information. In summary, the proposed deep neural network is constructed by inserting the Non-local module into the ResNet network's basic module while considering the CIR data's features, and named the deep neural network as NLO-ResNet.   Results and Discussions   In order to evaluate the NLOS propagation impact mitigation performance of the proposed deep neural network, four networks were selected for performance comparison. Four networks include two machine learning-based networks, SVM and MLP, and two deep learning-based networks, CNN and ResNet. Experimental results (Tab.1) show that, due to the increase in the number of layers of the network and the change in the input data, the performance of the deep learning-based network is generally better than that of the machine learning-based network; Among the deep learning-based networks, the CNN network has the worst performance, the ResNet network improves with the increase of the number of layers due to the introduction of residual connections, and the NLO-ResNet network has the best performance, which has the most comprehensive feature extraction of the input CIR data. The mean absolute error (MAE) is reduced by 12.2% compared to the CNN-based network and 4.8% compared to the ResNet-based network, and the learning process of this network converges quickly (Fig.10), and the predicted range error of this network is very close to the actual range error (Fig.11).   Conclusions  To improve the accuracy of UWB systems under NLOS propagation conditions, a deep learning-based NLOS propagation impact mitigation method is proposed, which constitutes a deep neural network by inserting a Non-local module into the basic module of the ResNet network. The method can reduce the MAE of the original data from 0.1242 m to 0.0681 m. The research provides technical support for indoor high-precision positioning in the military field. The related results can be applied in the autonomous takeoff and landing of military UAVs, and indoor positioning of military robots.
Nonlinear optics
Two- and three-photon absorption of the ferrocene derivative containing fluorene based on the quantum impedance Lorentz oscillator
Wang Xiaofeng, Liu Meng, Yu Yu, Wang Yulei, Zhang Yong, Xia Yuanqin, Zhao Peide
2023, 52(12): 20230410. doi: 10.3788/IRLA20230410
[Abstract](39) [FullText HTML] (19) [PDF 1574KB](13)
  Objective  In view of the wide application of nonlinear optical materials in the field of modern optics and optoelectronic information, the search for high-performance nonlinear optical materials is a common concern. In particular, an important content of nonlinear optical effect and its application is partly to develop characterization techniques and measurements of material nonlinear coefficients. In the past few decades, many new materials have been synthesized to get larger and larger molecular multi-photon-absorption cross-section through new characterization techniques. The common methods of the nonlinear optical measurement include degenerate four-wave mixing, nonlinear transmittance, Z-scanning technique, etc. In a multi-photon-absorption experiment, many factors such as the stability of excitation pulse laser with high light intensity (MW·cm-2, GW·cm-2, or higher), high accuracy of measuring equipment, and the suitable sample would lead to the increase of the experimental cost, difficulty and complexity. So, it may be a good effort to find a predictable method to estimate two- and three-photon-absorption behaviors according to the linear absorption spectrum. As far as we know, the quantum impedance Lorentz oscillator (QILO) model just has, to some extent, the predictive ability upon the linear absorptive behavior of medium.   Methods  QILO model was recently established and proposed, in which the classical Lorentz oscillator had been quantized via Bohr-Sommerfeld quantum theory and 1- and 2-photon-absorption selection rules of quantum mechanics. QILO's parameters including the linear or nonlinear param, the damping coefficient, and the oscillator strength have been expressed in terms of the typical quantum physical quantity, such as effective quantum number, Bohr radius, and the ground state energy of hydrogen atom. On the basis of QILO model, the reference formulae for calculating the fourth- and fifth-order nonlinear effect parameters of the oscillator are further derived theoretically and expressed in terms of effective quantum number, electronic charge and mass, and Bohr radius. Then, the single-, two-, and three-photon-absorption properties of the ferrocene derivative containing fluorene are investigated in detail. By fitting the linear absorption spectrum of the studied material, the effective quantum number before and after the electronic transition near the linear absorption peak of 400 nm wavelength is calculated by use of QILO model. As a prediction, the molecular two- and three-photon-absorption cross-sections of the same material are numerically calculated. The prediction results are compared with the experimental data in the literature.   Results and Discussions   The 1-, 2-, and 3-photon-absorption properties of ferrocene derivative containing fluorene with R=NO2 substituent are investigated using QILO model. The obtained major results are indicated in the fitting diagram of the linear absorption spectrum of the molecule (Fig.2(b)), the fitting diagram of the two-photon-absorption (2PA) cross-section (Fig.2(c)), and the curve of the three-photon-absorption (3PA) cross-section with the wavelength change (Fig.2(d)). The results of the theoretical numerical curves show that the 2PA cross-section of the compound molecule near 793 nm are about $0.49\times {10}^{-20}\;{\mathrm{c}\mathrm{m}}^{4}\cdot{\mathrm{G}\mathrm{W}}^{-1}$, and the 3PA cross-sections near 1 260 nm and 1 314 nm are $2.01\times {10}^{-25}\;{\mathrm{c}\mathrm{m}}^{6}\cdot{\mathrm{G}\mathrm{W}}^{-2}$ and $1.00\times {10}^{-25}\;{\mathrm{c}\mathrm{m}}^{6}\cdot{\mathrm{G}\mathrm{W}}^{-2}$, respectively. These values are in good agreement with the experimental ones. Additionally, the 2PA and 3PA processes of ferrocene derivatives containing fluorene with R=NO2 substituent, based on QILO model, are taken as an example to discuss how to separate the 3PA process and ignore the 2PA effect under high light intensity in detail.   Conclusions  QILO model can describe well the single-, two-, and three-photon-absorption properties of the ferrocene derivatives containing NO2 as substituent. In the light of the QILO's characteristic that multi-photon-absorption cross-section can be estimated according to the linear absorption spectrum of the medium, QILO model may provide us a theoretical analysis method for finding the materials with large two- and three-photon-absorption cross-sections so as to reduce the comprehensive experimental cost in studying multi-photon processes. The model can also be extended to other nonlinear optical processes. The QILO model exhibits itself an advantage of its great reduction of the calculation complexity and high cost confronting the first principle in dealing with both linear and nonlinear properties of optoelectronic materials as well.
Nonlinear dynamic modeling of fiber optics driven by physics-informed neural network
Luo Xiao, Zhang Min, Jiang Xiaotian, Song Yuchen, Zhang Ximeng, Wang Danshi
2023, 52(12): 20230188. doi: 10.3788/IRLA20230188
[Abstract](147) [FullText HTML] (63) [PDF 4975KB](47)
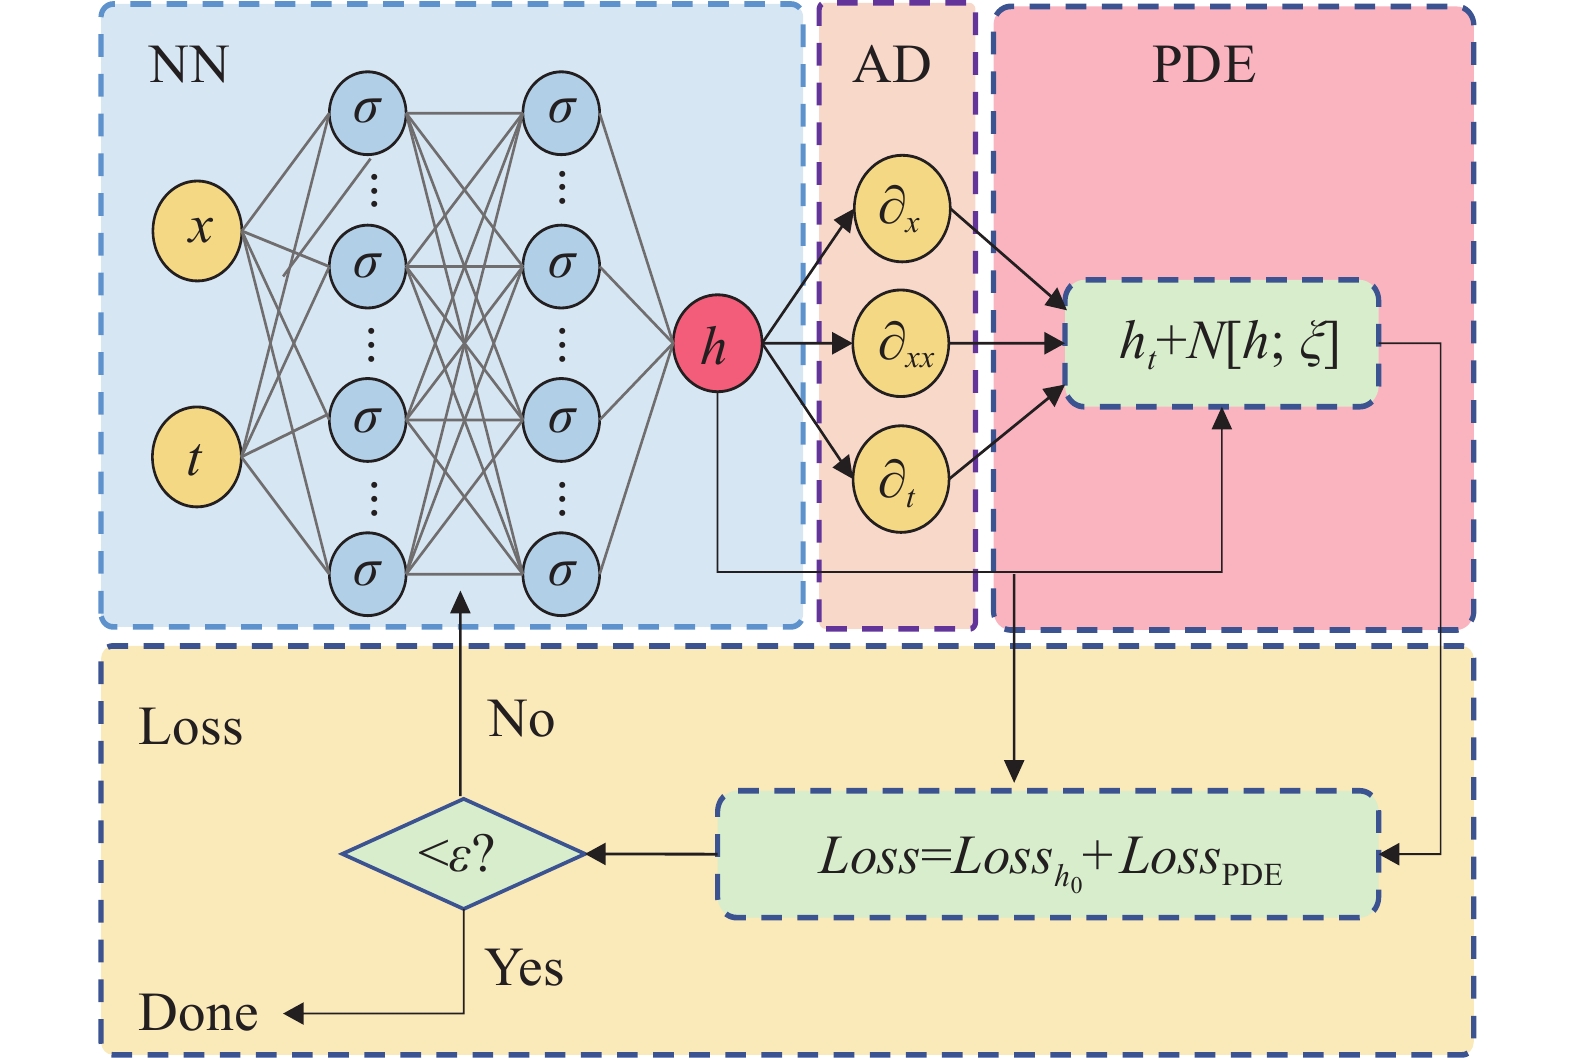
  Objective  In the field of nonlinear dynamic of fiber optics, various fiber optic effects can be mathematically described by differential equations such as the nonlinear Schrödinger equation (NLSE) that describes the evolution of optical signals due to many physical effects such as loss, dispersion and nonlinearity; Stimulated Raman scattering (SRS) ordinary differential equation describes the power evolution caused by stimulated Raman scattering; And the paraxial Helmholtz equation (PHE) describes the distribution and propagation of optical mode fields in fibers with various geometric structures. For a long time in the past, differential equations, including these three equations, were solved using numerical methods, most of which are based on the idea of difference and microelement, and discretize the computational domain and then obtain the approximate solution of the differential equation through iteration, such as finite difference method (FDM), finite-difference time-domain method (FDTD), finite element method (FEM), spectral method (SM), etc. However, the main problems faced by numerical methods are as follows. In complex scenes (such as high nonlinearity, large scale, high dimension, etc.), in order to obtain stable and accurate results, it is necessary to divide the grid more precisely, and the number of iterations is proportional to the scale of the desired scene. As the complexity of the scene increases, the amount of computation increases Exponential growth, which consumes a lot of computing resources and computing time; The computational resources and time consumed by numerical methods are unbearable, and there is currently no reasonable solution to these problems. Therefore, it is necessary to introduce a new equation solving tool with the properties of efficiency and low complexity to avoid the difficulties faced by numerical methods to meet the needs of accurate modeling of the dynamic process of interest physical quantity in complex scene. In recent years, in the field of computational physics, a revolutionary scheme for directly solving differential equations using neural networks, the physics-informed neural network (PINN), was proposed, which has attracted widespread attention and has been successfully validated in various fields related to differential equations. For the purpose of accurate modeling of nonlinear dynamic of fiber optics, PINNs were employed to solve NLSE, SRS ordinary differential equation and PHE to preliminarily verify PINN's feasibility in the field of fiber optics in this paper.   Methods  The principle of PINN is firstly elucidated in this paper (Fig.1). Since PINN is real-valued, while the NLSE and PHE are actually complex equations. Thus, when solving these two equations by PINN, it is necessary to first separate the real and imaginary parts of the equation to obtain the real and imaginary part equations (Eq.5, Eq.8, Fig.5). The loss function of SRS ODE is reformed in the form of a matrix due to the coupling effect between different channels (Fig.3). Taking mean square error as accuracy evaluator, the results of NLSE, SRS ODE and PHE obtained by PINN are respectively compared with that of split-step Fourier method (SSFM), multi-step per span (MSPS) method and finite difference beam propagation method (FD-BPM) (Fig.2, Fig.4, Fig.6-8) to verify the feasibility of PINN for the modelling of nonlinear dynamic of fiber optics. Additionally, the computational complexity and running time of PINN and numerical method is quantitatively analyzed (Fig.9).   Results and Discussions   The feasibility of PINN for solving NLSE is verified in the scenario that considers the effects of group velocity dispersion (GVD), self-phase modulation (SPM) and third order dispersion (TOD) with multiple input signals such as Gaussian pulse, first-order soliton and second-order soliton in the transmission distance of 80 km (Fig.2). The verification scenario of SRS ODE is set to the C+L-band transmission system of a transmission bandwidth from 186.1 THz to 196.1 THz, a channel bandwidth of 100 GHz, and a protection interval of 600 GHz between C and L bands, which has a total of 96 channels under full load (Fig.4). The PHE is solved respectively in step-index fiber in the geometry of straight, bended and tapered with five lowest linear polarization modes employed as fiber inputs (Fig.6-8). The above validation schemes all achieved accuracy results compared to those of numerical methods with low computational complexity and running time (Fig.9).   Conclusions  As a revolutionary differential equation solving scheme, PINNs are introduced to the modelling of the nonlinear dynamic of fiber optics in this paper. The feasibility of PINN is verified in three typical nonlinear scenarios by solving the NLSE, the SRS ODE and the PHE. At present, the scientific computing community driven by artificial intelligence is gradually improving. Artificial intelligence algorithms that introduce physical information may provide a new idea, method, and tool for nonlinear dynamic modelling of fiber optics in the future, which may fundamentally provide a reliable technique for various fields including modeling of nonlinear dynamic of fiber optics in scientific computing, design, modeling, and other aspects.
Infrared technology and application
Analysis of the influence of aerodynamic heating in ascent stage on infrared radiation characteristics of high-speed aircraft in midcourse
Shi Weibo, Sun Haihao, Liu Chunsheng, Liang Shichang, Shi Anhua
2023, 52(12): 20230260. doi: 10.3788/IRLA20230260
[Abstract](96) [FullText HTML] (14) [PDF 2293KB](34)
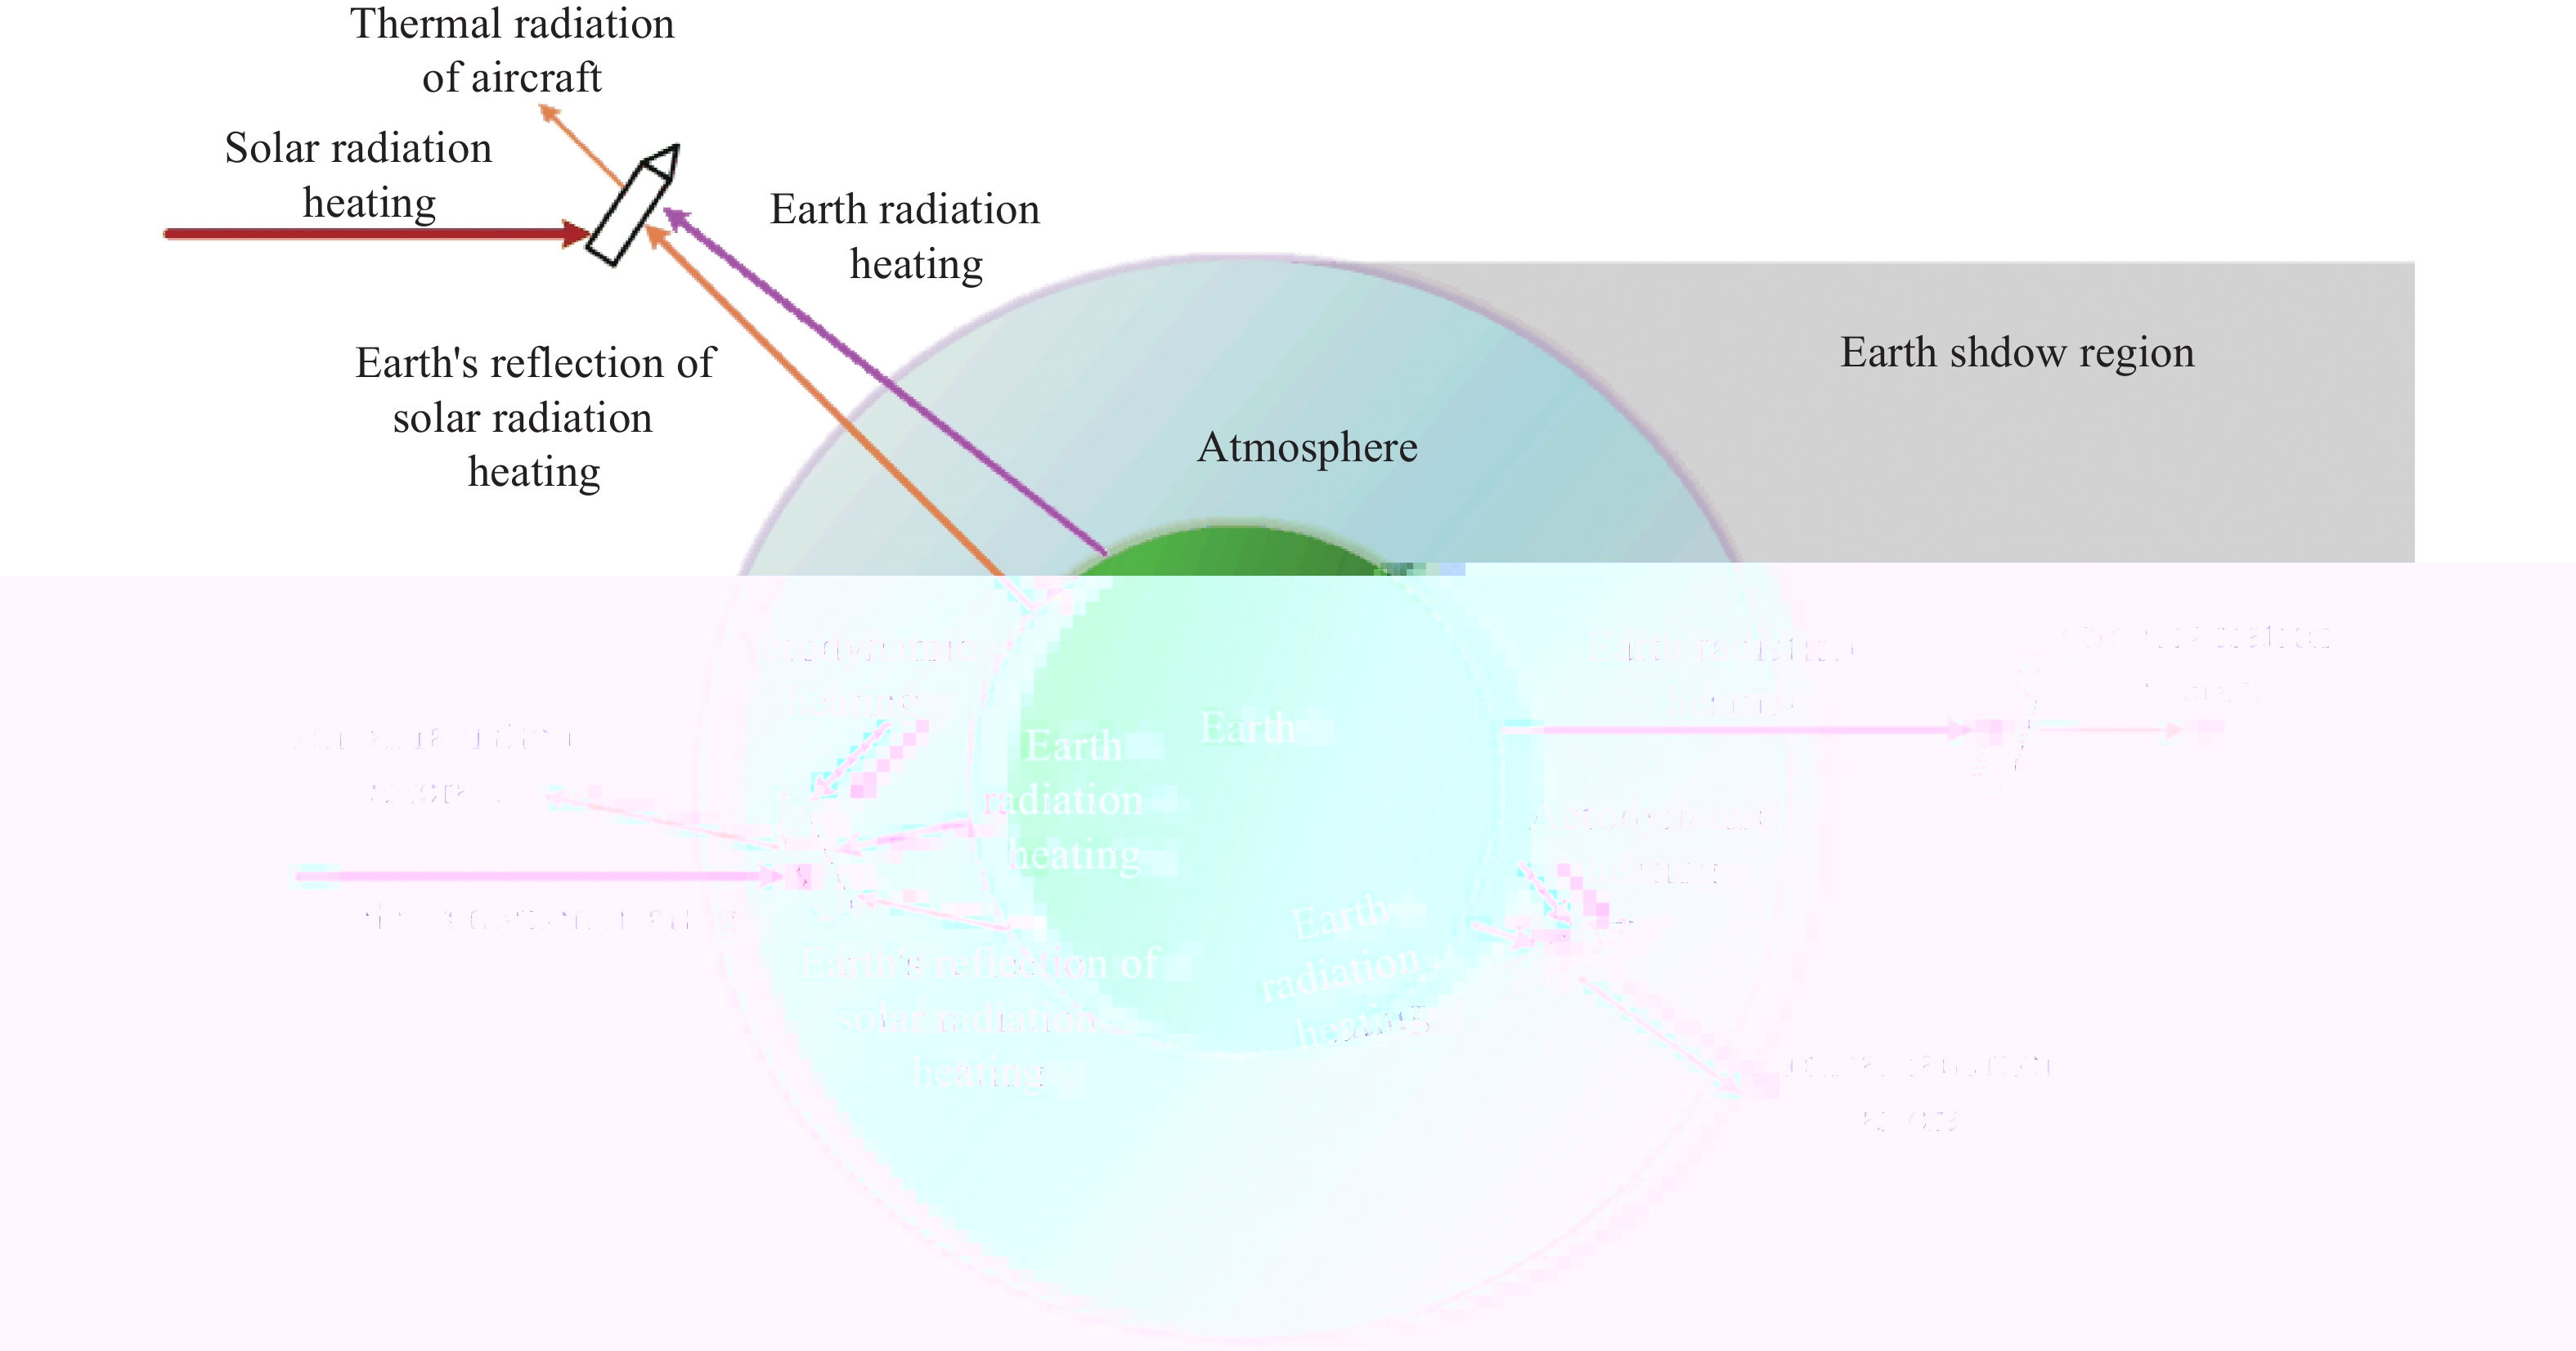
  Objective  Infrared radiation characteristics is the basis of midcourse infrared warning, detection, identification and track of high-speed aircraft. High-speed aircraft midcourse infrared radiation is closely related to surface temperature, which is related to ascent-stage aero-heating, space thermal radiation, heat-shield structure, and so on. In order to obtain high-speed aircraft’s midcourse infrared radiation in the complex environment background, it is necessary to study the influence of aero-heating, space thermal radiation, surface heat-shield radiating and structure heat conduction on the infrared radiation.   Methods  Taking into account the influence of ascent-stage aero-heating, space thermal radiation, surface heat-shield radiating and structure heat conduction, making use of aerodynamic heating engineering computation model, space thermal heating computation model, and 1D multi-layer heat conduction computation method, the high-speed aircraft infrared radiation analysis technology is established, and high-speed aircraft midcourse temperature field and infrared radiation analysis is realized under the influence of aero-heating, space radiation heating, radiation heat dissipation, structure heat conduction, and so on.   Results and Discussions   The computation temperature results match well with flight test results under typical working conditions (Fig.4-5), which verifies the validity of the computation model and methods. The ascent-stage aero-heating has a large effect on the midcourse surface temperature and infrared radiation (Fig.7-10). In the midcourse, the infrared radiation intensity in the wavelength range of 8-12 μm is notably larger than that of 3-5 μm. Therefore, choosing the wavelength range of 8-12 μm is more advantageous for high-speed aircraft midcourse detection (Fig.11).   Conclusions  In order to simulate the infrared radiation of the high-speed aircraft in midcourse flight, the temperature field and infrared radiation characteristics analysis technology is developed, considering the influence of ascent-stage aero-heating and so on. The technology is validated through comparison with flight test measurements. It is found that: the ascent-stage aero-heating has a large effect on the midcourse infrared radiation. In the midcourse, the infrared radiation intensity in the wavelength range of 8-12 μm is notably larger than that of 3-5 μm. Therefore, choosing the wavelength range of 8-12 μm is more advantageous for high-speed aircraft midcourse detection.
Study of low-power readout circuit based on a programmable windowing IP core
Wang Hongyi, Tao Wengang, Lu Yifan, Zhang Yonggang, Huang Songlei, Fang Jiaxiong
2023, 52(12): 20230241. doi: 10.3788/IRLA20230241
[Abstract](73) [FullText HTML] (22) [PDF 3502KB](27)
  Objective  Infrared focal plane detectors are moving towards larger scale, higher frame rates, and higher levels of integration. In application scenarios such as high-speed target tracking and detection and region of interest imaging, the difficulty of high power consumption faced at high-speed readout needs to be addressed. As the spatial resolution of the infrared focal plane detectors has gradually increased to today's millions and even tens of millions of pixels, the size of the infrared focal plane arrays (IRFPA) has grown, and the need for high frame rate readout and random windowing has become increasingly urgent. At the same time, the increase in scale has also brought about a continuous increase in circuit power consumption, and the circuits that achieve these functions are becoming increasingly complex. The traditional design of digital readout integrated circuit (ROIC) modules from the transistor level is becoming increasingly difficult. Random windowing is an effective way to increase the IRFPA ROIC frame rate and enable the readout of regions of interest. As the need for increasingly complex IR detector customisation grows, the typical architecture of existing ROIC implemented at the chip level for random windowing has many limitations, such as long design cycles for customisation, poor scalability of different-sized arrays and the difficulty of achieving small cell sizes in terms of the occupied pixel area.   Methods  For large-format IRFPA high frame rate applications, this paper proposes a programmable windowing IP core design (Fig.7) based on the digital IC design flow implementation and achieves ultra-low power optimisation of the 640×512 readout circuit column module by using a column-level time-selection technology (Fig.5). The pixel cell circuit contains a CTIA input stage, a double sample-and-hold structure and a follow output structure (Fig.3), that compromises the optimisation of area, noise, gain, etc. A low-noise, high-speed programmable arbitrary windowing 640×512 ROIC with pixel pitch 15 µm is designed and fabricated in 0.18 µm CMOS technology (Fig.10). The ROIC is coupled with a short-wave infrared InGaAs detector chip to form an FPA assembly and tested at room temperature.   Results and Discussions   The infrared focal plane test system (Fig.11) consists of a DC power supply, a 5078 timing generator, a digital acquisition card, a blackbody light source and a dedicated PCB test board for the functional testing of the 640×512 scale InGaAs infrared focal plane detector assemblies with windowing. A row of pins was placed in front of the sensing area of the focal plane assembly for imaging to verify the circuit windowing function. The circuit function was verified in several typical application scenarios, such as full frame readout, upper left corner windowing, centre windowing and windowing address overflow, respectively, to obtain an IRFPA windowing image (Fig.12). The test results show that the entire 640×512 scale InGaAs IR detector assembly functions normally, and the programmable windowing digital IP core functions as expected, which can realise the specified area windowing and effectively improve the ROIC frame rate. The power consumption of the column-level output circuit mainly comes from the output buffer. The time-selection technology proposed in the paper effectively reduces the power consumption, in which the total power consumption of the whole assembly is less than 80 mW under the 3.3 V power supply. The power consumption of the column level is only 15 mW, and the readout rate reaches 15 MHz (Tab.1).   Conclusions  In this paper, a programmable windowing digital IP core module design is proposed based on the digital IC design flow implementation, which can achieve high frame rate readout in windowing mode. This programmable windowing IP core uses a row-address-controlled windowing architecture, allowing the windowing core algorithm to be reused for different-sized IRFPA readout circuits with good scalability and no pixel area occupation. At the same time, to address the problem of high power consumption in high frame rate readout, a time-selection technology is used to optimise the ultra-low power consumption of the column-level module of the ROIC. The programmable windowing IP core layout is integrated with the analogue pixel array layout to achieve a scale of 640×512, 15 µm low-power, high-speed programmable arbitrary windowing IRFPA readout circuit based on a 0.18 µm CMOS process. The ROIC is coupled with a short-wave infrared InGaAs detector chip to form an FPA assembly and tested at room temperature. The results show that the time-selection technology effectively reduces the power consumption of the column-level circuit, the total power consumption of the circuit readout is less than 80 mW while the power consumption of the column-level is only 15 mW, and the readout rate reaches 15 MHz. The programmable windowing digital IP core functions properly, allowing for the readout of specified areas. The work in this paper provides the technical basis for subsequent large-scale small-pitch IRFPA high frame rate low power ROICs.
Design of two-color cold infrared optical system
Wang Chenfeng, Wang Xiaowei, Lu Weiguo
2023, 52(12): 20230297. doi: 10.3788/IRLA20230297
[Abstract](79) [FullText HTML] (11) [PDF 4216KB](57)
  Objective  For the current space environment single infrared band detection target false alarm rate is high, low sensitivity and other challenges, a double-color infrared optical system design method based on cold optical technology is proposed. The front optical path of the optical system adopts a common aperture structure, and the spectral band splitting is performed by a splitting plate, and the cold apparatus matching is realized by the secondary image of the relay mirror in order to ensure the light miniaturization of the system. In order to enhance the detection sensitivity of the long-wavelength system, a cold optical design is carried out to reduce the impact of the system's own radiation of detection performance. The working wavelengths are 3.7-4.8 μm and 7.9-9.3 μm, the F-number is 1.2, the total dimension of the optical structure is 260 mm×150 mm×80 mm, the aberration of the medium-wavelength system is less than 2.8%, about 82% of the energy is concentrated in a pixel of the detector, and the aberration of the long-wavelength system is less than 0.33%, about 70% of the energy is concentrated in one image element of the detector. The system can detect dim space targets at a long distance, and has the advantages of low false alarm rate, high sensitivity and compact structure.   Methods   The common optical systems included refractive, reflective and reflexive, and the different optical structures have their unique advantages and disadvantages. Refractive systems have no center obscuration and high efficiency, but the variety of optical materials is small and not easy to correct chromatic aberration. Secondary image system is easy to match the cold screen, the optical components are small in size and light in weight, but the number of pieces is more. After comprehensive consideration, the refractive secondary image system is selected.   Results and Discussions  According to the design index of infrared optical system and the design principle of light miniaturization and high energy transmission rate, it is decided to choose refractive secondary imaging system as the initial structure. The front optical path of the system adopts a common aperture type structure, and then the spectroscopic plate is used for spectroscopy, and the relay mirror set adopts the secondary imaging method to realize the cold apparatus matching and ensure the compactness of the system. In the process of system design optimization, aspheric surface is introduced to correct the aberration. The aberration of the medium-wavelength system is less than 2.8%, and about 82% of the energy is concentrated in one image element of the detector, while the aberration of the long-wavelength system is less than 0.33%, and about 70% of the energy is concentrated in one image element of the detector. Each mirror of the medium-wavelength system and long-wavelength system meets the requirements of the system cold reflection. After setting a reasonable tolerance value, the system image quality still meets the use requirements. After the completion of processing and assembly, the experimental verification, the system detection distance meets the expected target, to meet the design requirements.   Conclusions  As the demand for space target detection grows, multi-band detection will become one of the future directions of infrared detection technology. A cold dual-color infrared detection system is designed in the paper. Through experimental verification, the detection capability of the system meets the expected target.
Lasers & Laser optics
Optical imaging
The construction method of space-based digital imaging link mathematical model
Li Yaru, Zhou Liang, Liu Zhaohui, She Wenji
2023, 52(12): 20230351. doi: 10.3788/IRLA20230351
[Abstract](93) [FullText HTML] (16) [PDF 3528KB](24)
  Objective  With the proposal of digital equipment construction, it is imperative to build space-based digital equipment that can simulate situational awareness capabilities. As one of the core equipment for space-based situational information acquisition, the optical imaging system is inevitably an integral part of the construction of space-based digital equipment systems. Establishing a scientifically and reasonably accurate model of space target imaging link is crucial for constructing a space-based digital imaging system. Additionally, due to the involvement of various scientific and technological fields, the construction of a space target imaging system is characterized by a large-scale system and a long development cycle. Traditional research methods are unable to meet the needs of key technology verification for space-based systems. Therefore, it is also necessary to construct this digital model. By using simulation and comprehensive integration, critical technologies of imaging systems can be validated. Additionally, it provides a demonstration environment for research on space target imaging technology and serves as an auxiliary tool for the design of space-based observation platforms.   Methods  Based on Kepler's three laws and visibility analysis (Tab.2), this paper constructs a visible model for camera and target optical observations. Based on the uniform smoothing algorithm and advanced wavefront algorithm, the triangulated mesh division technique and the five-parameter bidirectional reflectance distribution function (BRDF) (Tab.3) are used to construct the geometric and optical characteristic model of the target. By employing path tracing and importance sampling of light rays, a global illumination algorithm (Fig.5) is used to construct the imaging radiative transfer model. Finally, the target radiance image undergoes optical-electric energy conversion and imaging modulation (Fig.7) to become the final output image of the sensor. This paper simulates target images satisfying visibility conditions using the Hubble Space Telescope as the imaging object, based on the given orbital parameters of imaging platform and space target.   Results and Discussions   By comparing the visibility simulation results within 15 days of the two-body orbit model in Satellite Tool Kit (STK) (Fig.9), the correctness of the imaging visible model proposed in this paper is validated. The close-range imaging results of the target (Fig.11) demonstrate the accuracy of the global illumination algorithm in a multi-light source space-based imaging scenario. The quality degradation simulation results (Fig.14) indicate that the convolution of the frequency domain transfer function and the accumulation of temporal noise can simulate different levels of image quality degradation in on-orbit imaging. Under the conditions of a time interval of 3 seconds and a distance range of 70 to 200 km, imaging simulations were performed on the target with a Earth-oriented attitude. The imaging results (Fig.10) demonstrate that the imaging chain model can effectively generate target sequence images that satisfy the requirements of orbit monitoring conditions.   Conclusions  This paper starts from the camera and target's orbital parameters and calculates the observable time periods of the target under the condition of orbital flight using the camera and target visible model. Using the target geometry and optical characteristic model, the reflection of light source energy by targets with different materials and geometric shapes is described. The target radiance image is obtained by performing a rapid calculation of the visible parts of the target using the imaging radiative transfer model. Finally, the final sensor output image is generated through the process of photoelectric energy conversion and imaging modulation model. The imaging chain mathematical model constructed in this paper allows for the research of digital imaging technology in specific imaging scenarios without relying on other orbit and imaging software such as STK and OpenGL. It provides references and foundations for the design of physical cameras, detector selection, and the construction of core modules in the digital twin system for space-based imaging.
High quality and rapid imaging of single-shot optical speckle
Wang Wei, Cai Xunming, Zhao Xin, Ma Wenbin
2023, 52(12): 20230345. doi: 10.3788/IRLA20230345
[Abstract](100) [FullText HTML] (40) [PDF 5216KB](32)
  Objective  The pursuit of high-quality optical rapid imaging through scattering media is crucial for real-time and dynamic imaging applications. The primary focus is on achieving excellent imaging quality within a short camera exposure time, necessitating the identification and mitigation of factors that degrade optical rapid imaging. In this study, the single-shot speckle autocorrelation method, leveraging the optical memory effect, is employed to investigate optical rapid imaging through scattering media. To address the challenge of spatial coherence in laser beams, a rotating diffuser is introduced. This diffuser effectively eliminates spatial coherence, thus preventing the adverse impact of coherent noise on imaging quality. The speckle contrast serves as a metric to quantify the effectiveness of spatial coherence elimination. Parameters such as grain size, rotation rate of the diffuser, and camera exposure time are examined for their influence on speckle contrast. Furthermore, the study emphasizes the significance of optimizing imaging algorithms to enhance the quality of rapid imaging. A systematic exploration of experimental factors and imaging algorithms contributes to the overall understanding and improvement of high-quality optical rapid imaging through scattering medium.   Methods  A rotating diffuser is introduced to eliminate the spatial coherence of the laser beam, so the impact of coherent noise on imaging quality is avoided. The speckle contrast can be used to measure the effect of eliminating the spatial coherence of the beam. For investigating the impact of rotating diffusers on the quality of optical rapid imaging, different cases involving 220-grit and 600-grit rotating diffusers, various rotational rates, and different camera exposure times are analyzed. The rotational rate of the diffuser ranges from 10 to 100 revolutions per second, increasing in increments of 10 revolutions per second. The camera exposure time is varied from 30 to 220 milliseconds, increasing in increments of 30 milliseconds. The study examines the speckle contrast and imaging correlation coefficient concerning the rotational rate of the diffuser and the camera exposure time (see Fig.5). To restore the point spread function of the system without relying on prior information of the target, an iterative optimization algorithm for the optical transfer function constraint is employed. The imaging algorithm, combining the point spread function with the speckle autocorrelation algorithm, enables the single-shot imaging of targets. The quality of this algorithm is analyzed and compared with the case where only the speckle autocorrelation algorithm is used (see Fig.10). This comprehensive analysis contributes to understanding and optimizing the factors affecting optical rapid imaging through scattering media.   Results and Discussions  Some important results can be drawn from the experiments. Firstly, the speckle contrast decreases and the imaging correlation coefficient increases with the increase of the rotation rate of the rotating diffuser and the exposure time of the camera (Fig.5). Secondly, the change of the speckle contrast and imaging correlation coefficient with the rotation rate of the diffuser is relatively small after the camera exposure time exceeds 100 milliseconds. Thirdly, compared with the cases of 220 grits rotating diffusers, the speckle contrast decreases for 600 grits rotating diffusers. Fourthly, at the same rotating rate of the diffuser, the speckle contrast and imaging correlation coefficient change nonlinearly as the camera exposure time increases (Fig.6). Compared with using the single-shot speckle autocorrelation algorithm alone, the imaging quality of the point spread function combined with the speckle autocorrelation algorithm is significantly improved (Fig.10, Fig.11).   Conclusions  The effects of the grain size, the rotation rate of rotating diffuser and the exposure time of camera on the speckle autocorrelation imaging is studied experimentally. For the high-quality and rapid imaging with a short camera exposure time, it is very important to choose the most appropriate rotational rate of the rotating diffuser, which can significantly improve the imaging quality. By directly extracting the point spread function from the optical speckle and combining it with the speckle autocorrelation algorithm, the high-quality and rapid imaging of the target through the scattering medium can be realized. The method can make the imaging quality under the camera exposure time of 40 milliseconds close to the imaging quality under the camera exposure time of 160 milliseconds.
Optical design
Laser communication flat back servo pendulum mirror support structure optimization design
Li Xiaoming, Guo Minghang, Liu Yingze, Yao Jialong, Wang Libiao, Dong Yunchong, Chen Xilai
2023, 52(12): 20230336. doi: 10.3788/IRLA20230336
[Abstract](75) [FullText HTML] (10) [PDF 4305KB](19)
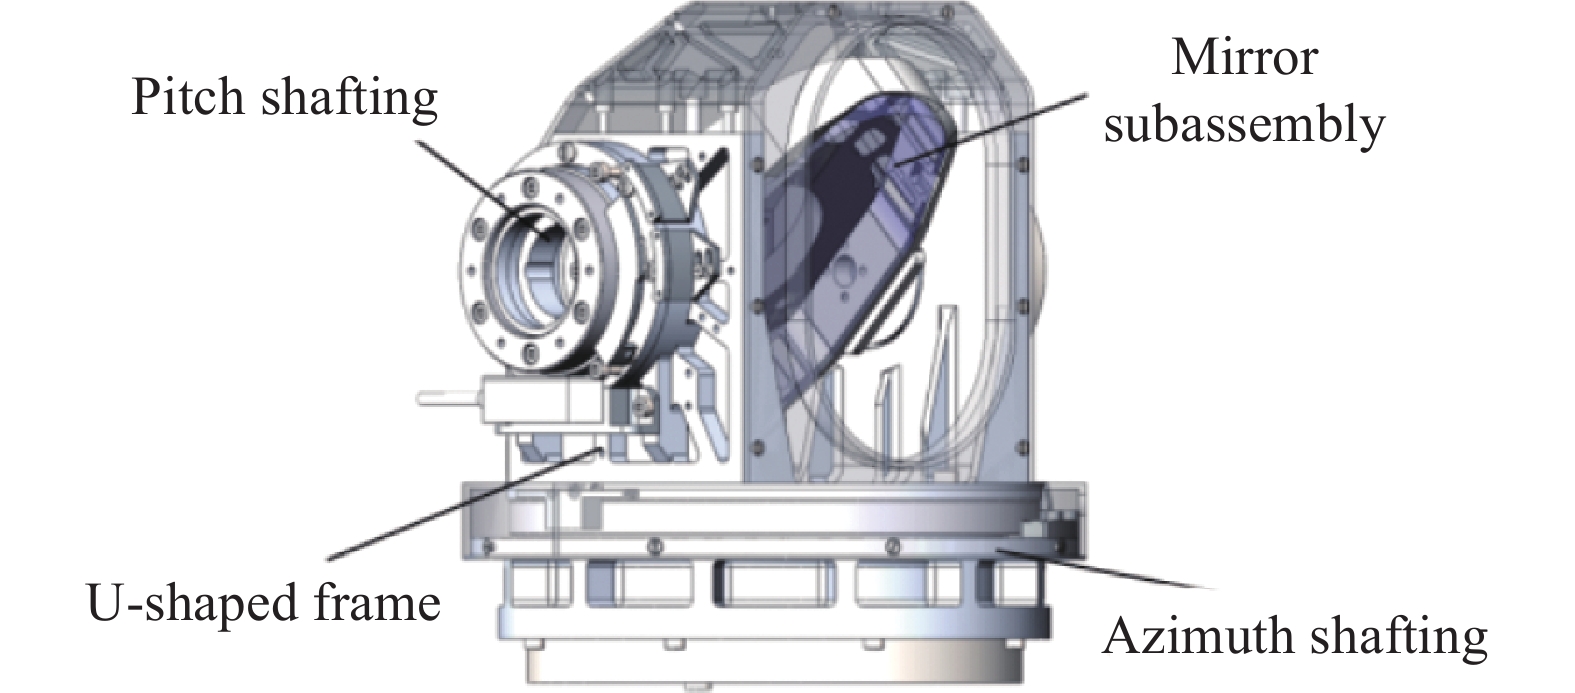
  Objective  For a laser communication system ground principle prototype, the system uses coherent high-speed communication system, communication laser is polarized light, the optical system needs to be coated with dielectric film to ensure the stability of the polarization state. Affected by the thickness of the dielectric film and the coating process, the dielectric film has a large impact on the precision of the surface shape of the pendulum mirror, and it is very easy to cause the deterioration of the shape behind the coating. Therefore, the servo pendulum mirror is designed as a flat back structure to ensure the symmetry of the front and back sides of the pendulum mirror, and the front and back sides are coated simultaneously to reduce the influence of the dielectric film on the surface shape accuracy of the pendulum mirror. For the above reasons, the servo pendulum mirror is thicker, heavier and not easy to use the central support solution, so the peripheral flexible support structure is used.   Methods  In order to ensure the mirror precision and support stiffness of the pendulum mirror, a peripheral support scheme is designed, and according to the flexible support design theory, a peripheral flexible support structure is proposed to reduce the structural stiffness and reduce the stress generated by the structural deformation by forming a hinge structure through notching the mechanical structure at the bonding of the pendulum mirror and the mirror base. Since the shape of the pendulum mirror, the location of the bonding point and the flexible support structure have many parameters and are coupled with each other, the main parameters of the pendulum mirror are first analyzed and optimized by the orthogonal experiment method to determine the shape and size of the pendulum mirror and the location of the bonding point, and then the flexible support structure of the pendulum mirror is optimized.   Results and Discussions   It can be seen that the maximum surface shape error PV value of the pendulum mirror assembly is λ/16.34 and RMS value is λ/83.28 under the combined effect of standard earth gravity load and 5 ℃ uniform temperature rise and temperature drop (Tab.9). value is λ/5, and the RMS value is λ/42.87 to meet the surface accuracy requirement. The maximum RMS value of the surface shape error of the pendulum mirror assembly in the temperature range of (23±5) ℃ is λ/43.28 (Tab.10), which meets the requirement of the index, proving that the flexible support structure around the pendulum mirror assembly can ensure good thermal stability.   Conclusions  In order to ensure the dynamic stiffness and face shape accuracy of the large-thickness flat-backed servo pendulum mirror system under the harsh environment, a peripheral flexible support structure scheme is proposed. The shape of the pendulum mirror, the position of the bonding point and the peripheral flexible support structure are designed parametrically, and the parameters are optimized according to the orthogonal experiment method to obtain a peripheral flexible support structure that meets the design requirements. After the finite element analysis, the fundamental frequency of the pendulum mirror assembly is 446.66 Hz (Fig.6), which meets the design index requirement of component mode frequency greater than 300 Hz; the PV value of the pendulum mirror surface shape is λ/5 and the RMS value is λ/42.87 in the temperature range of (23±5) ℃ (Tab.9), which is better than the index requirement of λ/40. The surface shape of the pendulum mirror was examined at different temperatures using ZYGO laser interferometer (Fig.10), and the test results showed that the RMS value of the surface shape of the pendulum mirror was better than the design value of λ/40. Therefore, the parametric design of the pendulum mirror shape, bonding point location and the surrounding flexible support structure make the structural stiffness and thermal stability of the pendulum mirror assembly meet the design requirements of the system.
Study on performance testing techniques for astronomical optical cameras
Qiu Peng, Zou Sicheng, Zhang Xiaoming, Wang Jianfeng, Lin Qin, Jiang Xiaojun
2023, 52(12): 20230316. doi: 10.3788/IRLA20230316
[Abstract](52) [FullText HTML] (8) [PDF 3195KB](23)
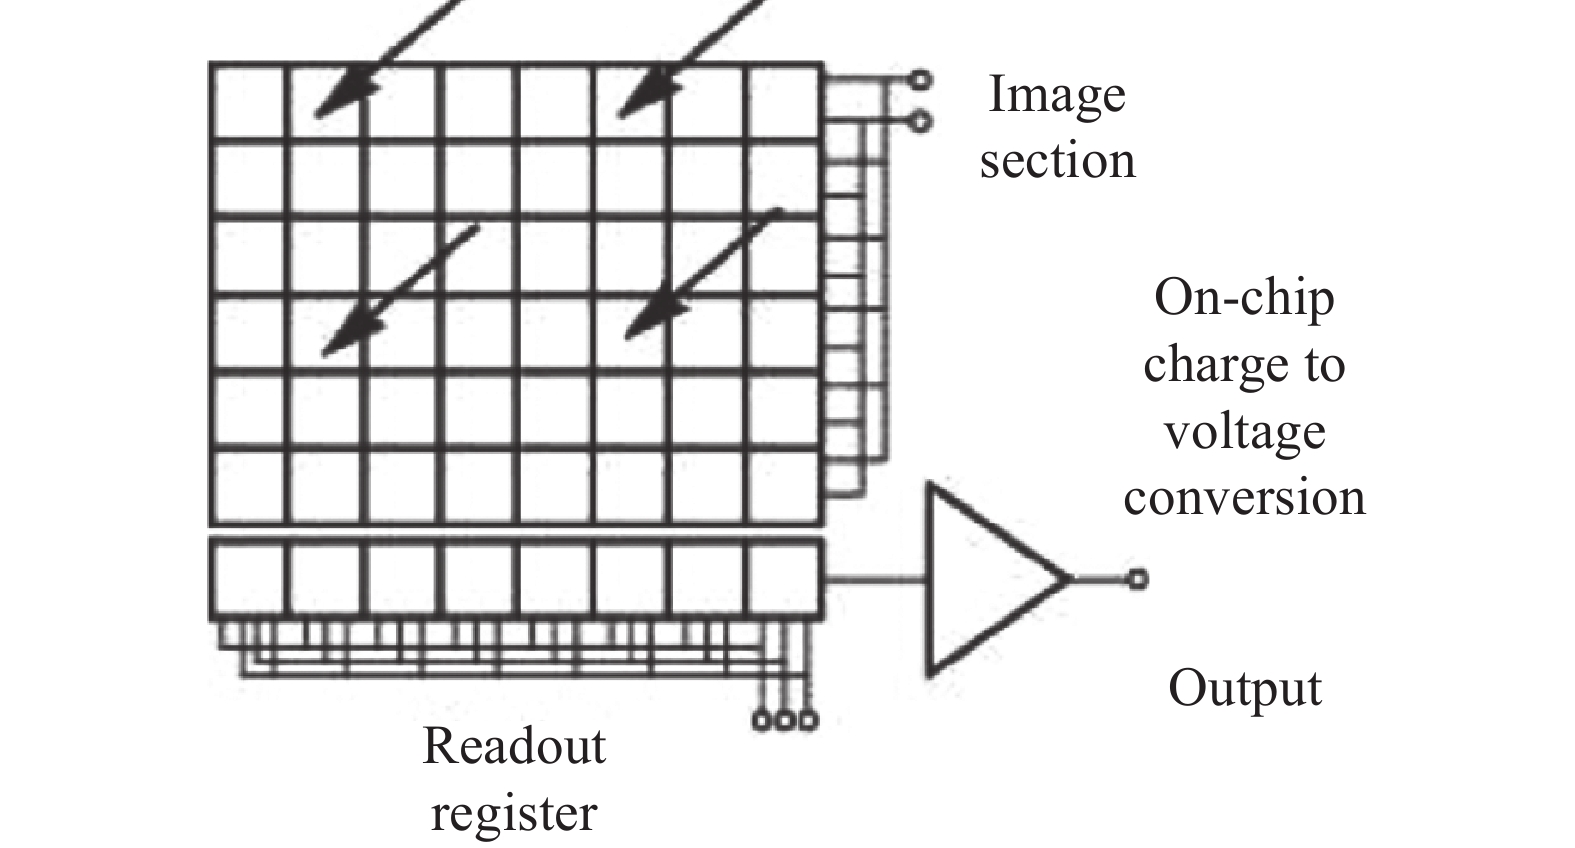
  Objective  Cameras is a critical component of an optical telescope observation system, and their performance significantly affects the quality and efficiency of astronomical observations. Acquiring camera performance parameters is beneficial in enhancing precision and efficacy of astronomical observations. Numerous worldwide photosensitive chips and camera manufacturers have devised their own performance to test standards based on their experience, to make it difficult to compare products from different manufacturers based on their performance parameters. Although camera performance test can be conducted according to the EMVA1288 standard, and data sheets conforming to EMVA1288 standard can be provided, the standard primarily caters to the machine vision industry cameras, and some of the performance test settings are incompatible with the needs of astronomical optical cameras. Consequently, research on testing technology for astronomical optical cameras is imperative.   Methods  In astronomical optical observations, the common used cameras are CCD (Fig.1) and CMOS (Fig.2). After analyzing the requirements of astronomical optical observations, the performance test items for astronomical optical cameras are determined to be gain, readout noise, full well capacity, dynamic range, linearity, bias stability, pixel readout noise statistics, photo response non-uniformity (PRNU), and dark current. The photon transfer curve (PTC) method and so on are selected for testing performance items, and definitions and testing methods for each item are explained. In order to verify the feasibility of this set of test items, test methods, test experiments, and data processing methods, the Andor Marana sCMOS and Andor iKon-L 936 CCD cameras (Fig.4) are tested in the laboratory using a testing system set up on a dark optical platform (Fig.5). The gain, readout noise, full well capacity, linearity, bias stability, pixel readout noise statistics, dynamic range, PRNU, and dark current of the sCMOS camera's 12-bit setting and CCD camera's 1 MHz 4× setting are tested, respectively.   Results and Discussions   A series of performance tests were conducted on the CCD and sCMOS cameras in a laboratory, obtaining performance parameters for the sCMOS 12-bit and the CCD 1 MHz 4× settings (Tab.4): gain, readout noise, full well capacity (Fig.6, Fig.7), linearity (Fig.8, Fig.9), bias stability (Fig.10), pixel readout noise statistics (Fig.11), dynamic range, PRNU, dark current (Fig.12, Fig.13, Fig.14). By comparing the performance test results of the two cameras, the Marana sCMOS 12-bit setting showed approximately half lower readout noise, 17 times higher dark current, 3 magnitude lower dynamic range, and twice as high PRNU compared to the iKon-L936 CCD 1 MHz 4× setting. Both cameras demonstrated high linearity and bias stability. The sCMOS camera exhibited glow, making it unsuitable for long-exposure observations. Through the laboratory tests of the sCMOS and CCD cameras, the performance parameters of cameras were obtained, and the feasibility of the testing items, testing methods, testing experiments, and data processing methods were verified.   Conclusions  Cameras are essential components of optical telescope observation systems. Acquiring camera performance parameters plays a significant role in formulating astronomical observation plans, adjusting observation strategies, data processing, and diagnosing faults. To enhance the accuracy and efficiency of astronomical optical observations, research on the performance testing of astronomical optical cameras has been conducted. By introducing CCD and CMOS cameras commonly used in astronomical optical observations and analyzing the performance requirements of cameras in astronomical optical observations, camera performance testing items, testing methods, testing experiments, and data processing methods have been established. These testing items include gain, readout noise, full well capacity, dynamic range, linearity, bias stability, pixel readout noise statistics, PRNU, and dark current.   To validate the feasibility of this methodology, a detection experiment was constructed based on the defined testing items, testing methods, testing experiments, and data processing methods. A comparative test was conducted using the Andor Marana sCMOS and Andor iKon-L936 CCD cameras to verify the testing items, methods, and data processing methods. Through performance testing experiments on the cameras, the feasibility of the testing items, testing methods, testing experiments, and data processing methods was confirmed. This research enables testing of all settings of a camera, allowing for the acquisition of performance parameters across the entire settings.   The proposed method facilitates comparisons between different settings of the same camera or between different cameras, assisting users in selecting cameras or cameras settings that better suit their observational needs, thereby obtaining better observation data. Regular performance testing of cameras can be conducted, and a comprehensive database of performance parameters throughout the camera's lifecycle can be established. This database would facilitate the management of camera health status and diagnosis of faults in the observation system.
Research on decomposition method of camera LOS thermal stability index based on Monte Carlo method
Liu Yong, Tang Tianjin, Wang Qiaoxia, Jiang Yanhui, Hu Yongli
2023, 52(12): 20230354. doi: 10.3788/IRLA20230354
[Abstract](54) [FullText HTML] (7) [PDF 1627KB](16)
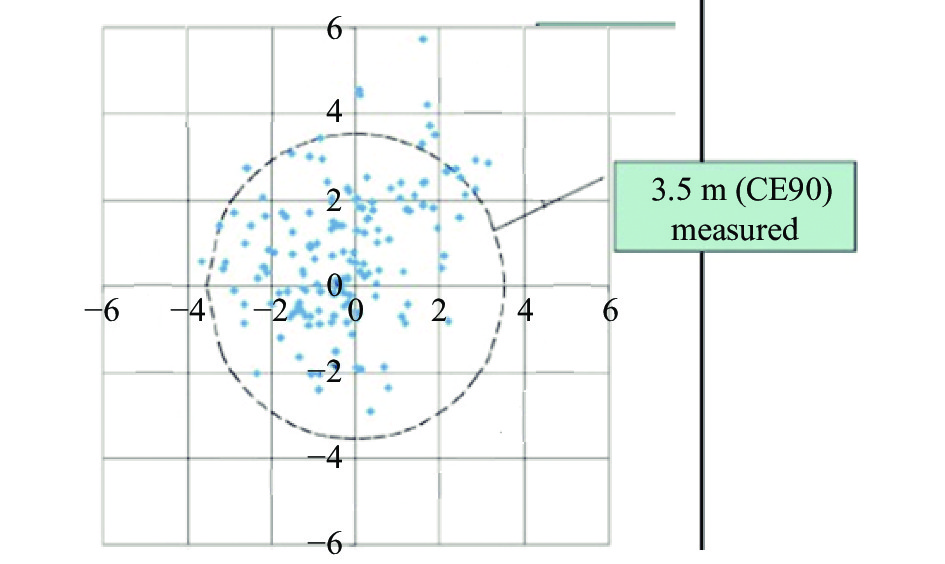
  Objective  With the wide application of remote sensing image, users are increasingly demanding for position accuracy, so the stability of the line of sight (LOS) for remote sensor is more and more important. On the other hand, as camera system complexity increases, the iterative method of components' designing and modeling again and again is increasingly unable to meet the requirements of design. The stability of the LOS is a key indicator for the decomposition of overall into components in the remote camera. At present, many camera designs only have a uncontrolled positioning accuracy index or overall LOS stability index at the beginning, and there is no publicly available LOS index decomposition design method based on top-level design. To improve the efficiency of camera design and reduce design iterations, a Monte Carlo method is proposed to decompose the thermal stability index of the camera's line of sight.   Methods  Using the linear optical theory and taking a certain camera as an example, CODEV is used to obtain the visual axis sensitivity matrix of the optical system (Tab.1). On this basis, in order to decompose the LOS thermal stability index into various mirrors, the six degree of freedom displacement values of each mirror are regarded as random quantities, and each random quantity is regarded as a uniform distribution within the allowable value, constructing a large displacement distribution of the mirror. Multiplying the displacement and axis of sight sensitivity matrix, countless LOS results are calculated. The allowable use of LOS system indicators is known, and the probability of meeting the requirements in the constructed data can be obtained through statistics. The more constructs, the more accurate the calculation. By continuously adjusting the allowable value of the six degrees of freedom displacement of the reflector, the allowable value of optical components that meet the indicators can be obtained, thus decomposing the overall stability index of the camera's visual axis into various components such as primary mirror, secondary mirror, and tertiary mirror.   Results and Discussions   According to the LOS sensitivity matrix of a certain camera (Tab.1), it can be seen that the influence of displacement of different optical components on the optical axis is not equivalent. Overall, the six degree of freedom displacement of the primary mirror has the greatest impact on the change of the optical axis. The weight ratio of the unit angular displacement of the primary mirror, secondary mirror, and tertiary mirror on the optical axis is close to 10∶2∶1, and the weight ratio of the translation displacement on the optical axis is close to 3∶2∶1. It is more reasonable to decompose the opposite weight ratio into the thermal stability tolerance of each optical element. The rationality of weight allocation was also verified through Monte Carlo tracing. The probability of a random LOS change at [−0.45″ −0.45″] is 77.9% when the weight of the primary mirror, secondary mirror, and tertiary mirror is 1∶2∶20. When the weight is 1∶2∶10, the probability can be increased to 92%. However, by doubling the thermal displacement tolerance of the tertiary mirror to 0.5 seconds, the probability can only be increased to 95.5% when the weight of the primary and secondary mirrors is 1∶2∶5, greatly reducing the efficiency of improvement.   Conclusions  In order to solve the problem of decomposing the accuracy index of complex camera uncontrolled positioning into optical components, a Monte Carlo decomposition method based on the sensitivity matrix of the line of sight was proposed using the theory of linear optical systems at small angles. By constructing the tolerance probability distribution of each optical element and calculating the probability of achieving CE90 for the axis of sight index, the displacement of the optical element is ultimately determined. A certain camera underwent indicator decomposition, and the results showed that as the sensitivity increased, the indicators of the primary, secondary, and tertiary mirrors were set in inverse proportion to the optimal result. The temperature control tolerance of the tertiary mirror designed based on the decomposition results is significantly larger than the other two mirrors. Finally, this article validated the accuracy of indicator decomposition using finite element simulation, and the results showed that indicator decomposition can effectively guide the design of component components and minimize ineffective thermal control margins to the greatest extent.
Special issue—Low-dimensional optoelectronic materials and devices
Research progress of high-performance PeLEDs based on organic light-emitting materials (invited)
Gao Chunhong, Wang Linqiang, Zhou Kewen, Yang Wei, Zhou Li, Yin Xiaojun, Ban Xinxin, Pan Shusheng
2023, 52(12): 20230630. doi: 10.3788/IRLA20230630
[Abstract](159) [FullText HTML] (71) [PDF 4185KB](57)
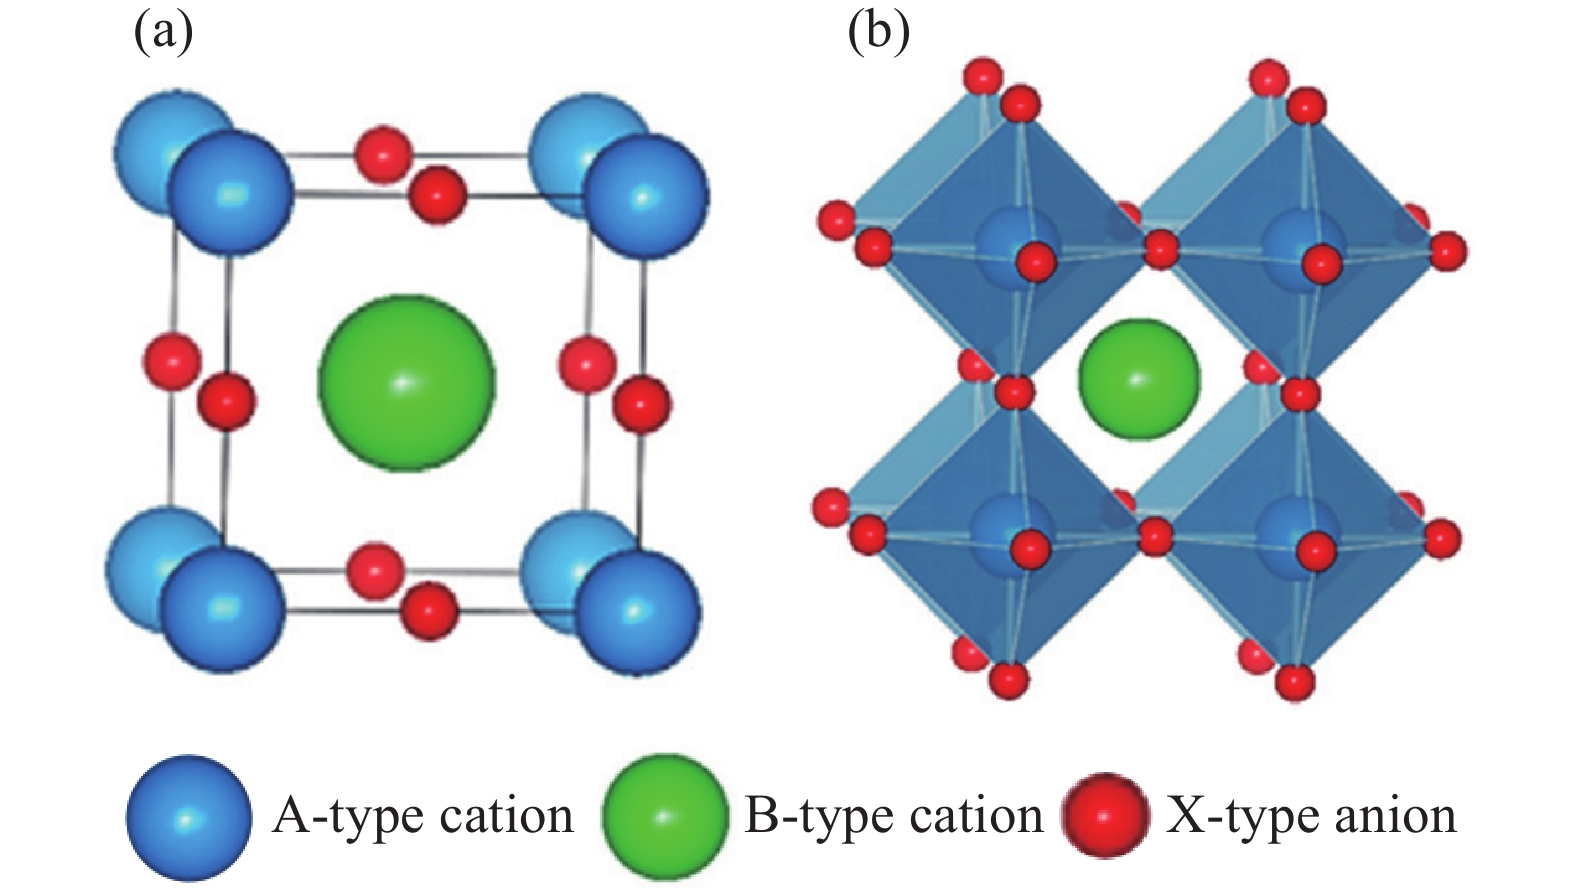
  Objective  In recent years, metal halide perovskite light-emitting materials have attracted great attention for their application in metal halide perovskite light-emitting diodes (PeLEDs) due to their outstanding optoelectronic properties, and are considered as the next generation of light-emitting sources in the field of display and lighting. Exciton utilization is one of the key factors affecting the efficiency of PeLEDs. Various methods have been employed to confine excitons in the perovskite light-emitting layer and recycle the energy of excitons to improve the utilization rate of excitons. This article will review the attempts made to improve the optoelectronic properties of green and blue PeLEDs by utilizing traditional fluorescent materials, phosphorescent materials, and thermally activated delayed fluorescent materials. It will also briefly introduce the principle of exciton confinement, as well as the energy transfer mechanism of different types of light-emitting materials introduced into green and blue PeLEDs and the physical mechanism of improving the optoelectronic properties.  Methods  Films are fabricated using the methods of spincoating and vacuum thermal evaporation deposition. All the perovskites films are obtained by spincoating method. Various types of organic luminescent materials are introduced into the perovskite emissive layer as additives or inserted between the perovskite emissive layer/transport layer as sensitizers for exciton recycling, or through multiple coating to create multi-quantum well structures. These materials are brought into the PeLEDs through additive-assisted methods, device interface engineering, and structural optimization methods.  Results and Discussions   It has been demonstrated that the introduction of traditional fluorescent emitters with a larger bandgap than that of the perovskite can better recycle singlet excitons. The incorporation of organic phosphorescent materials and different types of TADF materials, which have internal quantum efficiencies near 100% and energies of both singlet and triplet excitons that are significantly higher than the bandgap of the perovskites, can better recycle and utilize both singlet and triplet excitons of the perovskites. This leads to a potential internal quantum efficiency value of 100% for PeLEDs. Compared to traditional TADF materials, new TADF materials with a "core"-"shell" structure (such as Cz-3CzCN and Cz-4CzCN) and semiconductor TADF polymers with a "TADF core"-"shell" structure (such as P-Cz5CzCN) can not only passivate the defects in the perovskites film but also effectively suppress "exiton"-"exiton" quenching due to direct contact between the TADF emission cores. This further improves the utilization of excitons, greatly enhancing the efficiency and stability of green- and blue-emitting PeLEDs.  Conclusions  This article reviews the work made by the groups of Gao Chunhong, Ban Xinxin and Wang Zhaokui in the fields of exciton confinement and exciton recycling in the past five years. These approaches mentioned above have been demonstrated in PeLEDs based on 3D perovskite emissive films (CsPbBr3) and quasi-2D perovskite emissive films (PEA2Csn-1PbnBr3n+1, p-F-PEA2Csn-1PbnBr3n+1). These methods can also be extended to various types of light-emitting devices to achieve efficient and stable PeLEDs, providing a feasible strategy for the commercialization of PeLEDs.
Research on precise measurement of phonon-polariton interference fringe period
Yin Zhijun, Wang Zhenxing, Li Quan, Song Renkang, Deng Xiao, Lei Lihua
2023, 52(12): 20230414. doi: 10.3788/IRLA20230414
[Abstract](120) [FullText HTML] (35) [PDF 5106KB](47)
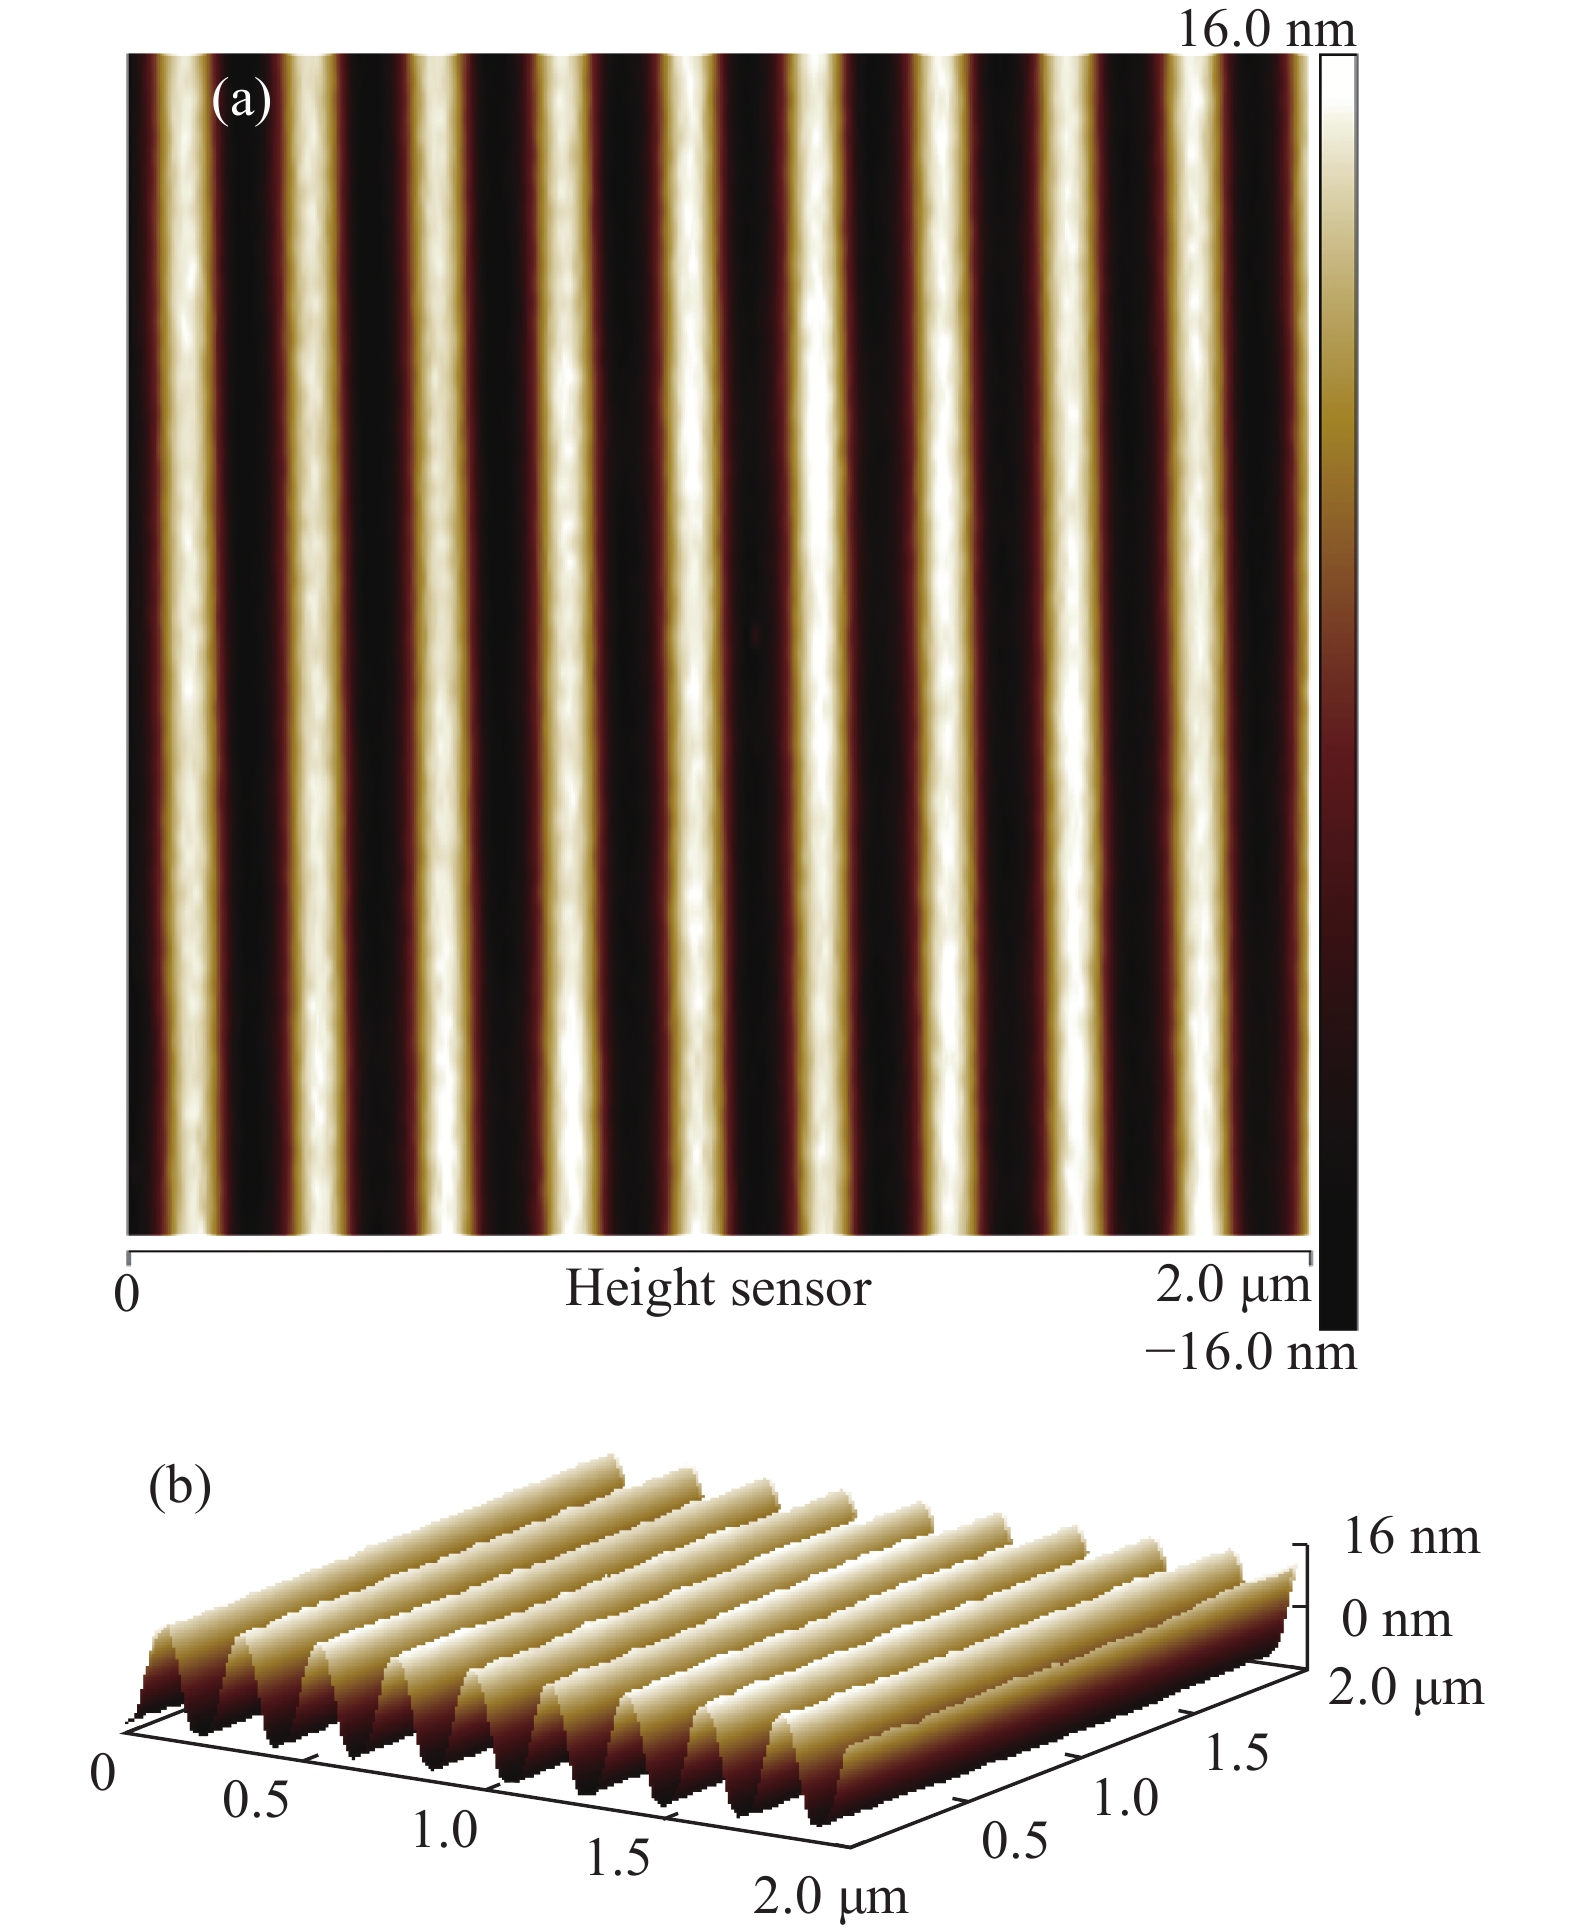
  Objective  Two-dimensional materials have garnered widespread attention due to their unique photoelectric properties at the nanoscale, showcasing distinctive application advantages in the fields of nano-electronic devices, optics, and energy. Notably, the phonon polaritons generated by the coupled excitation of phonons and photons in two-dimensional materials exhibit highly localized at the nanometer scale, presenting substantial application potential in cutting-edge research fields such as optical manipulation and energy transmission of on-chip photonics. Infrared imaging of the sample revealed that at the sample's edge, the mutual interference of phonon polaritons resulted in the fomation of polarization standing wave fringes parallel to the edge. The fringe period effectively reflects the coupling characteristics of phonon polaritons. Therefore, the study of modulated phonon polariton coupling primarily relies on the precise measurement of the interference fringe period. The current measurement method depends on the linear fitting calculation of image analysis software, and its accuracy is constrained by the image resolution. Additionally, the displacement errors occur in the sample loading stage of SNOM. To enhance measurement accuracy and minimize the impact of the these errors on the measured value, this paper proposes the use a self-traceable chromium grating for the precise measurement of the period of the polariton interference fringe in hBN.   Methods  In this paper, we present a self-traceable grating-hBN composite structure. The construction involves depositing a chromium grating on the silicon substrate using atomic lithography. The gaps between adjacent grating structures consist of air, and the two-dimensional polar material hBN is placed on the chromium grating. The dispersion of phonon polaritons generated by the recombination of hBN and different media is analyzed using Fabry-Perot quantization conditions. The study further investigates the phonon polariton coupling enhancement and modulation characteristics of two-dimensional polar materials resulting from periodic changes in metal grating structures. Scanning near-field optical microscopy (SNOM) was employed to image the phonon polaritons of the composite structure in near-field space during sample processing. Imaging of different sizes is conducted at the same point, and two methods are employed for image processing for comparison. The first method involves traditional linear fitting based on Gwyddion for calculating the interference fringe period, while the second one utilizes the use of image analysis program to perform self-traceable grating comparison measurement on the fringe period.   Results and Discussions  When using the traditional Gwyddion-based linear fitting for calculating the interference fringe period, the measured fringe period in the 1 µm×1 µm near-field optical imaging is 0.264 µm, in the 5 µm×5 µm image is 0.254 µm, and in the 10 µm×10 µm image is 0.257 µm. It is observed that when the size of the measurement image is small, the error offset is large. After a large-scale scanning, the measurement value tends to stabilize, yet the overall measurement result remains unstable. Considering the 10 nm resolution of SNOM, the standard deviation value is calculated as 4 nm. Simultaneously, the image analysis program is employed to perform self-traceable grating comparison measurement on the fringe period, The grating period serves as the scale for measuring the interference fringe period. The fringe periods measured in 1 µm×1 µm, 5 µm×5 µm and 10 µm×10 µm images are 261.28 nm, 260.35 nm, 261.41 nm respectively, with a standard deviation of the measured values at 0.34 nm. Compared with the standard deviation of 4 nm from the traditional measurement method, this presents an order of magnitude reduction, achieving higher precision. When the self-traceable grating is employed, it not only measure the period size, but also calibrate the measurement point of the detection equipment. Taking SNOM in this study as an example, the calibration size ΔU of the equipment displacement device is approximately −0.18 nm/pt, with uncertainty related to the grating uncertainty, achieving sub-nanometer accuracy. However, the actual measurement still needs to consider the impact of the device resolution on measurement accuracy.   Conclusions  By constructing a composite structure comprising a self-traceable chromium grating and a two-dimensional polar material hBN, this study leverages the periodic enhancement principle of phonon polariton intensity generated by the structural changes in the substrate grating material. Employing a scanning near-field optical microscope for imaging, the resulting composite structure exhibits coupling-enhancing fringes consistent with the self-tracing grating pitch distribution. Through image analysis and measurement, the self-traceable grating period of 212.782 nm is utilized as the scale. The interference fringe period is measured to be (261.01±0.34) nm, achieving a measurement with higher accuracy than the uncertainty of the traditional fitting method. Simultaneously, nanoscale calibration of the device can be realized based on the measurement results. In this paper, the imaging calibration of the SNOM device is determined to be −0.18 nm/pt, with uncertainty linked to the grating uncertainty. This grating metrology method offers a measurement approach with superior accuracy and reliability for precisely measuring the excitation wavelength of phonon polaritons and controlling the coupling of photon and phonon. Additionally, it provides an experimental basis for the design and regulation of two-dimensional materials applied to nanoscale devices.
Study on preparation and infrared properties of CoS QDs/PDMS nanocomposite films
Hu Kun, Zhang Taiwei, Li Guobin, Li Xueming, Tang Libin, Yang Peizhi
2023, 52(12): 20230393. doi: 10.3788/IRLA20230393
[Abstract](119) [FullText HTML] (28) [PDF 2857KB](30)
  Objective  TMCs have been widely used in photocatalysis, solar cells, lasers and other fields because of their excellent optical, electrical and photoelectric properties. As a typical TMCs material, CoS QDs have excellent near-infrared absorption properties due to their narrow band gap and are expected to be used in infrared technology. CoS QDs are expected to be an important material for infrared detector preparation. In order to improve the optical properties and processing properties of CoS QDs, CoS QDs were further prepared into nanocomposite films to expand their application range. At present, the research work on CoS mainly focuses on CoS NPs, and there are few reports on quantum dot composite films. Therefore, the CoS QDs prepared by liquid phase ultrasonic exfoliation method are blended with PDMS, and the infrared properties of CoS QDs /PDMS nanocomposite films are studied. In order to expand the application of CoS QDs in infrared optics.  Methods  CoS QDs solution was prepared by liquid phase ultrasonic exfoliation method. The preparation steps were as follows: 0.15 g CoS powder (purity ≥99.5%) was weighed and put into a mortar and fully ground for2 h; The ground CoS powder was evenly mixed with 50 mL of anhydrous ethanol (purity ≥99.7%) dispersant, and placed in the ultrasonic instrument at 90 W power for 2 h; The ultrasonic solution was centrifuged at a rotational speed of 500 r/min for 5 min. Taking out the supernatant, CoS QDs solution was obtained. The CoS QDs solution is dried for later use. CoS QDs/PDMS nanocomposite films were prepared by blending method. 5 mLof the basic component A of PDMS and 0.5 mL of the curing agent B were transferred to the beaker, and appropriate amount of the dried CoS QDs powder was added, stirred with a magnetic stirrer for 5 min, and then transferred to the petri dish and heated at 30 ℃ until film formation. The size, morphology, structure and elemental components of CoS QDs were characterized by transmission electron microscopy (TEM), atomic force microscopy (AFM) and energy dispersive spectrometry (EDS). The phase composition and bonding properties of CoS QDs were analyzed by X-ray photoelectron spectroscopy (XPS), X-ray diffraction (XRD), Fourier transform infrared spectroscopy (FTIR), and Raman spectroscopy (Raman); the optical properties of CoS QDs and CoS QDs/PDMS composite films were tested by UV-Vis spectrophotometer and fluorescence spectrometer.  Results and Discussions   Both CoS QDs and CoS QDs/PDMS nanocomposite films have obvious absorption and luminescence characteristics in infrared band, and the infrared absorption characteristics of the composite films are better than that of CoS QDs films (Fig.4(a)-(c)). With the increase of excitation wavelength, the PL peak of CoS QDs/PDMS nanocomposite films shows a redshift, which shows obvious Stokes shift effect and excitation wavelength dependence (Fig.4(k)).   Conclusions  The spherical CoS QDs with good dispersion, uniform particle size and average particle size of about 5 nm were successfully prepared by liquid phase ultrasonic stripping method, and the CoS QDs/PDMS nanocomposite films were prepared by blending CoS QDs and PDMS. After UV-Vis test, it was found that CoS QDs solution and CoS QDs/PDMS nanocomposite films have absorption from ultraviolet to infrared band(200-2200 nm). Compared with CoS QDs films, the infrared absorption characteristics of CoS QDs/PDMS nanocomposite films are effectively enhanced. Moreover, the absorption strength of the film samples hardly changed after six months. The PL test shows that CoS QDs and CoS QDs/PDMS nanocomposite films have PL phenomenon in infrared band, PL peak has obvious redshift phenomenon, Stokes shift effect, and both have wavelength dependence. On the other hand, CoS QDs/PDMS nanocomposite films have excellent infrared optical properties, especially the absorption and luminescence characteristics in the infrared band, and the optical properties are very stable, indicating that the composite material has important potential application value in the fields of infrared detectors, nano-photonic devices, flexible displays, infrared lasers and so on.
Study on the longitudinal mode characteristic of idler wave in MgO:PPLN infrared optical parametric oscillator
Zheng Hao, Zhao Chen, Zhang Fei, Li Pengfei, Yan Bingzheng, Wang Yulei, Bai Zhenxu, Lv Zhiwei
2023, 52(12): 20230378. doi: 10.3788/IRLA20230378
[Abstract](103) [FullText HTML] (27) [PDF 1544KB](40)
  Objective  Narrow linewidth solid-state lasers are characterized by their excellent coherence and beam quality. Narrow linewidth lasers of certain wavelengths are necessary to meet the absorption or transmission requirements of specific ions, molecules, and materials. Therefore, it is of great significant to investigate the longitudinal mode characteristics of lasers at different wavelengths and operating modes. The 3-5 μm spectral range falls within the atmospheric window. Mid-infrared lasers in this band have been widely used for environmental gas monitoring, spectral analysis and optoelectronic countermeasures. Currently, MgO:PPLN crystals are typically employed in optical parametric oscillators (OPOs) to generate mid-infrared lasers within the 3-5 μm spectrum. This is attributed to their high second-order nonlinearity coefficient, large damage threshold, and widely tunable wavelength range. In addition to the tunability of the output wavelength, the optical parametric oscillation process also possesses the ability to suppress multi-longitudinal-mode operation within the cavity. While previous experiments have demonstrated that multi-longitudinal-mode operation can be suppressed by placing optical parametric crystals inside the cavity, However, more specific studies are limited. In this study, a comparative analysis of the variation of longitudinal mode properties at fundamental and idler frequencies was performed using MgO:PPLN crystals.   Methods  The output wavelength at different temperatures is simulated based on the phase matching equation and the dispersion equation, as depicted in Fig.1. The experimental setup is illustrated in Fig.2. An fiber coupled 808 nm laser diode continuous-wave laser was used as the pump source, with a core diameter of 200 μm and numerical aperture of 0.22. A 1:2 focusing lens result in a spot radius of 400 μm at the Nd:YVO4 crystal. The crystal has a dimension of 3 mm×3 mm×18 mm and a doping concentration of 0.3%. Plane mirrors M1 and M2 form a 1064 nm fundamental frequency optical resonator with a cavity length of 95 mm. A Q-switched pulse output of the fundamental frequency was obtained using an acousto-optic modulator. The fundamental frequency wave was directly coupled into the MgO:PPLN crystal via a 50 mm focusing lens, resulting in a beam radius of 400 μm for the fundamental frequency wave. The MgO:PPLN crystal, with dimensions of 10.5 mm ×1 mm×20 mm, a doping concentration of 5%, and a poling period of 31.0 μm was used. The OPO consist of plane mirrors M3 and M4 with a cavity length of 56 mm. The coating parameters of the lenses used in the experiments are presented in Tab.1.   Results and Discussions   Figure 3 depicts the output power variation of the 1064 nm fundamental frequency wave with the pump wave. A Q-switched laser output with a maximum power of 7.03 W is obtained at a repetition frequency of 120 kHz. Figure 4 illustrates the variation of output idle frequency optical power with the fundamental frequency. At a room temperature of 20 ℃ and a fundamental frequency optical power of 7.03 W, an idle frequency light with an output power of 0.702 W and a wavelength of 3.196 μm is obtained, corresponding to a conversion efficiency of 9.95%. Figure 5(a) shows the time-domain waveforms of the measured fundamental and idle frequencies. The pulse width of the 3 μm idle frequency laser is 4.7 ns, which is slightly narrower compared to the fundamental frequency laser and has a smoother waveform. Fourier transforms are performed on the waveforms, as shown in Fig.5(b). It can be seen that the multiple longitudinal modes are significantly suppressed after the OPO process, consistent with the results observed in the time domain.   Conclusions  By pumping the Nd:YVO4 crystal with an 808 nm laser diode, multiple longitudinal mode output of the fundamental frequency wave with a repetition rate of 120 kHz and a pulse width of 8.1 ns was achieved, resulting in a maximum output power of 7.03 W. Based on this fundamental frequency pump source, an MgO:PPLN-OPO was developed, yielding a pulse width of 4.7 ns and an output power of 0.7 W for the 3 μm idler wave, with a fundamental-to-idler wave conversion efficiency of 9.95%. Comparing the Fourier-transformed temporal waveforms of the fundamental frequency and idler waves, we can clearly observe the suppression of higher-order longitudinal modes of the idler wave during the OPO process. This study has significant reference value for regulating the longitudinal mode characteristics in OPO and achieving low noise parametric optical output.
Highly-efficient hybrid TADF/phosphorescent white organic light-emitting diodes based on an exciplex host
Zhang Yuanbo, Liu Yuan, Li Yanan, Bian Haodong, Li Jiarui, Zhu Lianqing
2023, 52(12): 20230222. doi: 10.3788/IRLA20230222
[Abstract](161) [FullText HTML] (55) [PDF 2283KB](36)
  Objective  White organic lighting-emitting diodes (WOLEDs) have attracted significant interest in the fields of flexible flat panel displays and large-area solid-state lighting due to their merits of ultrathin, large-scale and low-cost. Phosphorescent OLEDs can achieve 100% exciton utilization. However, the lack of stable blue phosphorescent materials hinders the commercial application of all phosphorescent WOLEDs. Thermally activated delayed fluorescence (TADF) materials, which can harvest triplet excitons through efficient reverse intersystem crossing (RISC) and achieve nearly 100% internal quantum efficiency (IQE) are emerging as next generation emitters for OLEDs. Therefore, hybrid TADF/phosphorescent WOLEDs have become an alternative for preparing high efficiency and stable WOLEDs. Generally, in WOLEDs, unbalanced carrier transport in light-emitting layers (EMLs) usually leads to narrow exciton recombination regions, which reduces the efficiency and color stability at a high current density. Various methods, including inserting interlayers between EMLs have been proposed to improve color stability. However, the organic-organic barriers between the interlayers and EMLs enlarge the driving voltages and exacerbate exciton accumulation. Therefore, developing WOLEDs with balanced carrier transport and broadening the exciton recombination zones are the key to simultaneously achieving high efficiency and stable white emission.   Methods  High efficiency hybrid TADF/phosphorescent WOLEDs are prepared in this study. An exciplex system TCAT:DPEPO is chosen as the host to improve charge balance and optimize exciton distribution. Moreover, a cascaded exciton energy transfer route is constructed to improve exciton utilization efficiency. The working mechanism of devices is illustrated by examining host effects in EMLs. Moreover, the carrier balance is further enhanced by optimizing the transport layer.   Results and Discussions   The bipolar exciplex host (TCTA:DPEPO) and traditional host DPEPO are comparably investigated in blue TADF devices (Fig.1). By modulating the thicknesses of light-emitting layers, high-efficiency hybrid TADF/phosphorescent WOLEDS based on exciplex host have been achieved with excellent color stability and a high color rendering index (CRI) of 88 (Fig.3). The comparison experiment shows that the outstanding performance of hybrid TADF/phosphorescent WOLEDs is attributed to the widened exciton recombination region and reasonable exciton utilization routes (Fig.4). In addition, by optimizing the electron transport layer, the power efficiency is further improved, achieving maximum values of 52.6 lm·W−1 and 19.3% for power efficiency and EQE, respectively (Fig.6).   Conclusions  High efficiency, color stable and low efficiency roll-off TADF/phosphorescent hybrid WOLEDs based on exciplex host are achieved. In the proposed WOLEDs, an exciplex host is utilized in EMLs to broad exciton recombination region and a cascaded exciton energy transfer route is constructed to improve exciton utilization. Hybrid WOLEDs exhibit excellent color stability and low efficiency roll-off. Maximum values of PE and EQE are 36.4 lm·W−1 and 17.5% (maintaining 18.2 lm·W−1 and 12.3% at 1000 cd·m−2), respectively. With balanced white emission, the WOLED reaches a CIE of (0.451, 0.428) and a high CRI of 88. By further optimizing the transport layer of WOLEDs, the EQE is further improved to 19.3%, and a maximum power efficiency of 52.6 lm·W−1 and a CRI of 90 are achieved. The design strategy proposed in this study provides a simple but feasible approach for high performance hybrid TADF/phosphorescent WOLEDs.
Study on preparation and infrared properties of FeS quantum dots and their composite films
Zhang Taiwei, Hu Kun, Li Guobin, Li Xueming, Tang Libin, Yang Peizhi
2023, 52(12): 20230489. doi: 10.3788/IRLA20230489
[Abstract](136) [FullText HTML] (17) [PDF 1876KB](35)
  Objective  Compared with other quantum dots (QDs), infrared QDs have narrower band gaps, wider absorption ranges, and longer fluorescence wavelengths. Therefore, they show greater potential in areas such as bioimaging, tumor treatment, photodetector and solar concentrators. As transition metal chalcogenides (TMCs), FeS QDs are promising infrared detection materials due to their narrow band gap, low toxicity, and strong near-infrared absorption. Forming therm into thin films is an effective approach to enhance the stability and processability of QDs. At present, the research about FeS mainly focuses on nanofilms and nanoparticles, and there are few reports on FeS QDs and their composite films. In this paper, we studied the preparation of FeS QDs by liquid-phase ultrasonic exfoliation, and prepared FeS/PVA composite films by mixing FeS QDs with polyvinyl alcohol (PVA). We tested and analyzed the infrared characteristics of FeS QDs in order to explore their potential applications in the field of infrared, and its application in the field of infrared optics was prospected.  Methods  FeS QDs solution was prepared by liquid phase ultrasonic exfoliation method. The preparation steps were as follows: 0.15 g of FeS powder (purity ≥99.9%) was weighed and placed in a mortar, followed grinding for 2 h. The ground FeS powder was then mixed with 50 mL of isopropyl alcohol (IPA, purity ≥99.7%) dispersant, and placed in the ultrasonic instrument at 120 W power for 2 h. After ultrasonic, the solution was centrifuged at 500 r/min for 5 minutes, taking out the supernatant, FeS QDs solution was obtained. Collect in a reagent bottle for further use.  FeS QDs/PVA nanocomposite films were prepared using a blending method, following the steps below: 0.4 g of PVA powder was weighed and added to a beaker containing 20 mL of deionized water. The mixture was placed on a magnetic heating stirrer and continuously stirred at elevated temperature for 45 min until the powder was completely dissolved. Then, 4 mL of the FeS QDs solution was added to the mixture, and the heating and stirring kept on an additional 15 min. Subsequently, 4 mL of the mixed solution was drop-cast onto a metal sample holder, and the film was formed by heating the sample holder on a heating plate at 40 ℃ for 4 h.   FeS QDs were characterized and analyze for size, morphology, structure, and elemental composition using transmission electron microscopy (TEM), atomic force microscopy (AFM), and energy spectroscopy (EDS). The phase composition and bonding properties of FeS QDs were analyzed by X-ray photoelectron spectroscopy (XPS), X-ray diffraction (XRD), Fourier transform infrared spectroscopy (FTIR), and Raman spectroscopy. The optical properties of FeS QDs and FeS QDs/PVA nanocomposite films were studied using UV-Vis spectrophotometer and fluorescence spectrometer.  Results and Discussions   Both FeS QDs and FeS QDs/PVA nanocomposite films exhibit significant absorption and luminescence characteristics in the infrared band (Fig.4(a), (b), (c)). As the excitation wavelength increase, the PL peak of the FeS QDs/PVA nanocomposite film shows a clear redshift, which shows obvious Stokes shift and excitation wavelength dependence (Fig.5(e)).  Conclusions  FeS QDs with an average particle size of 8.1 nm were successfully prepared by liquid phase ultrasonic exfoliation method. FeS/PVA nanocomposite films were prepared by blending FeS QDs with PVA. UV-Vis tests show that FeS QDs and FeS/PVA nanocomposite films exhibit absorption from ultraviolet to infrared band (200-2500 nm). PL test shows that they have photoluminescence in infrared band. PL peaks show significant redshift and Stokes shift, indicating that both are wavelength dependence. In addition, FeS/PVA nanocomposite film shows excellent infrared optical properties, especially the absorption and luminescence characteristics in the infrared band. These results show that FeS QDs and its nanocomposite films have important application potential in the field of infrared optics, and provide a new idea for the development of infrared optical devices.
Photoelectric measurement
Spectral calibration method for mid-infrared AOTF imagers
Yu Kai, Guo Qi, Li Na, Cheng Chi, Zhao Huijie
2023, 52(12): 20230291. doi: 10.3788/IRLA20230291
[Abstract](86) [FullText HTML] (12) [PDF 3659KB](24)
  Objective  Spectral drift poses a unique challenge when observing moving targets using acousto-optic tunable filter (AOTF) spectrometers. Therefore, there is a need for an online spectral calibration method based on acousto-optic interaction. Utilizing the imaging position of the target spectrum and driving frequency, a reverse ray tracing model was constructed to achieve real-time calibration of the spectral data, ensuring stability and accuracy for subsequent detection, recognition, and tracking of the target. The developed mid-infrared AOTF spectral detection system with parallel entering light was employed for experimental verification. The results demonstrate that the correction accuracy of spectral drift is better than 4.45% for simulated moving targets with different fields of view. This improvement is beneficial for enhancing the application capabilities of spectral detection for moving targets.   Methods  To address the issue of drift in mid-infrared AOTF spectral data under parallel light incidence conditions, a spectral calibration method based on the model of acousto-optic interaction is proposed. Initially, the principles of AOTF are briefly introduced, highlighting the use of a parallel light incidence structure to mitigate axial chromatic aberration in the mid-infrared band. The specific spectral calibration methods are then outlined. The reverse ray tracing method is employed, enabling the direct calculation of the spectrum from real-time image coordinates of the target and driving frequency (Fig.2). This involves computations such as refractive index calculation in three-dimensional space, coordinate system transformation, momentum matching, and more. Under ideal conditions, simulations of frequency drift in the image plane are conducted. The proposed spectral calibration method is experimentally validated using a self-developed prototype in the laboratory, and the performance parameters are presented in Tab.1. Importantly, as the proposed method is based on the acousto-optic mechanism model, no hardware modifications, such as changes to the optical structure, are required. This online spectral calculation method meets the application requirements for detecting the spectrum of moving targets.   Results and Discussions   The validation experiment for dynamic spectral correction involves using a combination of a high-temperature blackbody and infrared filters as a narrowband light source. To simulate the moving target, sampling points are set (Fig.6). Initially, by selecting the region of interest (ROI), the frequency response at different positions of the target can be obtained. Experimental results indicate that the frequency response of the same target varies with different fields of view (Fig.7), leading to drift in the calculated target spectrum from the tuning curve. The method proposed in this article is then utilized to calibrate the target spectral response, resulting in a significant suppression of spectral drift before and after calibration. The spectral drift of the full field of view can be controlled within 4.45%. However, there are still some errors after spectral calibration. Firstly, the spectral full width at half maximum (FWHM) of AOTF varies with the field of view (FOV), which was not considered in the model. Secondly, there is a fitting error in the installation and adjustment of the system. Thirdly, random sampling errors occurred during the experimental process.   Conclusions  The spectral data of aerial moving targets obtained by the AOTF spectral detection system may drift with FOV, affecting the extraction of spectral features and subsequently being unable to ensure stable tracking of the target. The spectral correction method based on the principle of acousto-optic interaction can perform real-time correction of the spectra of moving targets. Laboratory validation experiments have shown that the calibration method can effectively suppress spectral drift. After calibration, the accuracy of the spectral data cube of target can be ensured. The work of this article has certain significance for AOTF spectral detection from static targets to moving targets.
Design of non-contact measurement system for ethanol concentration using near infrared spectrometry characteristics
Wang Tian, Wu Wei, Zhang Ziyunxin
2023, 52(12): 20230510. doi: 10.3788/IRLA20230510
[Abstract](457) [FullText HTML] (95) [PDF 1471KB](80)
  Objective   The non-contact measurement of ethanol concentration represents a novel approach to concentration measurement, offering significant advantages for specialized industries such as medical, wine, and industrial alcohol. To facilitate non-contact ethanol measurement, a dedicated ethanol concentration measurement system has been designed based on the characteristics of infrared spectrometry. This system enables continuous and contactless measurement of varying concentrations of ethanol.   Methods   In the context of ethanol, the spectral characteristic response is highly sensitive in the 1,300-1,350 nm range of the near-infrared band. Therefore, an infrared LED light-emitting diode emitting in this band is employed as the light source, and a photodiode sensitive to this band is chosen as the receiver. When exposed to light, the photodiode generates a weak reverse current, which is then converted into a voltage signal by the transimpedance amplifier. Subsequently, an A/D converter chip is utilized to collect the voltage signal. Using this system, the relationship between ethanol concentration and the voltage signal can be determined by measuring different concentrations of ethanol. Consequently, the ethanol concentration value can be obtained by measuring the corresponding voltage value.   Results and Discussions   The experiment demonstrates a robust quadratic function relationship between the voltage and ethanol concentration in the infrared band. The results reveal a high correlation coefficient of 0.999 11, with an average absolute error of 0.64. This level of error is comparable to that of traditional ethanol measurement devices (0.5), affirming the feasibility of the device. Further optimization of the circuit and program has the potential to reduce errors. Compared to traditional measurement methods, this approach boasts advantages such as a simple structure, faster operation, and the capability for continuous measurement.   Conclusions   The device designed for measuring ethanol concentration holds significant value in various industries such as winemaking and medicine, where precise measurements are crucial. Its non-contact measurement capability ensures that the product remains undamaged during the testing process. Moreover, the device's continuous detection capability is particularly advantageous for industries requiring real-time monitoring. With further enhancements, there is potential for achieving automated detection, adding another layer of efficiency to the measurement process.
3D reconstruction of the moving object with double-shooting based on phase shifting profilometry
Zhang Qinghui, Li Hao, Lv Lei, Lu Shenglin, Pan Wei
2023, 52(12): 20220891. doi: 10.3788/IRLA20220891
[Abstract](62) [FullText HTML] (27) [PDF 2579KB](24)
  Objective  Phase shifting profilometry (PSP) is one of the most commonly used techniques in 3D measurement, which has the advantages of high accuracy and robustness to ambient light and reflectivity variation. During the reconstruction of PSP, at least three sinusoidal fringe patterns with phase shift are projected onto the surface of the object; the camera captures the ones reflected from the object. Because of the height of the object, the fringe patterns on the object surface will have distortions. The phase information existing in the fringe pattern is employed to analyze the deformation of the fringe patterns. At last, the object is reconstructed based on the phase information and system parameters. Because of multiple fringe patterns are used, the traditional PSP requires the object must be kept stationary during the reconstruction process. Errors will occur if the object moves during the fringe projecting and capture process. However it is difficult to meet this requirement in dynamic scenes. Therefore, it is important to improve the reconstruction accuracy of moving object. For this purpose, a new method with high frame rate and accuracy is proposed based on PSP.   Methods  This paper proposes a new method to reduce the measurement error caused by moving objects at dense frame rate. First of all, trigger control equipment is added to the camera and projector. The equipment ensures that, for each projection, two consecutive images are captured before the next projection (Fig.1). Then, the phase retrieval algorithm is proposed. As there is no fringe pattern shift among the captured two images of the same projection, the phase shift is introduced by the object motion. By analyzing the phase variation caused by the motion, the reconstruction model describing the fringe patterns with motion is given. At last, the object is reconstructed based on the phase information and system parameters. The proposed algorithm can achieve high frame rate for the reconstruction of object with motion (Fig.2).   Results and Discussions   The experiments are implemented to verify the performance of the proposed method. The moving object is captured twice in one projecting period (Fig.5). Then, the phase information is retrieved by the proposed method (Fig.6(a)). At last, the object is reconstructed successfully (Fig.6(b)). In order to compare the performance, the same fringe patterns are reconstructed by the traditional PSP and the result is shown in Fig.7. It is apparent that errors have been introduced. By using the data obtained with the static object as true value, the RMS error and mean error are calculated (Tab.1). With the traditional PSP, the RMS error and mean error are 4.918 6 mm and −0.085 1 mm. With the proposed method, the RMS error and mean error are 0.001 9 mm and 0.003 6 mm.   Conclusions  This article proposes a dual sampling method for reconstructing moving objects based on phase-shifting profilometry. Under the condition of limited device frame rate, the reconstruction frame rate of moving objects can be effectively improved. Firstly, by controlling the synchronization signal between the camera and projector, it is possible to capture the same projected fringe pattern twice to obtain more object motion information. Then, the stripe description of the moving object was analyzed and the phase information under mixed phase shift was extracted; Finally, utilizing stripe multiplexing improved the frame rate of motion object reconstruction.
Materials & Thin films
Lasers & Laser optics
Research on surface roughness modeling based on multiple feature parameters of laser speckle image
Wu Pengfei, Deng Zhizhong, Lei Sichen, Tan Zhenkun, Wang Jiao
2023, 52(12): 20230348. doi: 10.3788/IRLA20230348
[Abstract](113) [FullText HTML] (21) [PDF 3354KB](29)
  Objective  Speckle method stands out as one research hotspots in the realm of surface roughness measurement, boasting advantages such as low loss, high-temperature resistance, and high reliability. As the scenarios for surface roughness measurement grow in complexity and precision requirements continue to escalate, a novel surface roughness modeling method based on multiple feature parameters of laser speckle images has been proposed. This method is grounded in multiple feature parameters extracted from laser speckle images. However, the modeling process using this approach confronts challenges related to feature correlation and redundancy. The presence of irrelevant or redundant features in the modeling process can result in prelonged feature extraction times, heightened computational costs, and increased model complexity. Furthermore, these features can detrimentally affect the accuracy and stability of the model. To address these issues, a method is proposed to alleviate feature correlation and redundancy during surface roughness modeling. Simultaneously, the selected features are designed to facilitate the measurement of surface roughness across various processing types.   Methods  Introducing Spearman's correlation coefficient, we aim to establish succinct rules for the effective screening of laser speckle image feature parameters that exhibit strong correlations with the surface roughness evaluation parameter Ra for each processing type (Tab.1). To address redundancy among feature parameters, an enhanced sequential backward selection algorithm is employed. Subsequently, laser speckle images from various peocessing types, including plane grinding, horizontal milling, vertical milling, and grinding polishing standard specimens, were acquired through experiments (Fig.2, Fig.3). Utilizing these collected laser speckle images, we constructed a surface roughness measurement model based on support vector machines. The method's efficacy was then validated through comprehensive verification processes.   Results and Discussions   From the gathered later speckle images, a total of 27 feature parameters were initially extracted. By introducing Spearman's correlation coefficient and formulating simple rules, we identified 8 feature parameters {E, S, I, H, Bent, κ, σ, υ} strongly correlated with the surface roughness evaluation parameter Ra for each processing type. Then, redundant feature parameters H, κ and σ were effectively eliminated using an improved sequence backward selection algorithm. This process not only addressed the issues of feature correlation and redundancy but also led to the establishment of a surface roughness measurement model incorporating the selected feature parameters{E, S, I, Bent, υ}. The resulting model demonstrated a remarkable 100% recognition rate for processing type and exhibited high-precision measurement of surface roughness (Tab.7, Tab.8). In addition, the enhanced sequential backward selection algorithm contributed to a reduction in the MAPE for the surface roughness measurement model across different specimens: plane grinding, horizontal milling, vertical milling, and grinding polishing. The reductions were 1.22%, 0.62%, 4.99% and 1.61%, respectively.   Conclusions  The proposed method effectively addresses the issues of feature correlation and redundancy in the process of surface roughness modeling, leveraging multiple feature parameters extracted from laser speckle images. By eliminating irrelevant and redundant features, the method prevents unnecessary consumption of feature extraction time and reduces model calculation costs. The resulting model exhibits enhanced stability and accuracy. Experimental results demonstrate the effectiveness of the model established using the selected feature parameters. It achieves a 100% recognition rate for processing types such as plane grinding, horizontal milling, vertical milling, and grinding polishing specimens. Moreover, the MAPE for surface roughness prediction is reduced to 3.55%, 3.10%, 3.17%, and 2.27%, respectively. These reductions represent improvements of 1.22%, 0.62%, 4.99%, and 1.61% compared to the model's perfomance before removing redundant features.
Research progress of excimer laser annealing in semiconductor integrated circuit manufacturing
Yu Xuehao, Fang Xiaodong, You Libing, Wang Yizhe, Liu Molin, Wang Hao
2023, 52(12): 20230285. doi: 10.3788/IRLA20230285
[Abstract](152) [FullText HTML] (59) [PDF 7133KB](46)
  Significance   In the dynamic landscape of semiconductor device fabrication, continual advancements strive to enhance the process. As the density of transistors per unit area increases and chip components become progressively smaller, the challenges in chip production grow in both intricacy and difficulty. Traditional methods like furnace annealing are becoming inadequate for the evolving demands of chip manufacturing. To address the intricacies posed by shrinking device sizes, annealing techniques and process parameters undergo constant refinement. Pulsed laser annealing emerges as a noteworthy solution, capable of precisely irradiating specific material areas in extremely brief intervals. This technique, harnessed by absorbing laser energy, rapidly elevates the material surface temperature to induce melting. The consequential reconstruction of the melt layer's crystal structure, coupled with redistributed doping in the crystal, serves the crucial purpose of eliminating defect-activated doping. The excimer laser, operating as a nanosecond pulsed ultraviolet laser, holds distinctive attributes that render it particularly meaningful in semiconductor manufacturing annealing technology. Its short wavelength, narrow pulse width, and minimal material penetration depth, especially in semiconductor materials like silicon, contribute to high absorption rates. Moreover, excimer lasers boast high resolution in focusing or projection, coupled with substantial single-pulse energy. This inherent flexibility allows for shaping the energy distribution of the pulse spot, offering adaptability to diverse requirements. These defining characteristics underscore the significance of excimer laser research in advancing semiconductor manufacturing annealing technologies.   Progress  To optimize the annealing effect in semiconductor manufacturing, it is crucial to shorten the thermal annealing time window and carefully regulate peak temperatures. Controlling the temperature gradient from the material's surface to its interior is a pivotal consideration in annealing technology. Laser annealing is a superior alternative, offering more precise thermal budget control when compared to other methods, as illustrated in Fig.1. Additionally, the perspective of K. Huet et al. on laser thermal budget is presented. Researchers have explored the application of laser annealing in ion doping and epitaxial layer growth. The evolution of doping concentration across different substrates and dopants under excimer laser conditions has been thoroughly investigated. Brief insights into strain silicon technology and silicon on insulator technology are provided, showcasing their integration into semiconductor manufacturing for enhanced device performance. Excimer lasers have been employed by researchers to delve into devices utilizing strained silicon technology and silicon on insulator technology. In the continuous evolution of semiconductor manufacturing processes, there is ongoing innovation in the metal layer. Laser annealing treatment of the metal layer has garnered increased attention, with the reasons for this emphasis briefly explained. Notably, researchers have scrutinized the annealing of metal layers using excimer lasers. The paragraph concludes by briefly addressing the challenges associated with three-dimensional integrated circuit architecture (refer to Fig.27). Manufacturing three-dimensional integrated circuits poses difficulties, particularly in potential damage to the underlying metal and devices during upper-layer annealing. Excimer lasers have emerged as a research focus to address these challenges and optimize the annealing process for three-dimensional integrated circuits.  Conclusions and Prospects   Excimer laser annealing stands out as a superior choice when compared to alternative annealing methods, particularly evident in the realm of semiconductor integrated circuit manufacturing. The distinct advantages of excimer laser annealing manifest in its exceptional ability to significantly reduce the thermal budget while enabling precise control over the annealing effect. This accuracy proves pivotal in semiconductor manufacturing processes. Moreover, excimer laser annealing brings noteworthy benefits to the table, including the facilitation of high-density doping with enhanced doping activation efficiency. Its unique capacity to distribute doping atoms more effectively and control junction depth contributes to its prominence in the semiconductor industry. The application of excimer laser annealing on metal layers introduces additional advantages. It effectively augments the grain size of the metal, curbing electron boundary scattering, thereby reducing resistivity. This not only enhances the reliability of the metal but also allows for superior thermal budget control. In the context of three-dimensional integrated circuits, excimer laser technology emerges as a transformative solution. It proves highly adept at reducing the thermal budget, a critical consideration in enhancing device stability within these intricate structures. Furthermore, its promising potential lies in addressing the challenges associated with annealing effects on the dopant distribution of the top layer. Excimer laser annealing, with its multifaceted advantages, thus emerges as a promising and versatile solution for optimizing semiconductor manufacturing processes, particularly in the context of three-dimensional integrated circuits.
Quantitative analysis of coaxial zoom laser-induced breakdown spectroscopy
Li Xin, Lv Zhengyi, Cui Bolun, Zhang Jiaming, Liu Ziying, Huang Xun, Zhao Tianzhuo
2023, 52(12): 20230310. doi: 10.3788/IRLA20230310
[Abstract](75) [FullText HTML] (26) [PDF 2375KB](21)
  Objective  In in-situ analysis applications, where the promise of laser-induced breakdown spectroscopy (LIBS) is significant, the use of fixed analysis distances often proves impractical. Zoom-LIBS, with its greater flexibility, emerges as a more viable solution. The typical structure of a zoom-LIBS system employs a coaxial light path for both excitation and collection. This design enables precise laser focusing on the object's surface at various distances by adjusting the focal length of the telescope. However, the adjustment in focal length induces changes in the plasma state and system efficiency. Consequently, the LIBS equipment collects plasma spectra with varying intensities and characteristics. Integrating these spectra directly into a quantitave model for accurate inversion results becomes challenging. Moreover, standardizing plasma spectra after accurately calibrating equipment parameters at all analysis distances is a complex task, especially considering the diverse application scenarios of zoom-LIBS equiptment. To address these challenges, this paper proposes a reference pulse diagnostic method. This innovative approach allows the diagnosis of plasma temperature without the need for calibration equipment. Subsequently, the plasma spectra collected at different analysis distances can be corrected, facilitating accurate zoom-LIBS quantitative analysis.   Methods  The reference pulse diagnostic method consists of three key steps. Firstly, two lasers with power densities P1 and P2 are used for plasma excitations, where one serves as an analysis pulse and the other as a reference pulse. Following the principles of plasma radiation theory, the ratio of the intensity of atomic lines at the same wavelength in the two acquired spectra is computed. This ratio, denoted as V1, is a function of the plasma temperature. In the seconde step, the ratio of the intensity ratio of the ion line to the atomic line in the spectra generated by both the excitation pulse and the reference pulse is calculated. This ratio, denoted as V2, is also a function of the plasma temperature. In the third step, the plasma temperature is determined by solving for it using the values of V1 and V2. Once the diagnostic method is completed, and through spectral standardization or alternative techniques, the plasma spectra collected at different analysis distances are restored to their respective distances. This facilitates the establishment of a quantitative model, enabling the realization of zoom-LIBS quantitative analysis.  Results and Discussions   A set of aluminum-based standard samples was used to verify the zoom-LIBS quantitative analysis based on the proposed reference pulse diagnostic method. Initially, the results obtained from this method were compared with the Saha-Boltzmann method, revealing a maximum relative error of not more than 8%. To highlight the correction effect of this method, a basic multivariate linear model (principal element) and univariate linear models (for other elements) were used to establish a quantitative model at 2 m for nine standard samples. Additionally, four standard samples were analyzed at distances of 1.5 m, 2 m and 3 m, respectively. For elements with content exceeds 1%, only the relative error of the abundance of Si in sample No. 11 was around 16%, while the rest were all less than 8%. Most elements with a content of less than 1% exhibited a relative error ranging between 10% and 30%. This demonstrates that the proposed method can achieve quantitative analysis of zoom laser-induced breakdown spectroscopy in an in-situ detection environment, broadening the application space of laser-induced breakdown spectroscopy technology. Four standard samples were analyzed at distances of 1.5 m, 2 m, 2.4 m, 2.7 m and 3 m. In the inversion results, except for the relative error of Si element in sample 11, which is 16% for elements with a content of more than 1%, most of the rest are less than 8%. Additionally, most of the elements with a content of less than 1% exhibited a relative error between 10% and 30%. Theses results confirm that the proposed method can achieve quantitative analysis of zoom-LIBS in an in-situ analysis environment.   Conclusions  While some error amplification may occur due to the division form used in the final step of the reference pulse diagnostic method, it facilitates a relatively accurate diagnosis of plasma temperature. Further precision in diagnosis results could be achieved by carefully selecting more appropriate spectral lines. An alternative and potentially superior approach involves directly performing plasma spectral correction based on the values of V1 and V2. This quantitative analysis method for zoom-LIBS, rooted in the physical model of plasma radiation, holds the potential to broaden the application scenarios of zoom-LIBS. Additionally, it serves as a valuable reference for the design of zoom-LIBS equipment.
Linear constraint approach for calibrating distance of base point in laser tracking interferometer system
Chao Xiangzhang, Diao Xiaofei, Kang Yanhui, Fan Xinrui, Lei Lihua, Liu Liqin
2023, 52(12): 20230288. doi: 10.3788/IRLA20230288
[Abstract](57) [FullText HTML] (23) [PDF 1821KB](21)
  Objective  To ensure the high precision of robot operations, it is imperative to calibrate the robot, enhancing its absolute positional accuracy. The most commonly employed method is the distance error model, which requires obtaining distance information between the robot's end-effector and the measurement device. While laser trackers are widely used due to their high accuracy in directly measuring the position information of the end-effector, they are general-purpose and often expensive devices with many features that go unused in the context of robot calibration. To address these concerns, a custom-designed Laser Tracking Interferometer System (LTIS) has been developed for scenarios requiring high accuracy at a lower cost. The LTIS comprises a tracker module and an interferometer module. In this system, a reference point, termed the base point, is essential for measuring absolute distances. All distances measured by the LTIS are referenced to this base point. Consequently, the accuracy of the distance from the LTIS to the base point, known as the Distance of Base Point (DBP), is crucial as it directly influences the overall accuracy of the LTIS. Designing a high-accuracy calibration method for the DBP is essential for achieving precise and cost-effective robot calibration in various applications.  Methods  The present study introduces a novel method for calibrating the Distance of Base Point (DBP) in a LTIS using a linear constraint approach. As only the DBP is needed in robot calibration, the outgoing light of the laser interferometer is employed as the x-axis to establish the coordinate system (Fig.2). The constraint points utilized for DBP calibration are situated on the line defined by the x-axis. The least square method is then applied to calculate the DBP. The optimal parameters for this calibration method are determined through a combination of theoretical analyses and simulations (Fig.3 and Fig.4). Finally, the proposed method is applied to calibrate the LTIS and obtain its DBP (Fig.5). To validate the calibration result, the DBP of the API radian tracker is calibrated and compared with the normal value (Fig.6).   Results and Discussions   The number and distribution of constraint points, as well as the layout of the calibration system, can significantly influence the calibration results, as indicated by theoretical analyses and simulations. The analysis results suggest that the constraint points used for calibration should be evenly and equidistantly distributed on the constrained line around the laser tracking system. Furthermore, the constraint points should be dispersed as widely as possible along the constrained line to ensure that the distances li measured by the LTIS exhibit noticeable differences, thereby reducing calibration errors. Optimal calibration parameters were determined through simulation experiments and actual experimental conditions. The constraint line was set to 3 400 mm, with 20 constraint points evenly and equidistantly placed on the x-axis, symmetrically positioned around the LTIS.   Conclusions  In the DBP calibration method for laser tracking interferometry based on the linear constraint approach, all constraint points used for calibration are distributed along a line. The interferometer measures the displacement of the target mirror along the linear direction to obtain the coordinate of the constraint point. Simultaneously, the LTIS measures the change in distance between the target mirror and the base point. The least squares principle is then employed to calculate the DBP. The weighted average DBP in the LTIS is found to be 290.076 4 mm, with a standard deviation of 4.4 μm. To validate this result, the DBP of an API radian laser tracker was calibrated using this method. The measured DBP of the API radian is 154.194 0 mm, with an error of 3 μm compared to the normal value. The API radian, which has an accuracy of 10 μm+5 μm/m in space, demonstrates that the linear constraint approach for calibrating the DBP in the Laser Tracking Interferometer System meets the requirements of robot calibration. This method holds significant importance for the industrial robot industry.
Experimental study on the factors influencing the penetration forming time of small holes processed by ultrafast laser
Bi Shuai, Zhang Xiaobing, Zhang Wei, Li Yuancheng, Ma Ning, Cai Min, Mao Zhong
2023, 52(12): 20230347. doi: 10.3788/IRLA20230347
[Abstract](74) [FullText HTML] (21) [PDF 4375KB](20)
  Objective  In the machining process of film cooling holes on turbine blades using ultrafast lasers, it is crucial to protect the opposite wall from laser damage. Typically, protective materials are filled into the blade cavity for this purpose. However, researchers have found that the use of these materials leads to a longer time for complete formation after hole penetration. If the elapsed time is insufficient, the hole exit will not be circular, and the quality of the hole wall will deteriorate. Conversely, if the processing time exceeds the optimal duration, the ultrafast laser may penetrate the protective materials, resulting in damage to the opposite wall. Additionally, the hole depth, aperture, and inclined hole angle of the film cooling hole vary in different areas of the blade, making it challenging to determine the optimal processing time accurately. Therefore, precisely controlling the processing time is crucial to ensure the quality of the film cooling hole and to prevent any damage to the walls.   Methods  In this study, superalloy samples with a sandwich structure and protective materials in the middle were utilized to simulate turbine blades with protective materials inside. The experiment involved drilling to examine the relationship between various factors, including hole depth, filling radius (dependent on hole aperture), inclined hole angle, and the penetration forming time of micro-holes machined by ultrafast lasers in filling mode (refer to Fig.3). The penetration forming time was automatically measured using online image recognition technology (see Fig.4). The criterion for image recognition was determined by the state in which the hole was almost formed without causing any damage to the wall. The curve of the test data was fitted using the nonlinear least square method.   Results and Discussions   In the 1-3 mm hole depth test, it was observed that the time required for small holes to penetrate increased exponentially rather than linearly with the depth of the circular hole (refer to Fig.7). The functional relationship between the penetration forming time of small holes and the hole depth was represented by the Gaussian function (see Fig.8). In the filling radius test, it was noticed that as the filling radius increased, the amount of material removed also increased, leading to a corresponding increase in penetration forming time (Fig.11). After fitting, it was determined that the Belehradek function (Fig.12) can be used to express the penetration forming time and filling radius of small holes in 2 mm and 2.5 mm test pieces. The drilling experiment at an inclined hole angle of 18.19°-60.00° revealed that the functional relationship between the penetration forming time of small holes and the inclined hole angle can be expressed using the Boltzmann function (Fig.16). Within this range, the larger the inclination angle, the less time it takes for the small hole to penetrate and form. The analysis suggests that tilting the test piece will cause certain areas of the small holes to undergo negative defocusing during processing, and higher laser ablation removal rates will expedite the formation of stable slag discharge channels. In response to the issue of non-circularity in forming small hole exits (Fig.6) without causing wall damage in filling mode, a drilling method was proposed. Initially, the hole was made in filling mode, with strict time control based on the hole depth, aperture, and inclined hole angle of the small holes. Subsequently, trepanning mode was employed to process and expand the small holes. This method successfully produces well-formed holes without damaging the opposite wall (Fig.17).  Conclusions  This article investigates the influence of hole depth, filling radius, and inclined hole angle on the penetration forming of small holes using ultrafast laser in filling mode, with the objective of achieving optimal results without causing any damage to the walls. Within the typical range of hole depth, aperture, and inclination angle for turbine blade film cooling holes, the relationships between hole depth, filling radius, and inclined hole angle with the time it takes for small hole penetration forming can be accurately described by the Gaussian function, Belehradek function, and Boltzmann function, respectively. Drawing from the research results, a drilling method was proposed to control the processing time in the filling mode and subsequently slightly enlarge the hole in the trepanning mode. This method ensures the creation of small holes that remain undamaged to the wall and have a rounded exit shape. The proposed approach provides a practical solution for achieving precise and high-quality results in the machining of film cooling holes.
Design and implementation of single pulse laser velocity and ranging scheme based on V-type chirp frequency modulation
Wu Ziyan, Sui Xiaolin, Liu Bo, Zhao Xiaolong, Yan Ziheng, Mei Bo, Zhang Yikang
2023, 52(12): 20230294. doi: 10.3788/IRLA20230294
[Abstract](93) [FullText HTML] (13) [PDF 4155KB](23)
  Objective  Lidar technology offers significant advantages in speed measurement, particularly due to its short-wavelength characteristics. Recent advancements have raised the bar for lidar, demanding higher laser ranging resolution and extended detectable distances. This has led to challenges in designing laser emission waveforms. To address this, frequency modulation (FM) signal modulation is applied to laser pulses, enhancing the capabilities of pulsed laser coherent radar for long-distance, high-precision speed and ranging measurements, especially for maneuvering targets. However, a challenge arises with the single-chirp FM signal of a moving target, where velocity-distance coupling issues can result in ranging errors due to Doppler mismatch. The existing dual-chirp matched filter method faces limitations in distinguishing the radial velocity direction. In response, a proposed solution involves the use of a dual-chirp V-shaped FM triangle filter. This innovative filter, coupled with a sophisticated data processing method, facilitates the measurement of single-pulse speed direction, value, and target distance, overcoming the limitations posed by conventional approaches.  Methods   The introduction highlights the limitations of both the single-chirp FM and double-chirp V-type FM matched filter methods in speed measurement. Theoretical calculations are then performed using the double-chirp V-type FM triangular filtering method to establish the relationship between speed and the filtered double peak value. The measurable speed value range is determined, considering the performance of existing devices, and a feasible waveform is designed accordingly. To validate the proposed approach, a laser coherence experimental platform is employed, utilizing a 1.55 μm laser for turntable speed measurement. The system incorporates a dual-lens structure for transmitting and receiving, with a 17.618 km delay fiber simulating long-distance targets to assess the impact of the system's components on actual ranging. The measurement effects of the double-chirped V-type matched filter and double-chirped triangular filter are then compared. Finally, the study includes the measurement of rotating disks with varying speeds of optical fibers, from which relevant data are obtained. Precision and accuracy analyses are conducted to evaluate the effectiveness of the proposed double-chirp V-type FM triangular filtering method (Tab.1 and Tab.2) for speed measurement. The results are presented in figures (Fig.6 and Fig.7) to illustrate precision and accuracy aspects.   Results and Discussions   Using the coherent laser measurement experiment platform, actual sampling data with 17.618 km time-delay optical fibers are analyzed. The dual-chirp V-shaped FM matched filtering scheme is compared and verified, demonstrating its advantages in radial velocity direction measurement. The results of distance measurements with multiple pulses are illustrated in Fig.6 (a), showcasing a precision of 0.33 m. In the wheel speed range from −0.91 m/s to −3.67 m/s with a 0.92 m/s step, the speed measurement precision ranges are 0.055 m/s, 0.061 m/s, 0.058 m/s, and 0.045 m/s (Fig.6 (b)). Concurrently, the speed measurement results are fitted with the set values in Fig.6 (c), achieving fitting coefficients of 0.997 1. The accuracy of speed measurement is effectively verified.  Conclusions  The single-pulse double-chirp V-type frequency modulation waveform is designed to meet the requirements of extending the farthest detection distance, improving distance resolution, and achieving high-precision radial velocity measurement. The triangular filtering method employed in this waveform enables the measurement of target distance, velocity value, and velocity direction. This approach accurately reflects changes in the target's movement, providing a valuable reference for determining the motion vector of a three-beam target. The application prospects for this methodology are promising, particularly in fields such as ship navigation trajectory measurement, unmanned aerial vehicle flight measurement, airborne measurement, and other related domains.
Materials & Thin films
Study on the response characteristics of multilayer optical elements to beam linewidth
Yang Shiqi, Cao Yuanrui, Yang Xiao, Bai Jinlin, Meng Yang, Liu Huasong
2023, 52(12): 20230574. doi: 10.3788/IRLA20230574
[Abstract](57) [FullText HTML] (12) [PDF 1742KB](16)
  Objective   Multilayer films are critical optical elements for beam energy control in optical systems, and their quality directly influences optical system performance. Ideal monochromatic light serves as the foundation for the design of multilayer optical elements. But there is spectral linewidth in the actual beam. The optical characteristics of the element will differ from the theoretical value and may even result in total failure when operating in non-monochromatic light. In the established convolution model, the calculation technique utilizes monochromatic light conditions to determine the interference superposition of beams in the film, hence disregarding the quasi-monochromatic light interference effect. Based on this, the author proposes a calculation method for the optical properties of multilayer films under quasi-monochromatic light conditions and uses partial coherence theory to calculate the interference superposition of quasi-monochromatic beams.   Methods   A technique for estimating the optical characteristics of multilayer films in quasi-monochromatic lighting is proposed as a solution to this issue. To quantitatively quantify the linewidth and spectrum distribution of quasi-monochromatic light beams, the normalized power spectral density function is developed. Additionally, partial coherence theory is used to determine the irradiance of quasi-monochromatic light fields at the film interface. This study presents the design of a narrow-band filter with a passband ripple without collapse, a bandwidth of 4.29 nm, a center wavelength of 1 064 nm, and a Rectangle degree of 0.66 (Fig.2). Numerical simulation experiments are used to discuss how substrate thickness, spectral line-shape profile, and beam linewidth affect the optical characteristics of narrow-band filters.  Results and Discussions   As illustrated in Figure 4, for Gaussian, Lorentz, and rectangular line-shape, the Full Width at Half Maximum (FWHM) drops initially and subsequently increases as linewidth increases. The corresponding lowest values are 3.85 nm, 4.08 nm, and 3.74 nm. And these minimal values correspond to linewidth of 4.5 nm, 2.5 nm, and 5.5 nm, respectively. There is a similar shift trend for the three line-shape conditions for the transmission line's Rectangle Degree (RD). When the linewidth is less than 4 nm, the RD decreases rapidly with the increase of the linewidth. RD steadily diminishes when the linewidth is larger than 4 nm. Under different line-shape conditions, the relationship between the Tmax of the transmission spectrum and the linewidth has a significant difference. The beam linewidth and spectra line-shape profile have an important influence on the shape of the spectral line. The increase of the linewidth will lead to the decrease of the transmittance and the variation of the RD. The spectral line-shape profile establishes the precise link between the transmittance, FWHM, and RD with the linewidth. With the right choice of line width value, the FWHM can obtain the smallest value. Figure 7(a) illustrates how, for a given set of four beam linewidths, Tmax progressively drops as substrate thickness increases. This decline is limited to 0.8% and is dependent on both the substrate's thickness and extinction coefficient. The smaller the extinction coefficient of the substrate, the smaller the decrease. Tmax dramatically drops as linewidth increases when substrate thickness remains constant. The examination of Figure 7(b) demonstrates that, in the case of a constant line width, the FWHM essentially stays constant as the substrate's thickness increases. The FWHM first rises and then falls as the linewidth increases, while the thickness stays constant. It is evident that the transmission spectrum's FWHM, passband shape, and Tmax of the narrow-band filter are all significantly influenced by the beam linewidth, while the substrate's thickness primarily determines the transmission spectrum's passband shape.   Conclusions   This research offers a calculating technique for the optical properties of multilayer films under the condition of quasi-monochromatic light incidence based on partial coherence theory, which can be used to analyze the response characteristics of multilayer optical elements to beam linewidth. Numerical experiments are used to investigate how substrate thickness and beam linewidth affect narrow-band filter performance. Numerical results demonstrate that the narrowband filter's response characteristics are significantly influenced by the beam linewidth and the power spectral density function's line-shape. The incident beam must satisfy the following requirements in order to guarantee the narrow-band filter's passband form: the beam linewidth must be less than half of the theoretical FWHM of the filter, and the spectral line-shape profile must have a tendency toward a rectangular distribution. This study is informative for the design and application of multilayer optical elements in coherent optical systems.
Effect of La doping on structure and properties of Y2O3/Diamond films
Cao Shuqin, Huang Yabo, Chen Liangxian, Liu Jinlong, Wei Junjun, Lian Weiyan, Zhao Zhihong, Yang Zhenjing, Chen Xiaoyi, Peng Zhiyong, Xing Zhongfu, Li Chengming
2023, 52(12): 20230240. doi: 10.3788/IRLA20230240
[Abstract](50) [FullText HTML] (15) [PDF 3307KB](13)
  Objective  With its extremely high thermal conductivity, hardness and excellent infrared transmission properties, diamond is the most ideal material for infrared windows under extreme conditions. However, since the theoretical infrared transmittance of diamond is only 71%, further development of diamond surface anti-reflection coating has become a key step in the improvement of diamond infrared window. Compared with the traditional infrared anti-reflection coating, Y2O3 has lower refractive index, wider anti-reflection band and stable optical properties, which is an ideal diamond infrared anti-reflection coating, but poor mechanical properties make it difficult to prevent external damage in extreme environments. In the current study, the mechanical properties can be changed by changing the phase structure of the anti-reflection membrane itself, but it is difficult to improve the mechanical properties by changing the growth parameters for phase regulation. Rare-earth doping can effectively change the structure of the matrix material and improve its performance.   Methods  The Y2O3 film deposited by the magnetron sputtering method has strong adhesion and high purity of the membrane layer. Moreover, the oxygen-argon ratio can be controlled in the process of preparing the oxide film, which is more conducive to obtaining the oxide film close to the stoichiometric ratio. Therefore, undoped and La-doped Y2O3 films were prepared on mono-crystalline silicon and poly-crystalline CVD diamond by magnetron sputtering method. During the RF reaction sputtering, the target atoms of Ar plasma react with the reaction gas O2, and the Y2O3 film is deposited on the substrate surface. By adjusting the RF sputtering power of the doped element La target, the doping content of La element is adjusted.   Results and Discussions   The composition, structure and properties of La-doped Y2O3 anti-reflection films were studied. X-ray photoelectron spectroscopy (XPS) and graze-incidence X-ray (GIXRD) studies show that metal La interacts with O and exists in Y2O3 films in the form of La-O compound. The undoped Y2O3 films show cubic (222) columnar crystal orientation, and with the increase of La doping power, the films show monoclinic Y2O3 crystal orientation (111). It can be observed by scanning electron microscopy (SEM) that Y2O3 films with different La doping power show columnar crystal structure and good crystal quality. Atomic force microscopy (AFM) confirms that La-doped Y2O3 films have lower roughness (RMS) values than undoped Y2O3 films. In the La-doped Y2O3 films, the grain size of the columnar crystals decreases significantly with the increase of La concentration. In the long-wave infrared range of 8-12 μm, the maximum transmittance of La-doped Y2O3/Diamond film is 80.3%, which is 19.8% higher than that of CVD diamond film. La-doped Y2O3 films with fine particles have higher hardness and elastic modulus. The hardness increases from undoped (12.02±0.37) GPa to (14.14±0.39) GPa, and the elastic modulus increases from (187±14) GPa to (198±7.5) GPa.   Conclusions  After La-doped Y2O3 film, the grain was refined and the roughness decreased. La-doped Y2O3 film was subjected to the maximum transmittance increasing from 67% to 80.3% (LWIR), and the optical performance was significantly improved. In addition, the mechanical properties of the La-doped Y2O3 films were improved. The main reason for this phenomenon is mainly attributed to the presence at the grain boundary of Y2O3 film after La doping, which hinders the growth of Y2O3 grains to play the strengthening of fine crystals and improves the mechanical properties of the film. The results show that compared with the undoped Y2O3 films, the La-doped Y2O3 films obtain higher hardness through fine crystal strengthening under the condition of keeping higher infrared transmittance, which is conducive to improving the erosion properties of sand and rain erosion.