


-
In recent years, terahertz radiation in the range of 0.1-3 THz has been used to analyze the internal structure of a large number of materials and elements including multilayer composites, which are opaque under the visible and infrared irradiations. In addition, analysis by using THz radiation achieves determination of the thickness of the inner layers and may define hidden defects along with the inhomogeneities in these materials. It is noteworthy that terahertz radiation can provide a non-destructive, non-ionizing, and non-contact method to evaluate the materials[1]. THz technology can be regarded as a significant complement technique compared to other materials’ detection methods such as thermal imaging, ultrasound, acoustics, X-ray, and microwave techniques[2].
Generally, optical parameters such as refractive index can be measured by the transmission mode of THz-TDS system, and thickness of a material may be attained through the time difference between the front and rear surfaces of the material under the reflection mode[3]. However, in some cases such as thick materials and coated metal surfaces, the material is opaque in the terahertz frequency region. Therefore, measurements at the transmission mode cannot extract the optical parameters and the reflection mode should be used to attain parameters such as refractive index.
In the process of reflection measurement, the signal will be reflected along the mirror direction, when the material surface is completely smooth[4]. The signal will be reflected in different directions if the surface shows fluctuation at different heights and a weakened reflected signal will be observed. The roughness of the material surface inevitably affects the measurement outcomes. The influence of surface-roughness on the signal would be gradually enhanced by increasing the frequency[5]. Although, rough surfaces are negligible in the microwave zone, they should be reconsidered in the terahertz region. From a spectral perspective, the presence of discrete scatters can produce classical electromagnetic scattering, which may mask the spectral characteristics of the chemical constituents[6].
In order to ensure the accuracy of measurements, the influence of surface roughness was studied on the terahertz reflectance spectrum. The spectral characteristics of the rough surface with high smoothness were obtained by using the Gaussian distribution compensation method for the reflection model, and the purpose of measuring the material parameters was realized.
-
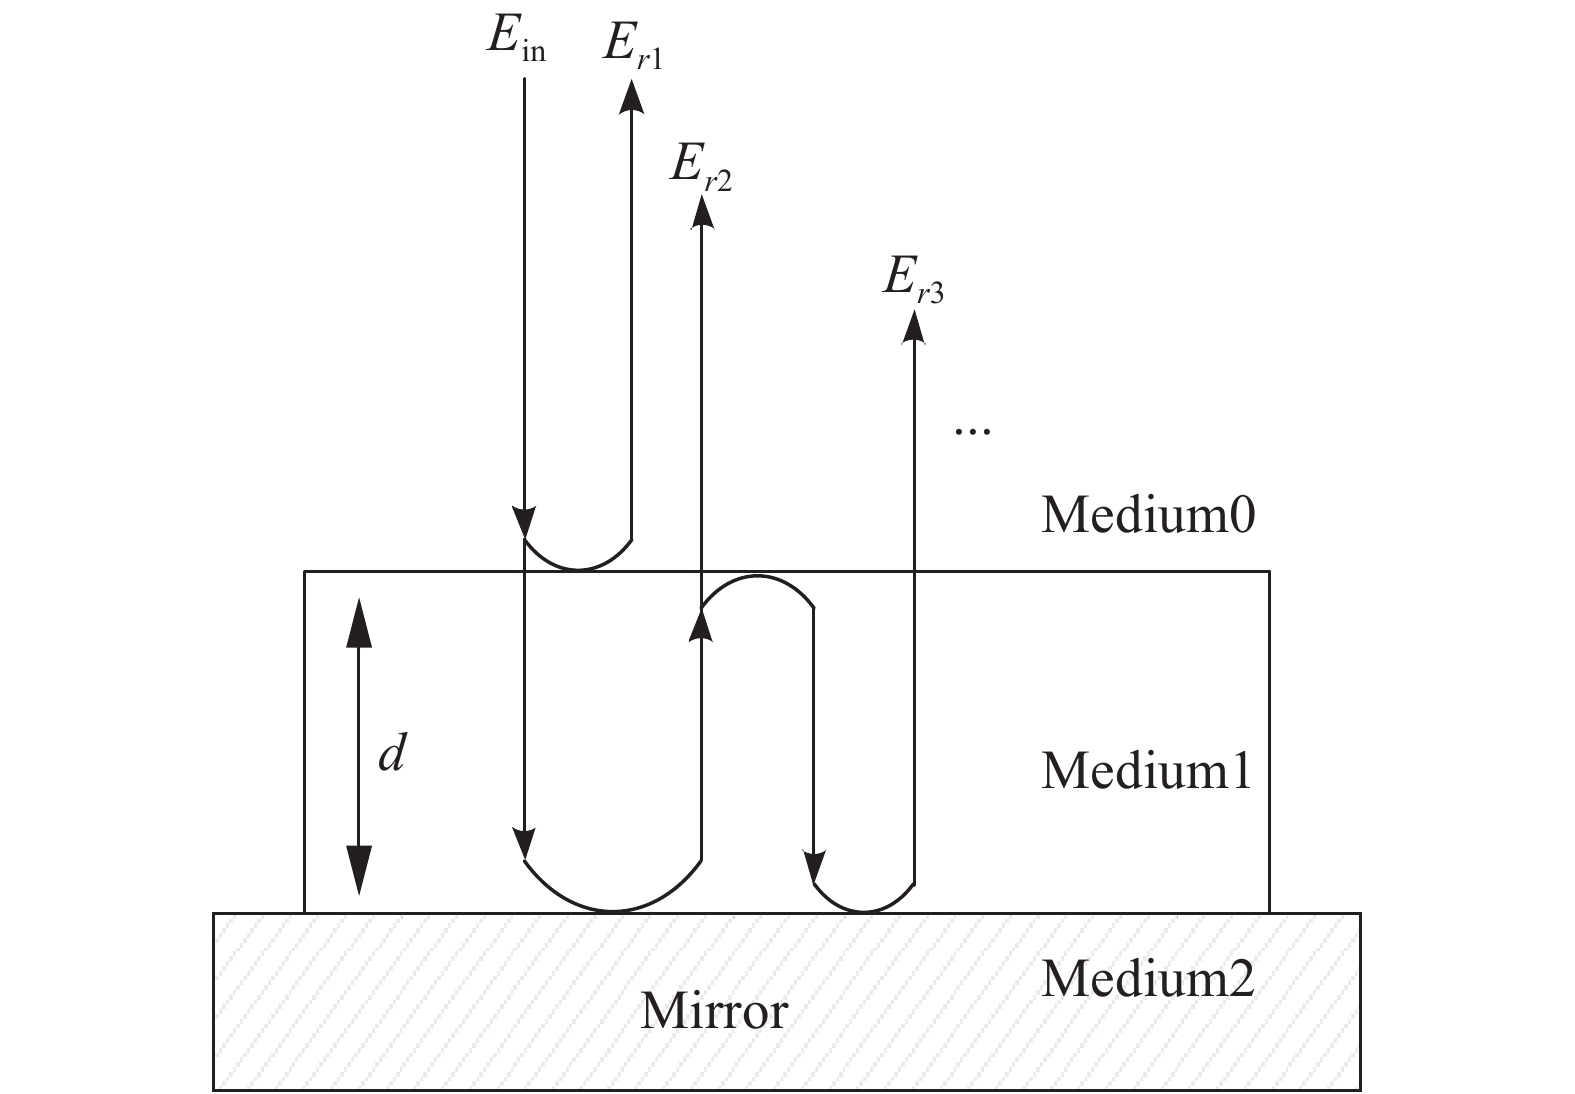
In the reflection mode measurement, the sample was placed in front of a reference mirror. It was assumed that all media are uniform, isotropic and non-magnetic, therefore, the internal dispersion can be ignored, as shown in Fig.1. The thickness of terahertz wave is d and the refractive index is
${{\tilde n} _1}$ in this Figure. The total reflected signal is the sum of the electric field intensity reflected by the 1st, 2nd, 3rd reflections and so on. According to Fresnel’s equation, the reflection and transmission coefficients can be correlated with the refractive indices of i and j media as follows[7]:
Figure 1. Schematic diagram of terahertz wave propagation process
The first reflected terahertz wave is generated by the interface between media 0 and 1, which can be expressed as:
The terahertz wave reflected in the second time would be obtained by the lower surface of medium 1 and the upper surface interface of the metal mirror, which can be expressed as:
The terahertz wave reflected in the third time is also generated by the signal making two roundtrips within medium 1, which can be expressed as:
The terahertz wave reflected at the Nth time can be expressed as:
Among them,
${{p}}({{f}},l)$ represents the phase-shift of terahertz waves through a medium with thickness of d:The final reflected terahertz wave can be expressed as:
The terahertz wave was completely reflected when the surface of the sample was smooth. While, the terahertz wave was reflected in all directions in the case of a rough surface. Hence, the established reflection model shown in Eq.(8) cannot be applied to study the reflection from a rough surface.
When establishing a model, the influence of interface roughness should be considered. Since the reflection spectrum can be affected by the reflected signals from rough and smooth surfaces, the influence of roughness parameters has to be considered to achieve the reflection spectrum more in line with the actual situation of the sample.
It is assumed that the reflection between the sample and metal mirror is a total reflection, hence, the reflection coefficient
${r_{12}} = {\rm{ - }}1$ (Eq.8) can be expressed:From Fresnel relation, Eq.(9) can be changed into a function of refractive index, Although the Fresnel formula is the premise of a smooth sample-surface, usually the existence of certain surface roughness may cause the THz wave incident to the crude produced in diffuse reflective surface. Thus, the surface roughness of the scattering effect depends on the relatively long wavelengths and height of the surface. Therefore, as the wavelength decreases (the frequency increases), the surface becomes rougher to the incident wave, resulting in more extensive scattering.
The relationship between the reflected signals on the rough and smooth surfaces can be described by the Kirchhoff approximation:
where
${R_{\rm{rough}}}$ is the reflection of the rough plane in a specular direction,${R_{\rm smooth}}$ is the mirror reflection of a smooth plane, σ is the root mean square roughness of a rough surface, ν is the velocity of terahertz wave in the sample, and c is the speed of light.Equation(10) is used to modify the reflection signal of a rough surface to include the influence of roughness parameters, which can compensate the signal attenuation and the scattering generated by the rough surface in the subsequent parameter extraction and data processing.
-
The impact of the surface roughness on the scattering depends on the surface height relative to a wavelength. Thus, as wavelength decreases (with increasing frequency), a surface will appear more rough to the incident wave and result in more diffuse scattering. Accordingly, the Fraunhofer Criterion is used to determine whether a rough surface causes scattering of incident electromagnetic waves[8].
where θ is the angle of incidence relative to the surface normal and λ is the wavelength; h is the rms height of a surface.
Although the rough surface is defined by the random roughness, it is necessary to quantify the rough surface as much as possible in order to study the influence of surface roughness on the resultant terahertz parameters. Sandpaper is divided into several types according to the diameter of the surface particles and roughness of its surface, so it can be used as a tool to quantify the roughness of a surface.
It has been proved that glucose has strong spectral characteristics in the terahertz frequency district and is often used as the research object of the terahertz spectral characteristics. In this paper, samples with different roughnesses were produced by pressing the glucose powder into a sandpaper at the same time.
Herein, sandpaper samples of 2 specifications (60 mesh σ = 25 µm and 360 mesh σ = 12.5 µm) were used and the surface roughness of these sandpapers was measured by a scanning electron microscope, According to Eq.(11), it can be calculated that the terahertz wave in the range of 0.3-1.5 THz can be considered as coarse for both sizes of sandpaper.
Glucose and polyethylene (PE) powder were mixed in a ratio of 2∶1 with a diameter of 20 mm mold. Sandpaper cutting with the same mold diameter size was performed by using a hydraulic press to attain a mixture with sandpaper suppression for a tablet. When the stress reached 2 MPa, relax handled and the zero pressure automatic was developed on the tablet. Finally, the sandpaper was removed. A photo of one of the glucose tablet with smooth surface is shown in Fig.2(a), the glucose tablet with 60 grit roughness is shown in Fig.2(b), the glucose tablet with 360 grit roughness is shown in Fig.2(c).

Figure 2. Glucose tablets of different roughness
As the Fig.2 shows, three specifications were detected including smooth on the surface of the tablet as contrast.
-
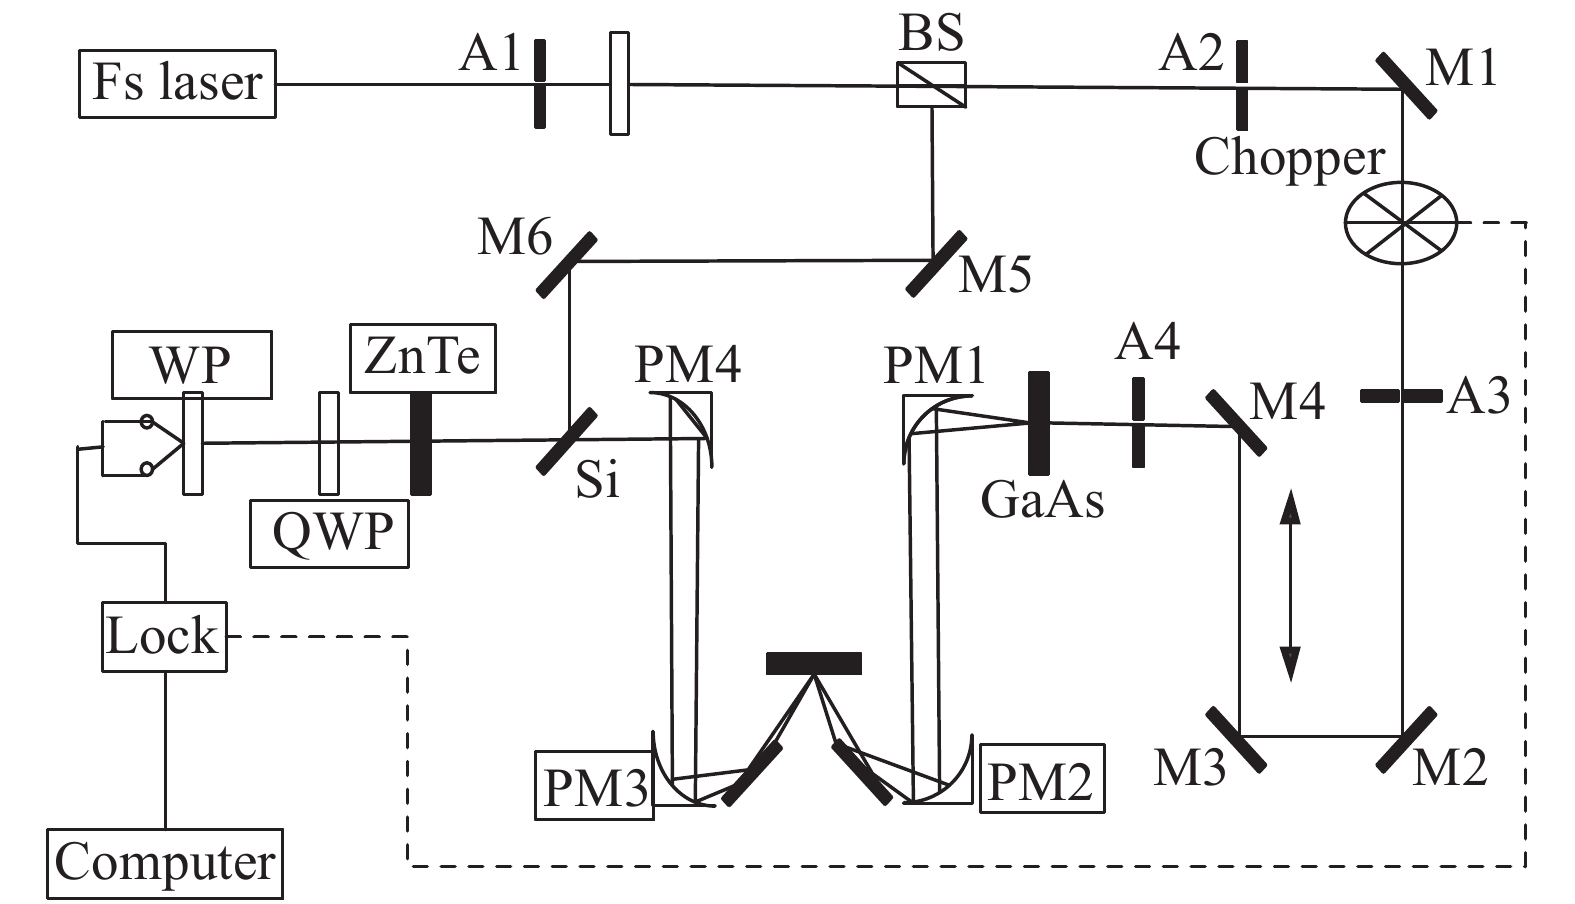
The system was produced by Zomega company in the United States, which provide transmission and reflection modes. The bandwidth range of the system was 0.1-4 THz, the dynamic range was greater than 58 dB, and the measurement delay time is 100 ps. The system was set to reflect mode with an incident angle of 0 degree. The spot diameter of terahertz wave was 1 mm, as shown in Fig.3.

Figure 3. Schematic diagram of the reflection mode measurement method. Where, A1, A2 and A3 stands for the focusing lens, BS stands for beam splitter, M1, M2, M3, M4, M5 and M6 stands for the plane mirror, PM1, PM2, PM3 and PM4 stands for the off-axis parabolic mirror, GaAs stands for the gallium arsenide photoconductive antenna, WP stands for the Wollaston prism, Lock stands for Lock-in amplifier
The system consists of fiber femtosecond laser, transmitter and detector. The fiber femtosecond laser emits pulses with central wavelength of 1560 nm at a repetition rate of 100 MHz. The laser pulse width is 80-90 fs and the output power is 20-30 mW. Femtosecond laser emits linearly polarized femtosecond pulse laser with pulse width less than 20 fs, which is divided into two beams by the beam splitter BS, namely pump laser and detection laser. The pumped laser is focused by convex lens L to the Gallium arsenide photoconductive antenna (GaAs-PCA) and generates pulsed terahertz wave, which is then focused by off-axis parabolic mirror OAP to the sample to be tested for detection, and the reflected pulse of the sample is obtained. After adjusting the position of the probe laser through a multifaceted mirror (which acts as a time delay), the probe laser and the sample reflection pulse are incident on the ZnTe crystal together with the sample reflection pulse through the off-axis paraboloid mirror oapwh with holes. The second-order nonlinear effect of the probe laser and the reflection pulse of the sample on the ZnTe crystal changes the polarization state of the probe laser, and the polarization angle of the beam is adjusted by 1/2 wave plate. Wollaston prism WP divides the orthogonal polarization component of the beam into two beams at a specific angle. After the balanced amplification of the photodetector BP, the photoelectric conversion and differential output of the electrical signal are carried out. In this process, the terahertz detector converts the reflected pulse of the sample containing position information into the corresponding electrical signal, and the signal size is proportional to the intensity of the reflected pulse. Finally, the corresponding data acquisition and processing are carried out by the computer. In order to avoid the influence of humidity on the system itself, the air humidity is kept at 25%, and the temperature is 25 ℃[9].
-
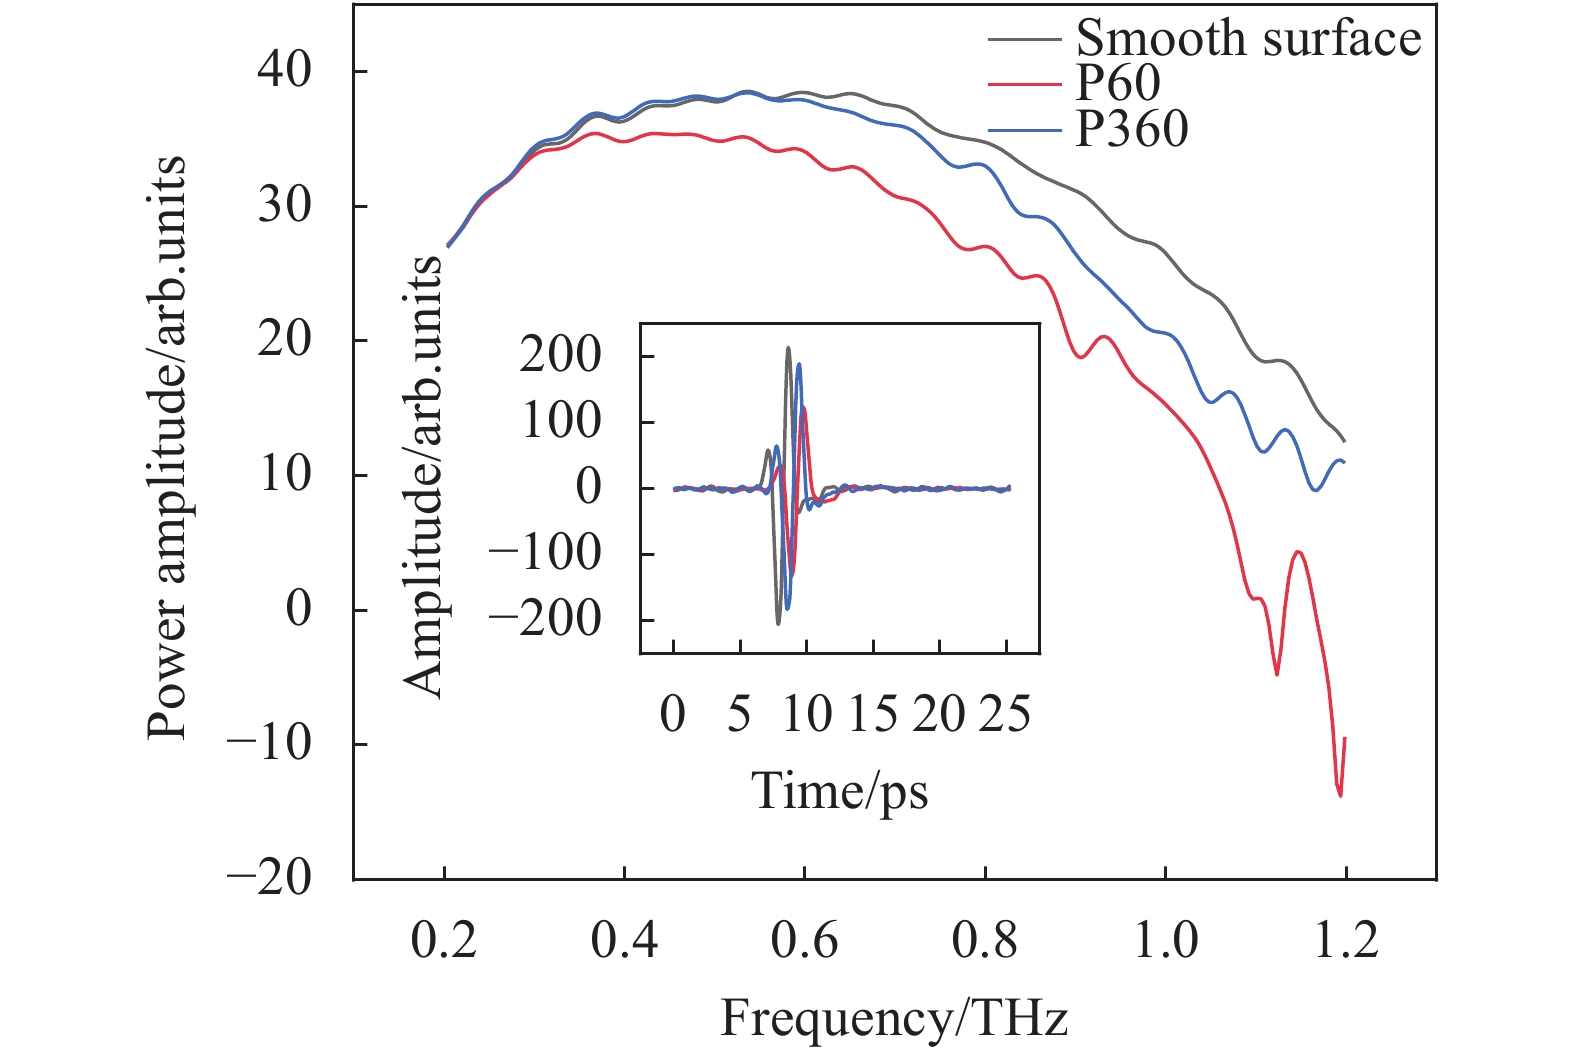
Due to the reallocation of coherent energy to incoherent scattering, the scattering power of rough sandpaper (especially gravel 36) in the mirror direction was reduced. Fig.4 shows the reflection spectrum of terahertz waves incident vertically on the surface of smooth, 60 and 360 mesh sandpaper-pressed samples. It can be seen that due to the influence of surface roughness, diffuse scattering on the rough surface weakened the reflection spectral intensity of the system receiver. The reflectance spectrum of the sample with smooth surface revealed the best signal-to-noise ratio. Whereas, the reflectance spectrum of the sample with 360 mesh roughness was the second, and the signal-to-noise ratio of the sample with 60 mesh roughness was the worst. Moreover, in the higher frequencies above 1.1 THz, the fluctuation was enhanced with the increase of roughness of the spectrum. The Gaussian distribution of the compensation spectrum was studied in order to reduce the roughness of the spectrum and the spectral characteristics of the smooth surface were restored, as shown in Fig.5 and Fig.6 The roughness of the samples after compensation contrast figure in the frequency spectrum of the sample was close to the smooth surface of the frequency of spectrum[10].

Figure 4. Reflection spectrum of terahertz waves incident vertically on the surface of smooth, 60 and 360 mesh sandpaper-pressed samples
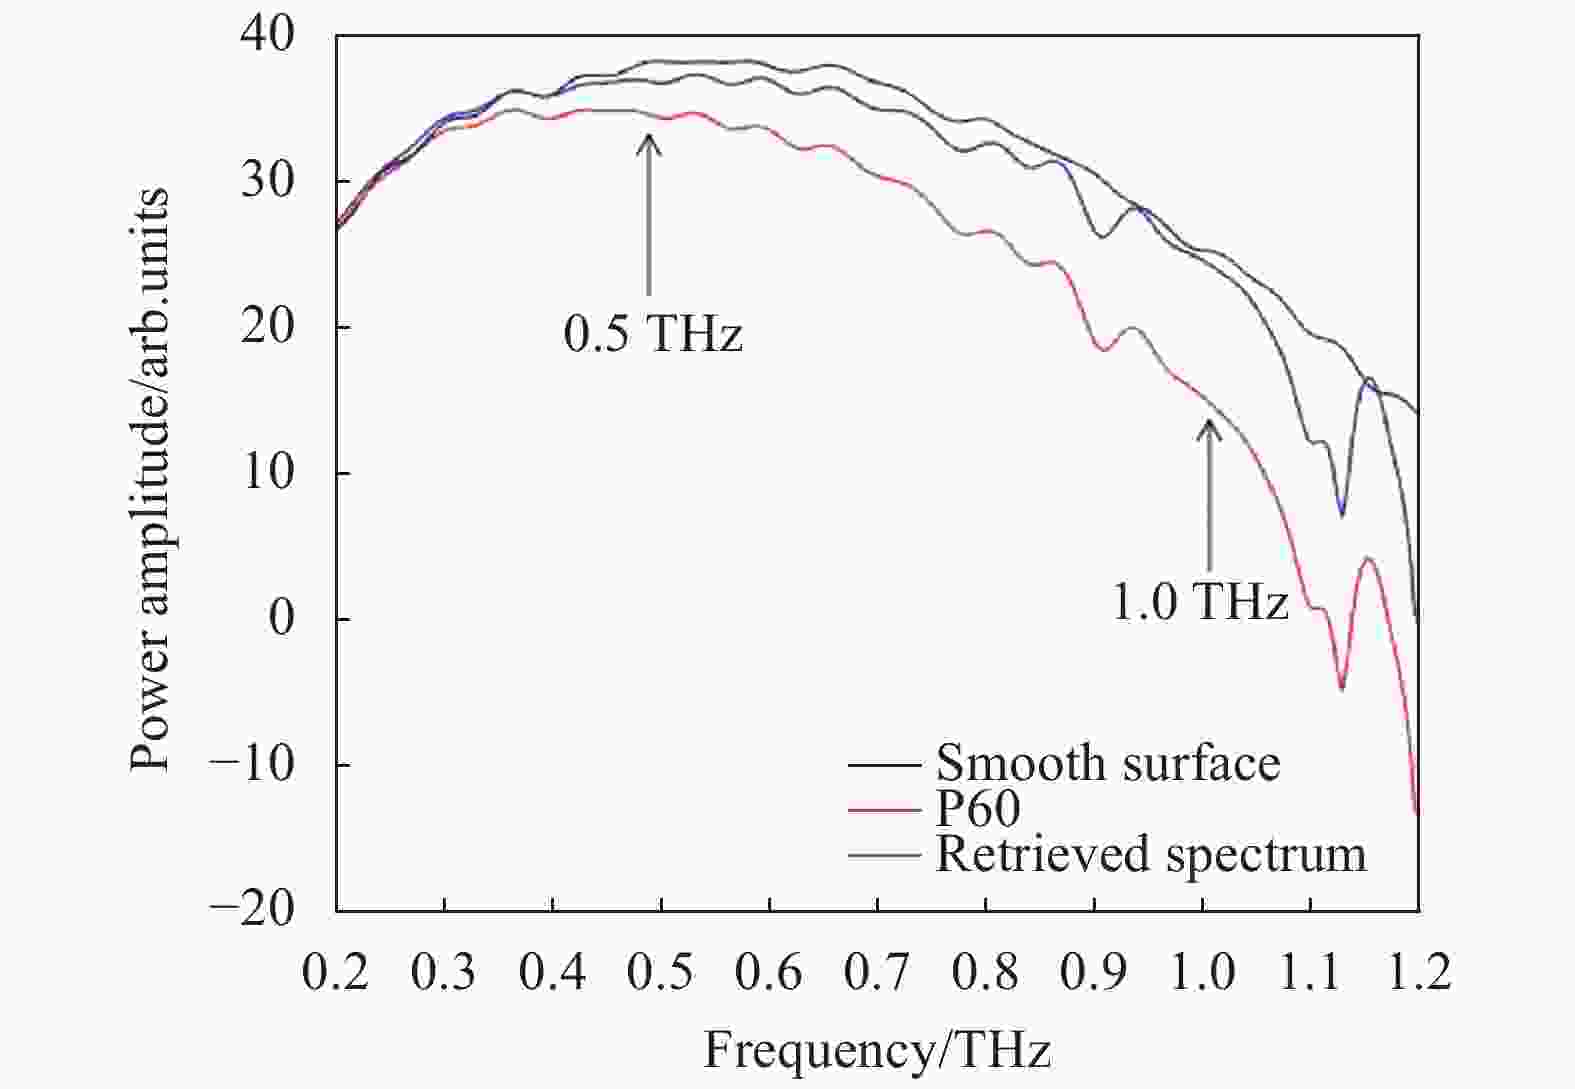
Figure 5. Reconstruction of a smooth-surface spectrum from a rough-surface of 60

Figure 6. Reconstruction of a smooth-surface spectrum from a rough-surface of 360
Compared to 60 mesh roughness of the reflection spectrum, the Gauss power spectrum was increased by about 3 dB and 9 dB after compensation range in 0.5 and 1 THz, respectively. Whereas, the Gauss power spectrum amplitude was enhanced after compensation of about 9 dB compared to 60 mesh roughness of the reflection spectrum, in 0.5 THz. In addition, the Gauss power spectrum after compensation range was increased by about 3 dB, at 1 THz, and the Gauss power spectrum amplitude was enhanced after compensation of about 9 dB. Compared to the 360 mesh roughness of the reflection spectrum, (in 0.5 THz place), the power spectrum amplitude after Gaussian compensation was increased by about 0.4 dB. Furthermore, the last mentioned compensation was appended by about 2 dB at 1 THz. These observations confirmed that the compensation method is preferred for the rougher surfaces.
-
After several years of research, THz spectroscopy has become a promising new technique for detection of drugs and composites. However, the opacity of most materials at the THz frequency made it possible to use only reflective mode detection systems. Furthermore, the roughness of most materials relative to the THz wavelength leads us to consider the effect of scattering on the spectrum.
In this paper, the effect of scattering from rough surfaces at the terahertz frequencies is studied on the reflection spectrum. Firstly, the theoretical model of terahertz reflectance spectrum under normal incidence is derived, then, the relation between the surface of rough dielectric material and surface of a smooth dielectric material is described by using Kirchhoff approximation. THz-TDS system is used to measure the samples with different roughness, the reflection spectrum is analyzed, and the rough spectrum is compensated. The spectral compensation method of a rough surface presented in this paper has a certain reference value for the development of THz nondestructive testing technology in the future. This procedure identification of spectral signatures may help with the identification of spectral signatures.
Effect of surface roughness on THz reflection measurement
doi: 10.3788/IRLA20200209
- Received Date: 2020-12-06
- Rev Recd Date: 2021-01-05
- Available Online: 2021-05-12
- Publish Date: 2021-03-15
Fund Project:
Key research and development program of Shandong Province (2019GGX104064); Research and development of multi-shaped 3D laser marking system (ZR2017BF024)
-
Key words:
- terahertz /
- time-domain reflection spectra /
- scattering /
- surface roughness
Abstract: The roughness of the material surface affects the THz nondestructive testing results. Roughness of the surface can be ignored in the microwave region, but should be considered in the terahertz frequency domain. The effect of scattering caused by rough surface at terahertz frequency on the reflection spectrum was studied and discussed. By consideration of the reflection model of a single sample, the reflection signal of a rough surface can be correlated with that of a smooth surface by using the Kirchhoff approximation. In addition, the glucose tablets with different roughness were measured by THz-TDS (Terahertz time domain spectroscopy) system and their reflection spectra were analyzed. The reflection spectrum results show that due to the roughness of the surface, diffuse scattering generated by the rough surface weakens the intensity of the reflection spectrum at the receiver. In order to reduce the influence of the roughness on the spectrum, a spectral Gaussian compensation method was proposed, which can restore the spectral characteristics of the smooth surface. The power spectrum of 360 mesh roughness was increased by about 3 dB and 9 dB at 0.5 THz and 1 THz, respectively. Therefore, it can be envisaged that the proposed rough-surface spectral compensation method has a specific reference value in the development of the THz nondestructive testing technology in the future.


 DownLoad: