


-
截止2018年年底,全球森林总面积为38.15亿hm2,约占全球陆地总面积的25.60% (按全球陆地面积149亿hm2计算)[1],故林下数字地面模型(Digital Terrain Model,DTM)是构建全球DTM模型的重要部分[2]。为获取全球范围内的大尺度、多时相数据,通常选择卫星观测数据作为主要研究对象[3-4]。不同于光学卫星遥感技术及微波卫星遥感技术反演林下地形过程中易受云层及森林信号饱和的影响,卫星激光测高技术可以获取分米级甚至厘米级的林下DTM数据[5-7]。
目前为止,全球共有4个已经成功发射的以激光测高技术为主载荷的对地观测卫星,分别为:冰云陆地高程卫星(Ice, Cloud, and land Elevation Satellite,ICESat)/ 地学激光高度计系统(Geoscience Laser Altimeter System,GLAS),ICESat-2/先进地形激光高度计系统(Advanced Topographic Laser Altimeter System,ATLAS),高分七号(GF-7)和全球生态系统动力学研究卫星(Global Ecosystem Dynamics Investigation,GEDI)。其中,ICESat,GF-7,GEDI均以线性体制的波形方式记录激光测高数据,而ICESat-2是以光子计数方式记录激光测高数据。基于ICESat/GLAS数据已经分别完成不同类型DTM数据的反演研究。其中,Wang、Nie、Lamsters等将ICESat/GLAS数据应用于冰川的DTM数据反演,并得出ICESat/GLAS数据与实测值具有较高相关性[8-10]。Li等[11]讨论了ICESat/GLAS数据与全球先进陆地观测卫星(Advance Land Observing Satellite,ALOS)的ALOS world 3D–30 m(AW3D30)、航天飞机雷达地形任务(Shuttle Radar Topography Mission,SRTM)的SRTM1数据及Global DEM version 2(GDEM2)的相关性,通过试验证明,3种数据存在明显相关性,其中,AW3D30相关性最高,RMSE为4.81 m。Yang等[12]利用ICESat/GLAS波形数据量化了地形坡度,试验结果表明:ICESat/GLAS数据反演地面坡度的精度分别为R2=0.83,RMSE=3.6°。Irfan等[13]利用ICESat/GLAS数据完成森林冠层高度信息反演研究,通过试验结果证明ICESat/GLAS数据可解释研究区内的79%冠层高度数据,且ICESat/GLAS数据可用于反演林下地形。但是,由于森林区域波形数据的特性,使得如何利用星载波形数据正确获取林下DTM数据存在困难。故利用ICESat/GLAS数据反演的DTM研究更多集中于非林下的DTM探究,因此如何利用星载激光雷达数据反演林下DTM将是星载激光波形数据应用的主要难点[9, 14]。由于ICESat-2/ATLAS采用不同于ICESat/GLAS的光子计数形式记录激光数据,所以探究光子数据反演林下DTM数据精度对于星载激光雷达数据应用具有重要意义。Neuenschwander等[15]通过试验证明,芬兰林区机载激光雷达数据反演的林下DTM与对应的ICESat-2/ATLAS数据之间存在良好的相关性(R2=0.99,RMSE=0.85 m)。Wang等[16]通过试验证明在阿拉斯加林区,ICESat-2/ATLAS数据与机载激光雷达获取的DTM之间存在良好相关性(R2=0.99,RMSE=1.96 m)。与ICESat/GLAS采用的单波束激光发射方式不同,ICESat-2/ATLAS采用3对6波束(每对激光束由一强一弱激光束组成,强弱光束能量比为4∶1)的激光发射方式,而以上针对ICESat-2/ATLAS数据的研究均以其强光束类型数据作为主要研究对象,并未分析ICESat-2/ATLAS弱光束数据反演林下DTM的精度[17-18]。
为探究ATLAS/ICESat-2强、弱光束数据反演林下DTM的精度,研究拟以ATL03、ATL08数据作为研究对象,探究ICESat-2/ATLAS的强、弱光束数据反演林下DTM的精度,并讨论不同冠层高度及植被覆盖率对于ICESat-2/ATLAS数据反演林下DTM的精度影响。
-
研究选择的研究区位于美国的南卡罗莱纳州Aiken郡,其经纬度范围为(33.56°N~33.78°N,81.69°W~81.73°W),如图1所示。Aiken郡位于南卡罗莱纳州西南部,属于亚热带季风湿润气候。研究区内植被类型包括:耕地(0.04%)、森林(88.52%)、灌木(0.51%)、湿地(6.97%)、人工地表(3.95%)[19]。研究区林下地形缓坡居多,海拔范围为91~164 m。植被覆盖率范围为25%~66%,大部分足印覆盖区的植被覆盖率为36% (29.5%),66% (26.2%)[20]。冠层高度范围为0.1~34.8 m。
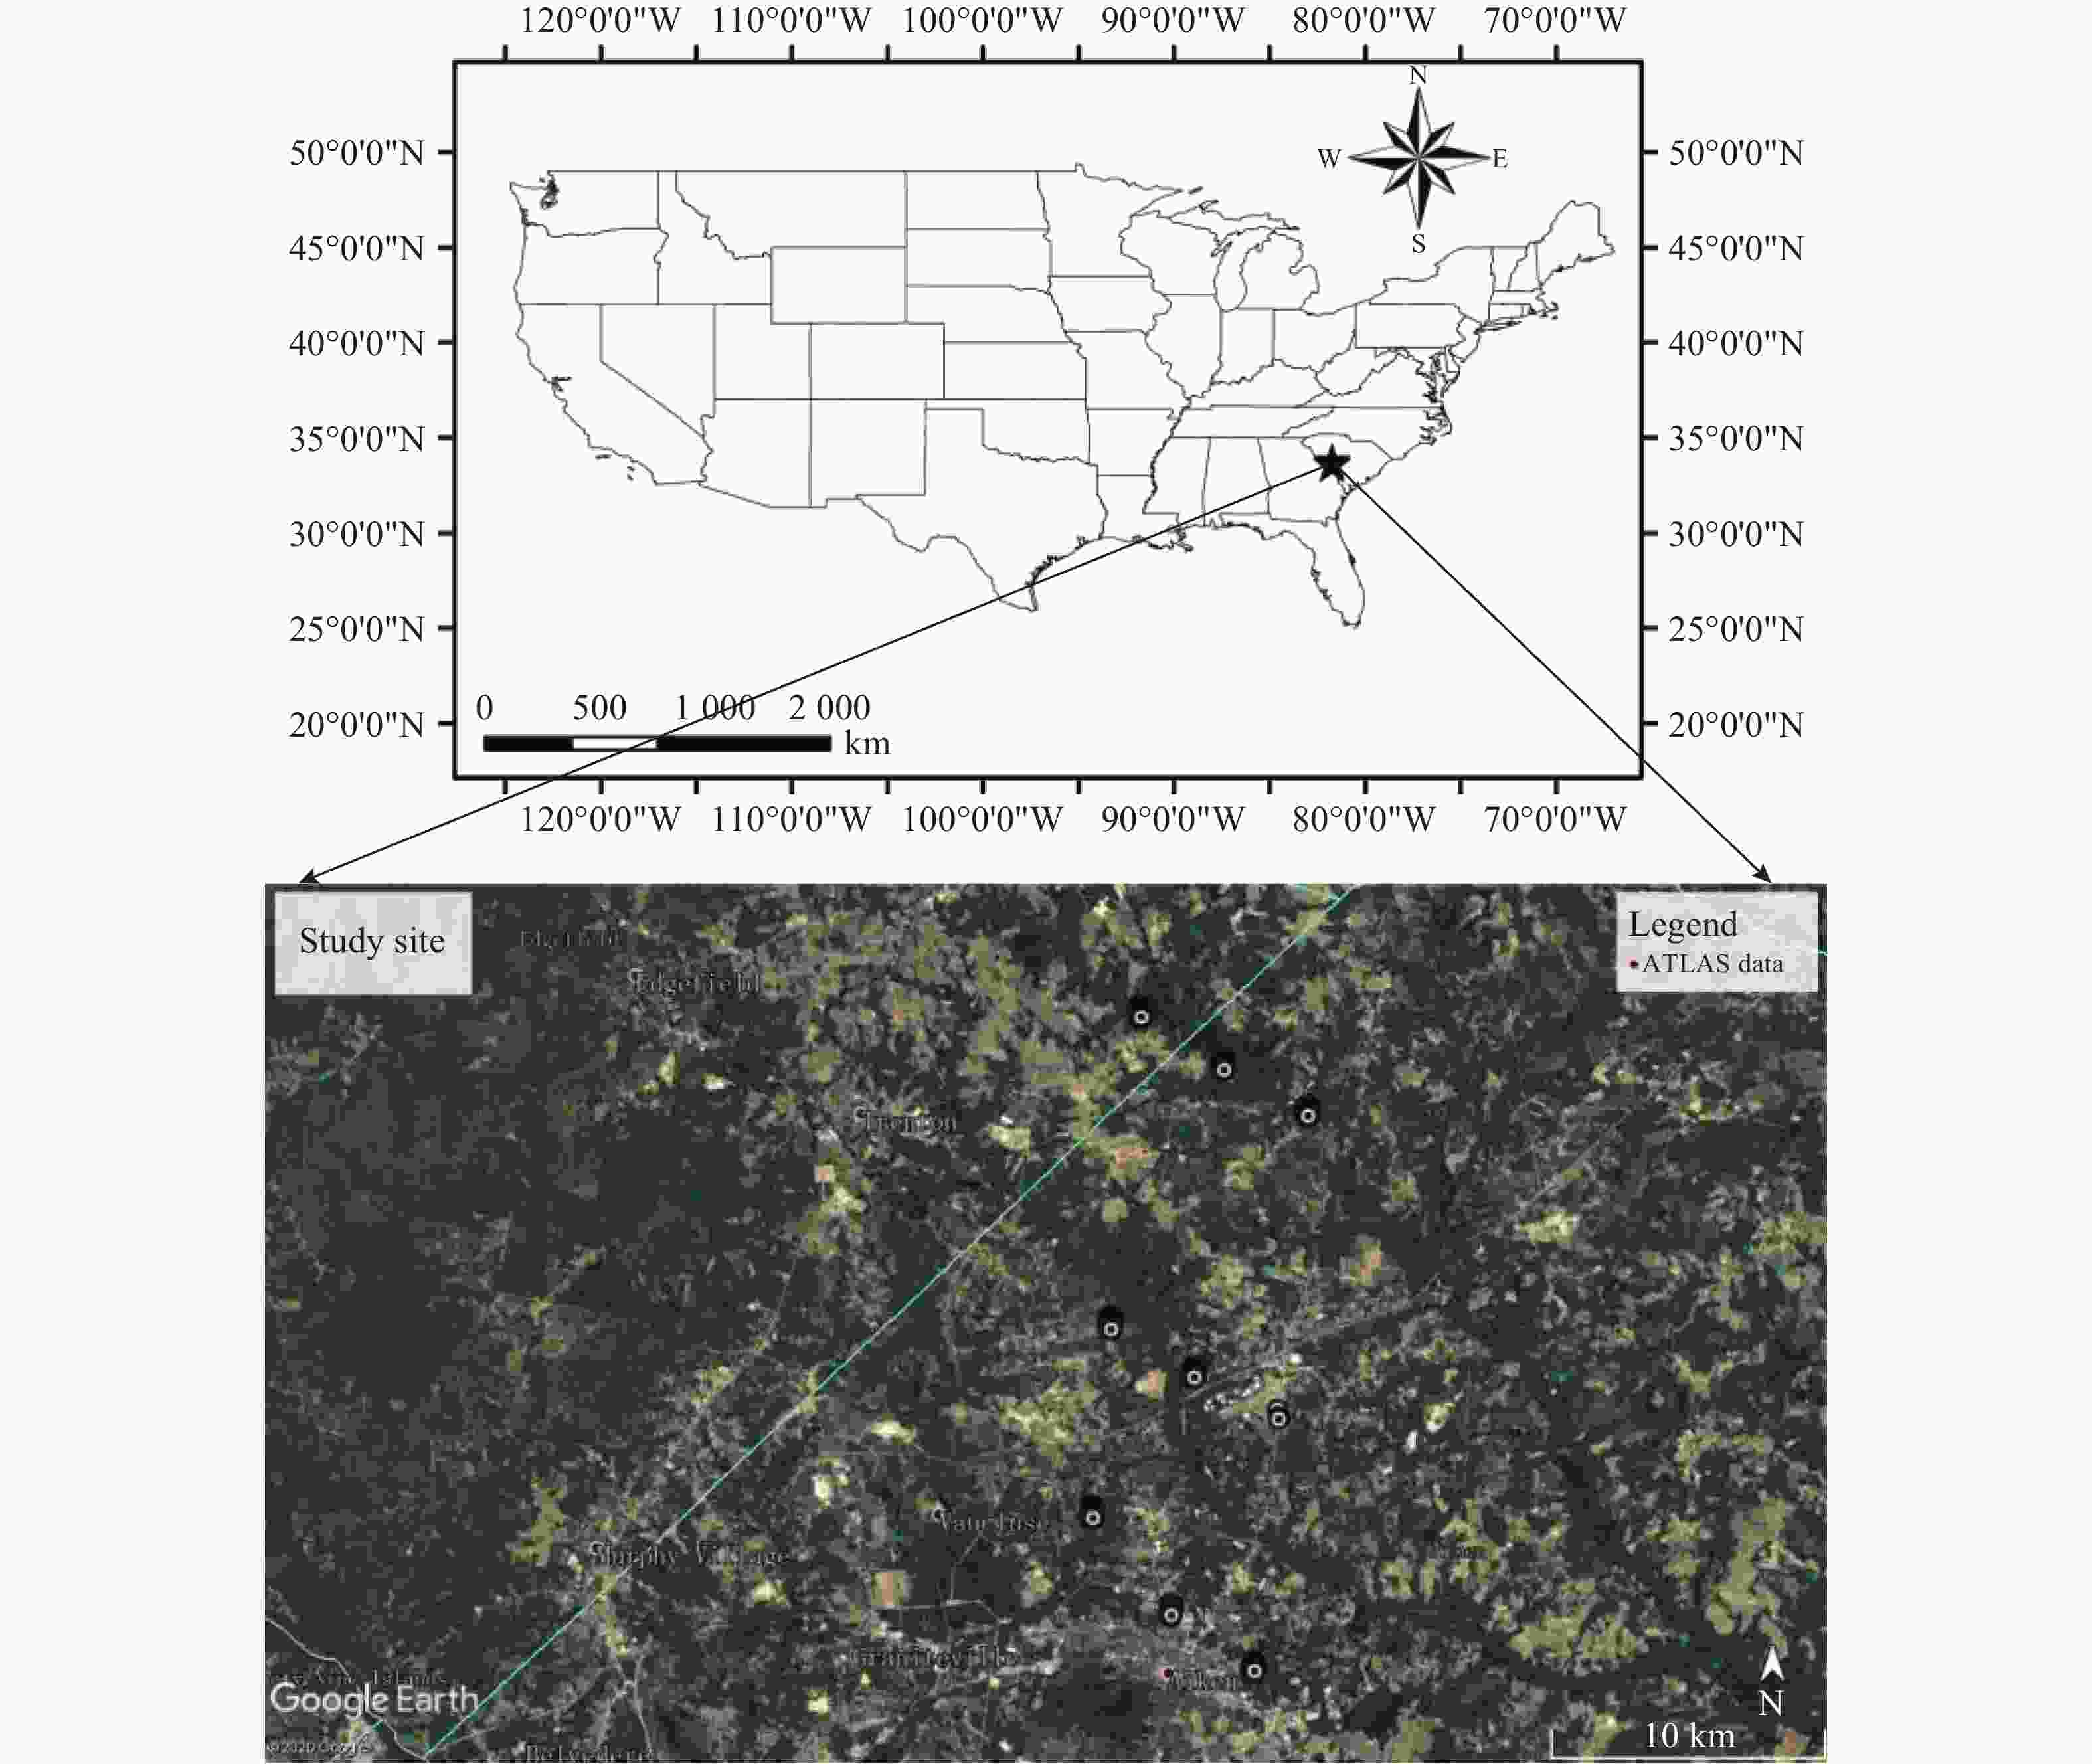
Figure 1. Location of study area
-
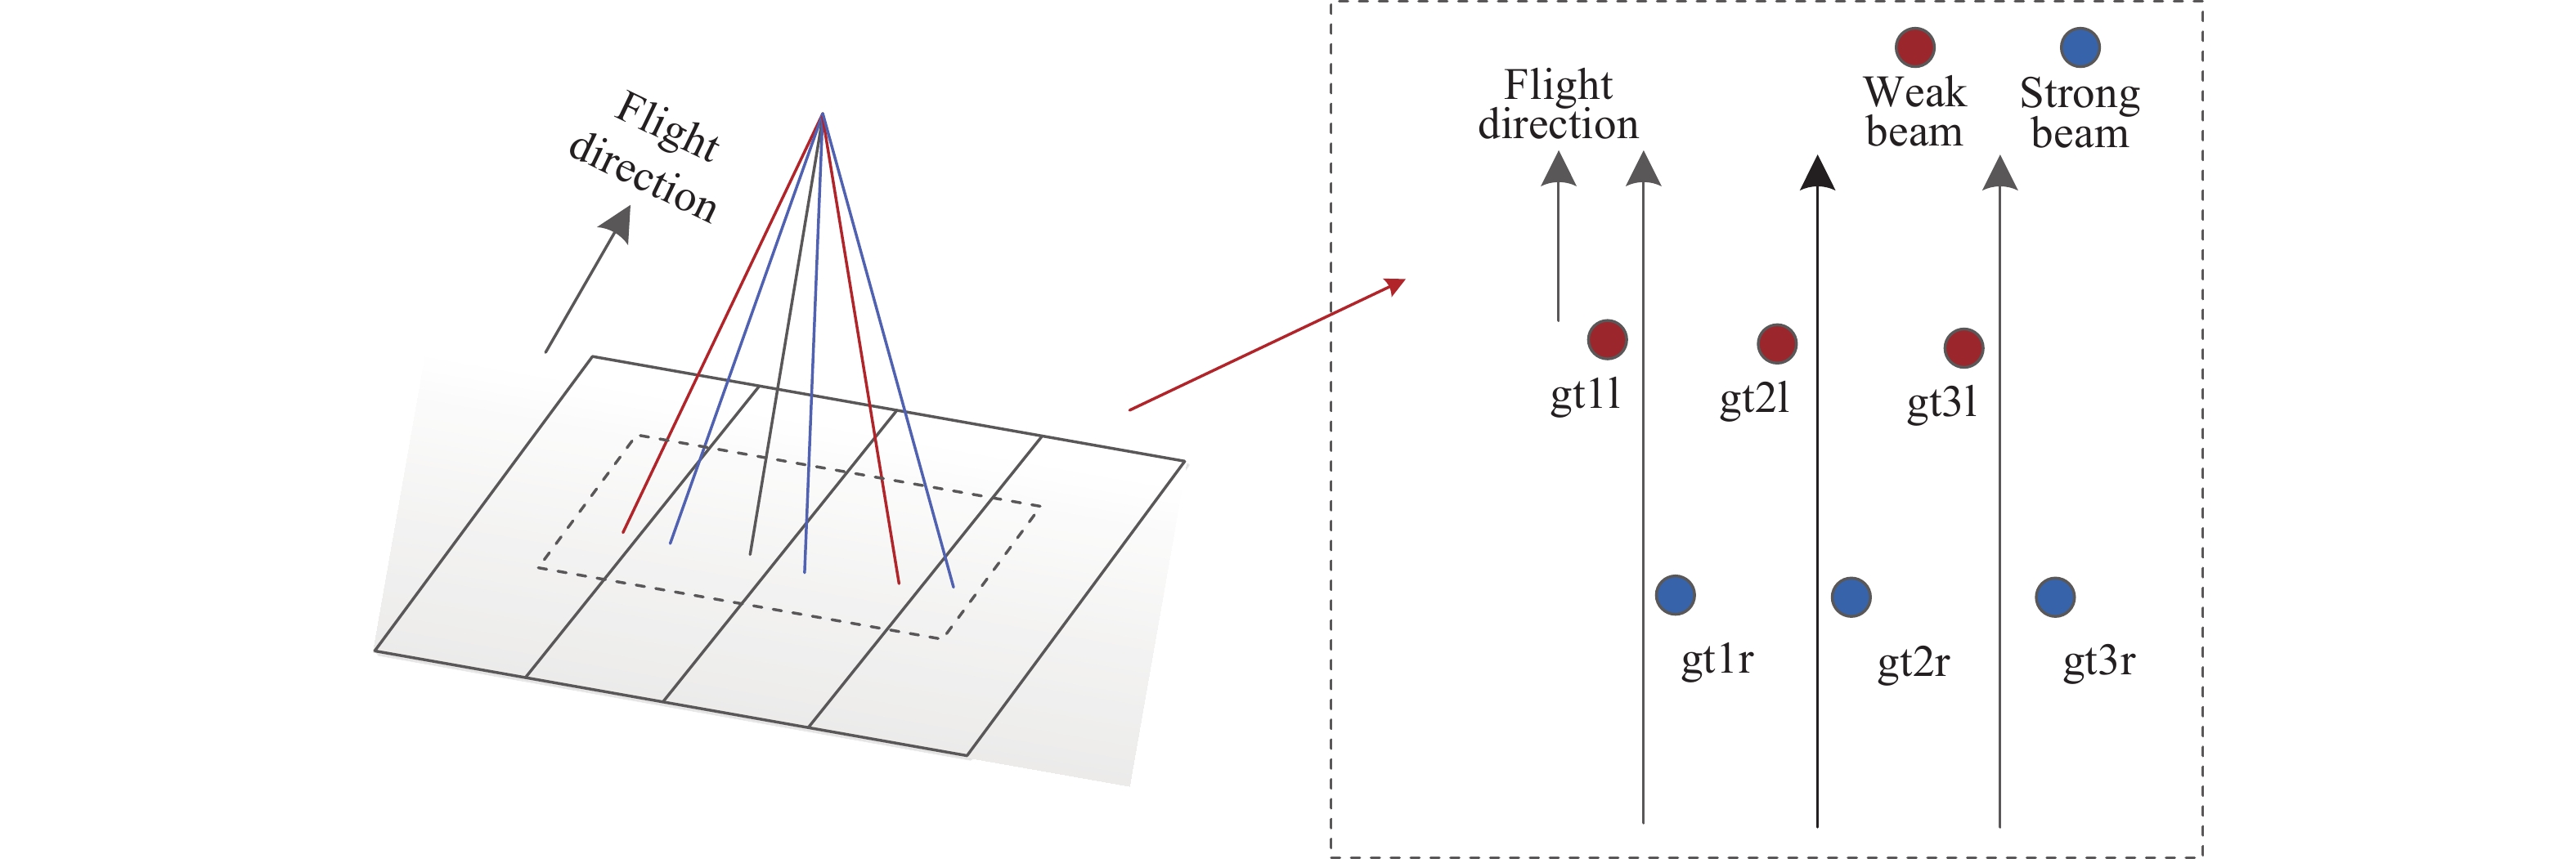
ICESat-2采用的激光发射频率为10 kHz,结合ICESat-2的卫星轨道高度及卫星运动速度可知,ICESat-2的足印直径约为17 m,沿轨足印间距0.7 m。每对波束垂轨间距约为3 km,每对波束内强弱光束垂轨方向间距约为90 m,沿轨方向间距约为2.5 km。ATLAS数据足印分布形式如图2所示[17]。

Figure 2. Schematic of ATLAS data
根据美国国家冰雪数据中心(National Snow and Ice Data Center,NSIDC)公布的ICESat-2数据产品形式,ICESat-2有3种级别共21种产品,分别为ATL01~ATL21,文件均采用hdf5文件格式存储数据。其中与林下DTM相关的数据产品包括:ATL03、ATL08。其中ATL03为全球定位光子数据产品(Global Geolocated Photon Data),ATL03产品包括每个光子事件的时间、纬度、经度和高程信息。在ATL03文件中,每个光子采用2种索引方法,一种是按照光子的传输时间顺序进行编号,称为光子数据传输时间序号,光子数据的经纬度、高程等信息按照该序号被记录在ATL03/gtx/heights组内。另一种索引方式为按沿轨距离每20 m划分为一个区段,并按区段进行数据处理生成ATL08级数据。对各组区段依次进行编号,称为区段号,参数名称为segment_id,每组区段的起始光子序号参数名称为ph_index_beg。
ATL08为陆地植被数据产品(Land and Vegetation Height),ATL08产品为利用差分、回归和高斯自适应最近邻(Differential, Regressive, and Gaussian Adaptive Nearest Neighbor,DRAGANN)对ATL03数据进行去噪,并利用NASA官方分类算法完成光子云的分类,将光子云划分为冠层顶光子、冠层光子、地面光子和噪声光子[15],光子分类参数名称为:classed_pc_flag,ATL08数据的光子分类参数为按ATL03文件的20 m区段进行储存,光子分类参数区段号的参数名称为ph_segment_id,区段内相对序号的参数名称为classed_pc_indx。研究使用的ATL03、ATL08数据均可在网站
https://search.earthdata.nasa.gov 下载。 -
为确定研究区范围,利用机载激光雷达(Goddard's LiDAR, Hyperspectral Thermal Imager, G-LiHT)公布的机载轨迹标记语言 (Keyhole Markup Language, KML)文件联合ATL03文件的卫星运行轨迹,确定两数据重合位置,作为研究区。为验证ATLAS数据反演林下DTM的精度,研究选择G-LiHT数据发布的数字地面模型(DTM)、冠层高度模型(Canopy Height Model,CHM)产品作为验证数据。该类数据的分辨率为1 m,数据格式为TIFF。研究使用的G-LiHT相关数据来自于
https://glihtdata.gsfc.nasa.gov 。 -
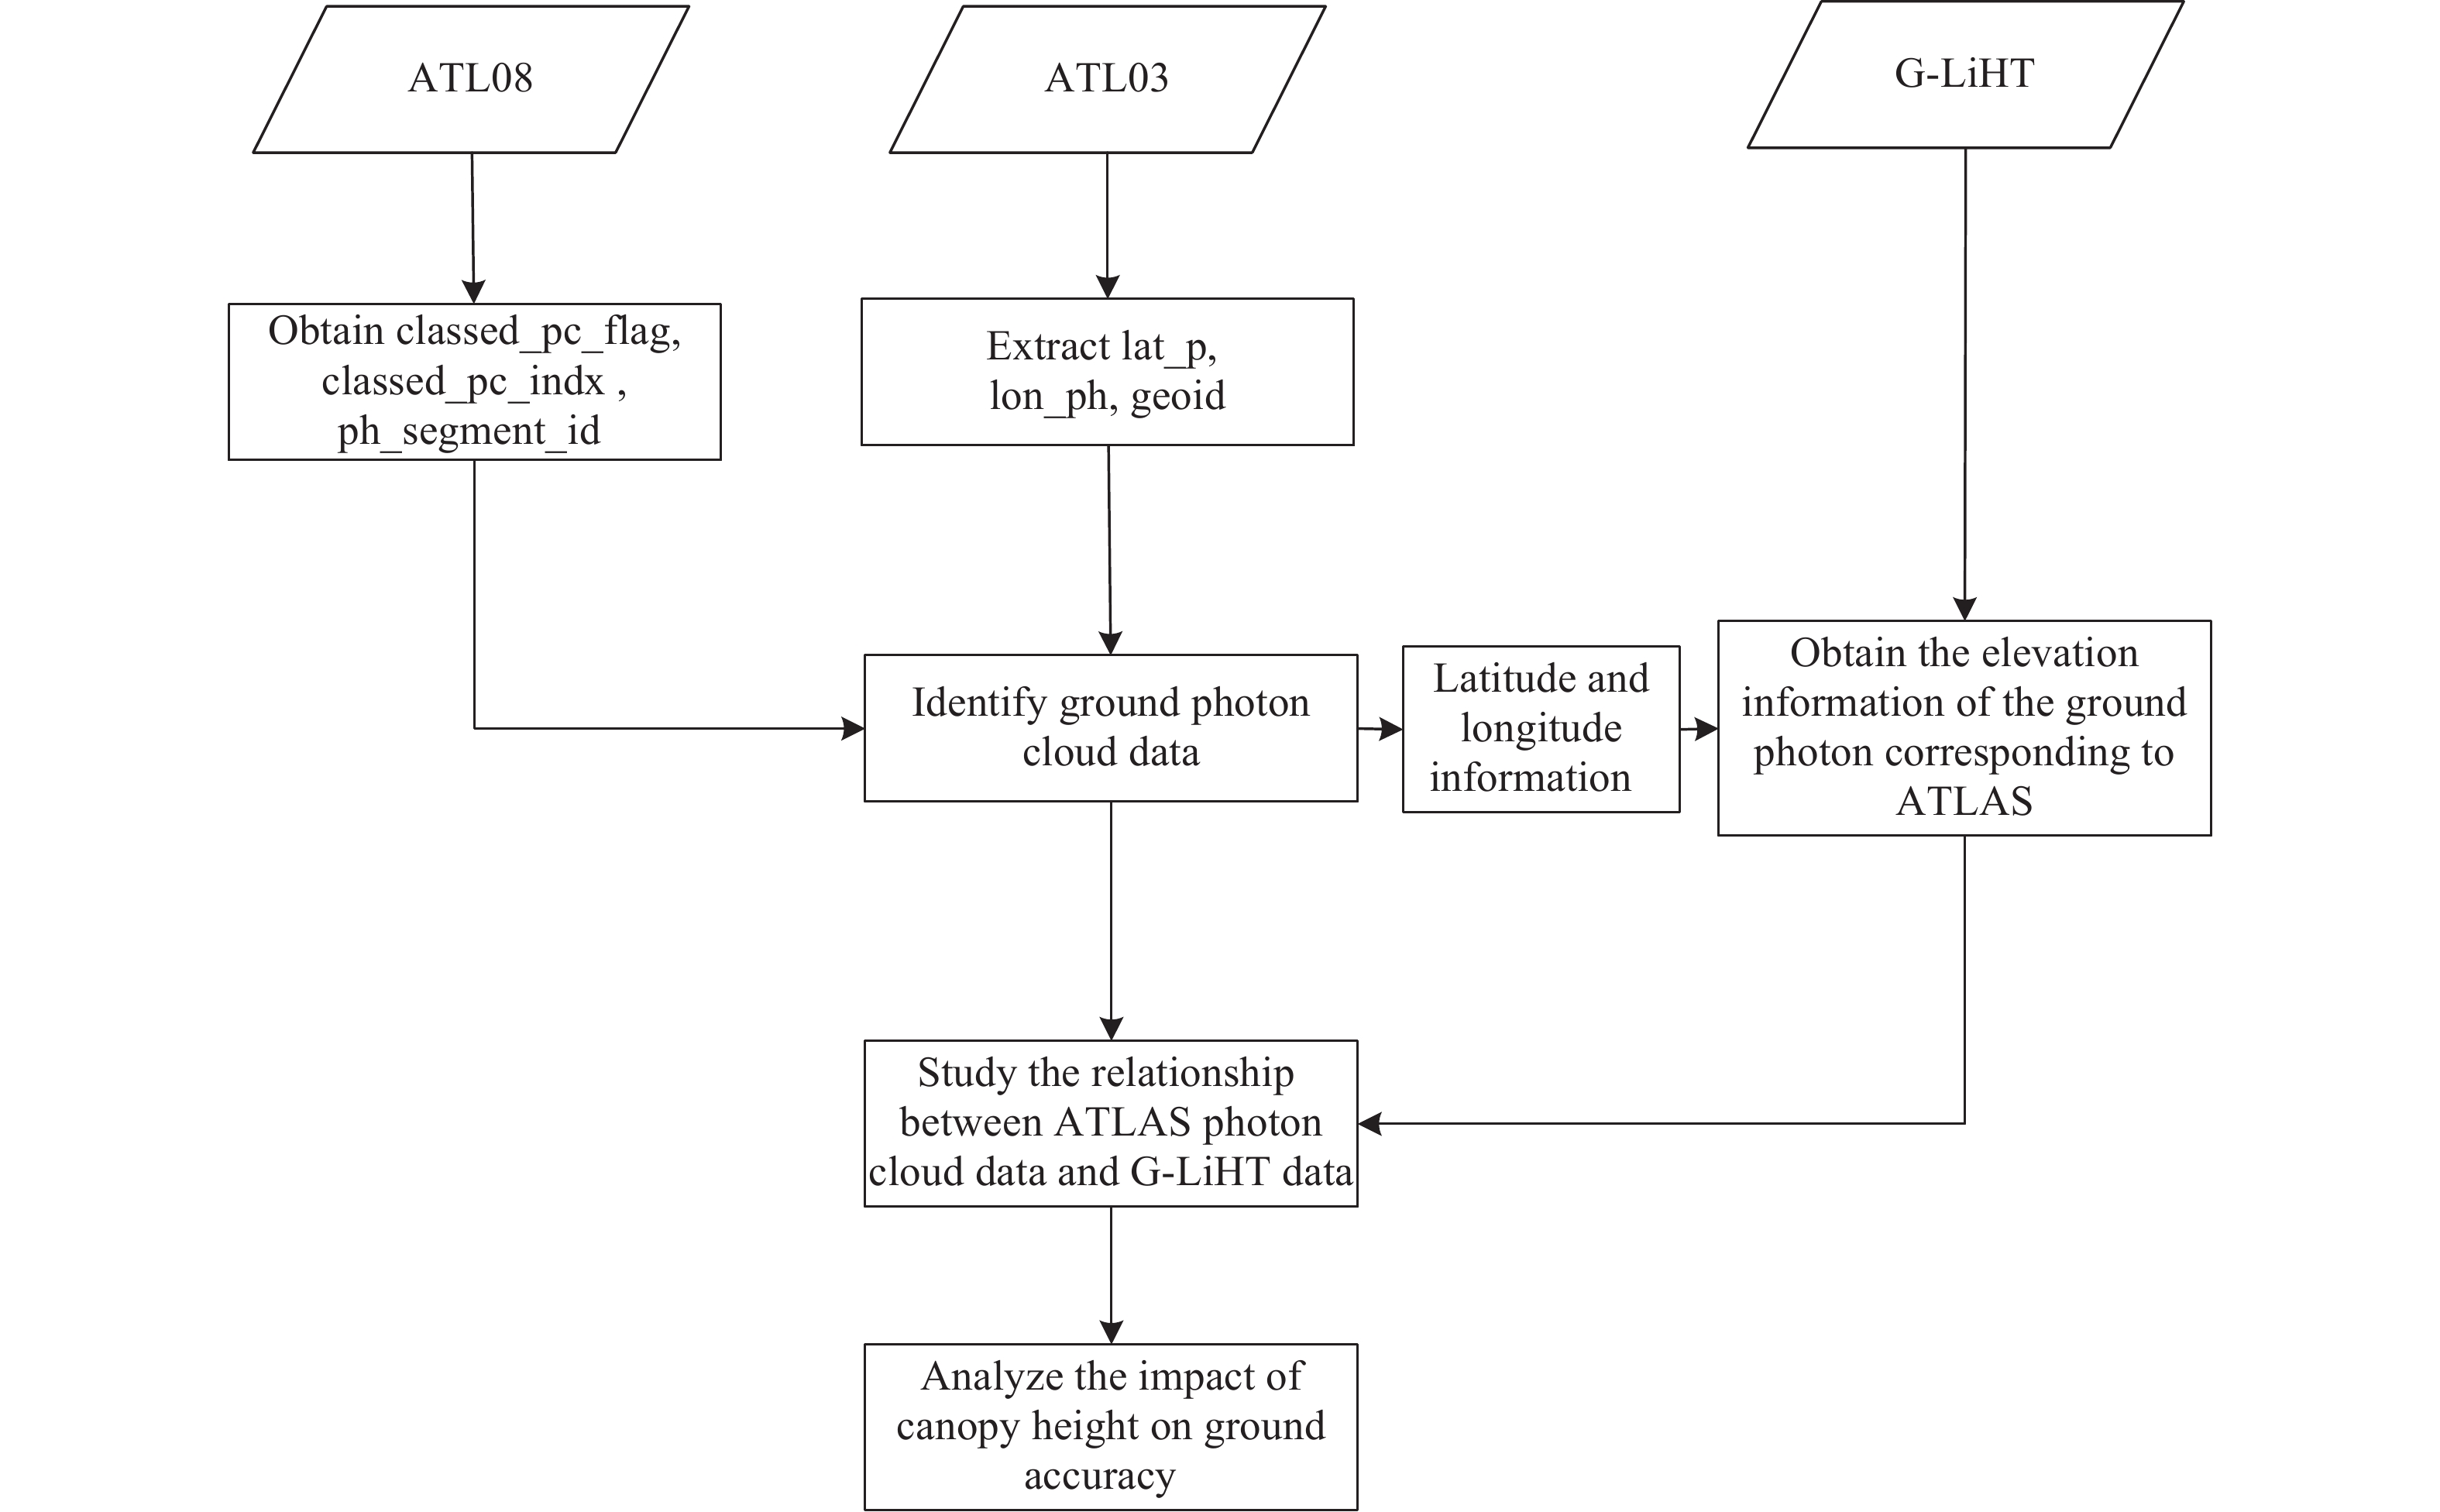
为探究ATLAS强、弱光束数据反演林下DTM精度,研究选择对ATL03、ATL08数据进行关联,着重探究ATL08标定的ATL03中的林下地面光子与G-LiHT的DTM数据的关系。研究方法流程如图3所示,研究主要包括以下步骤:
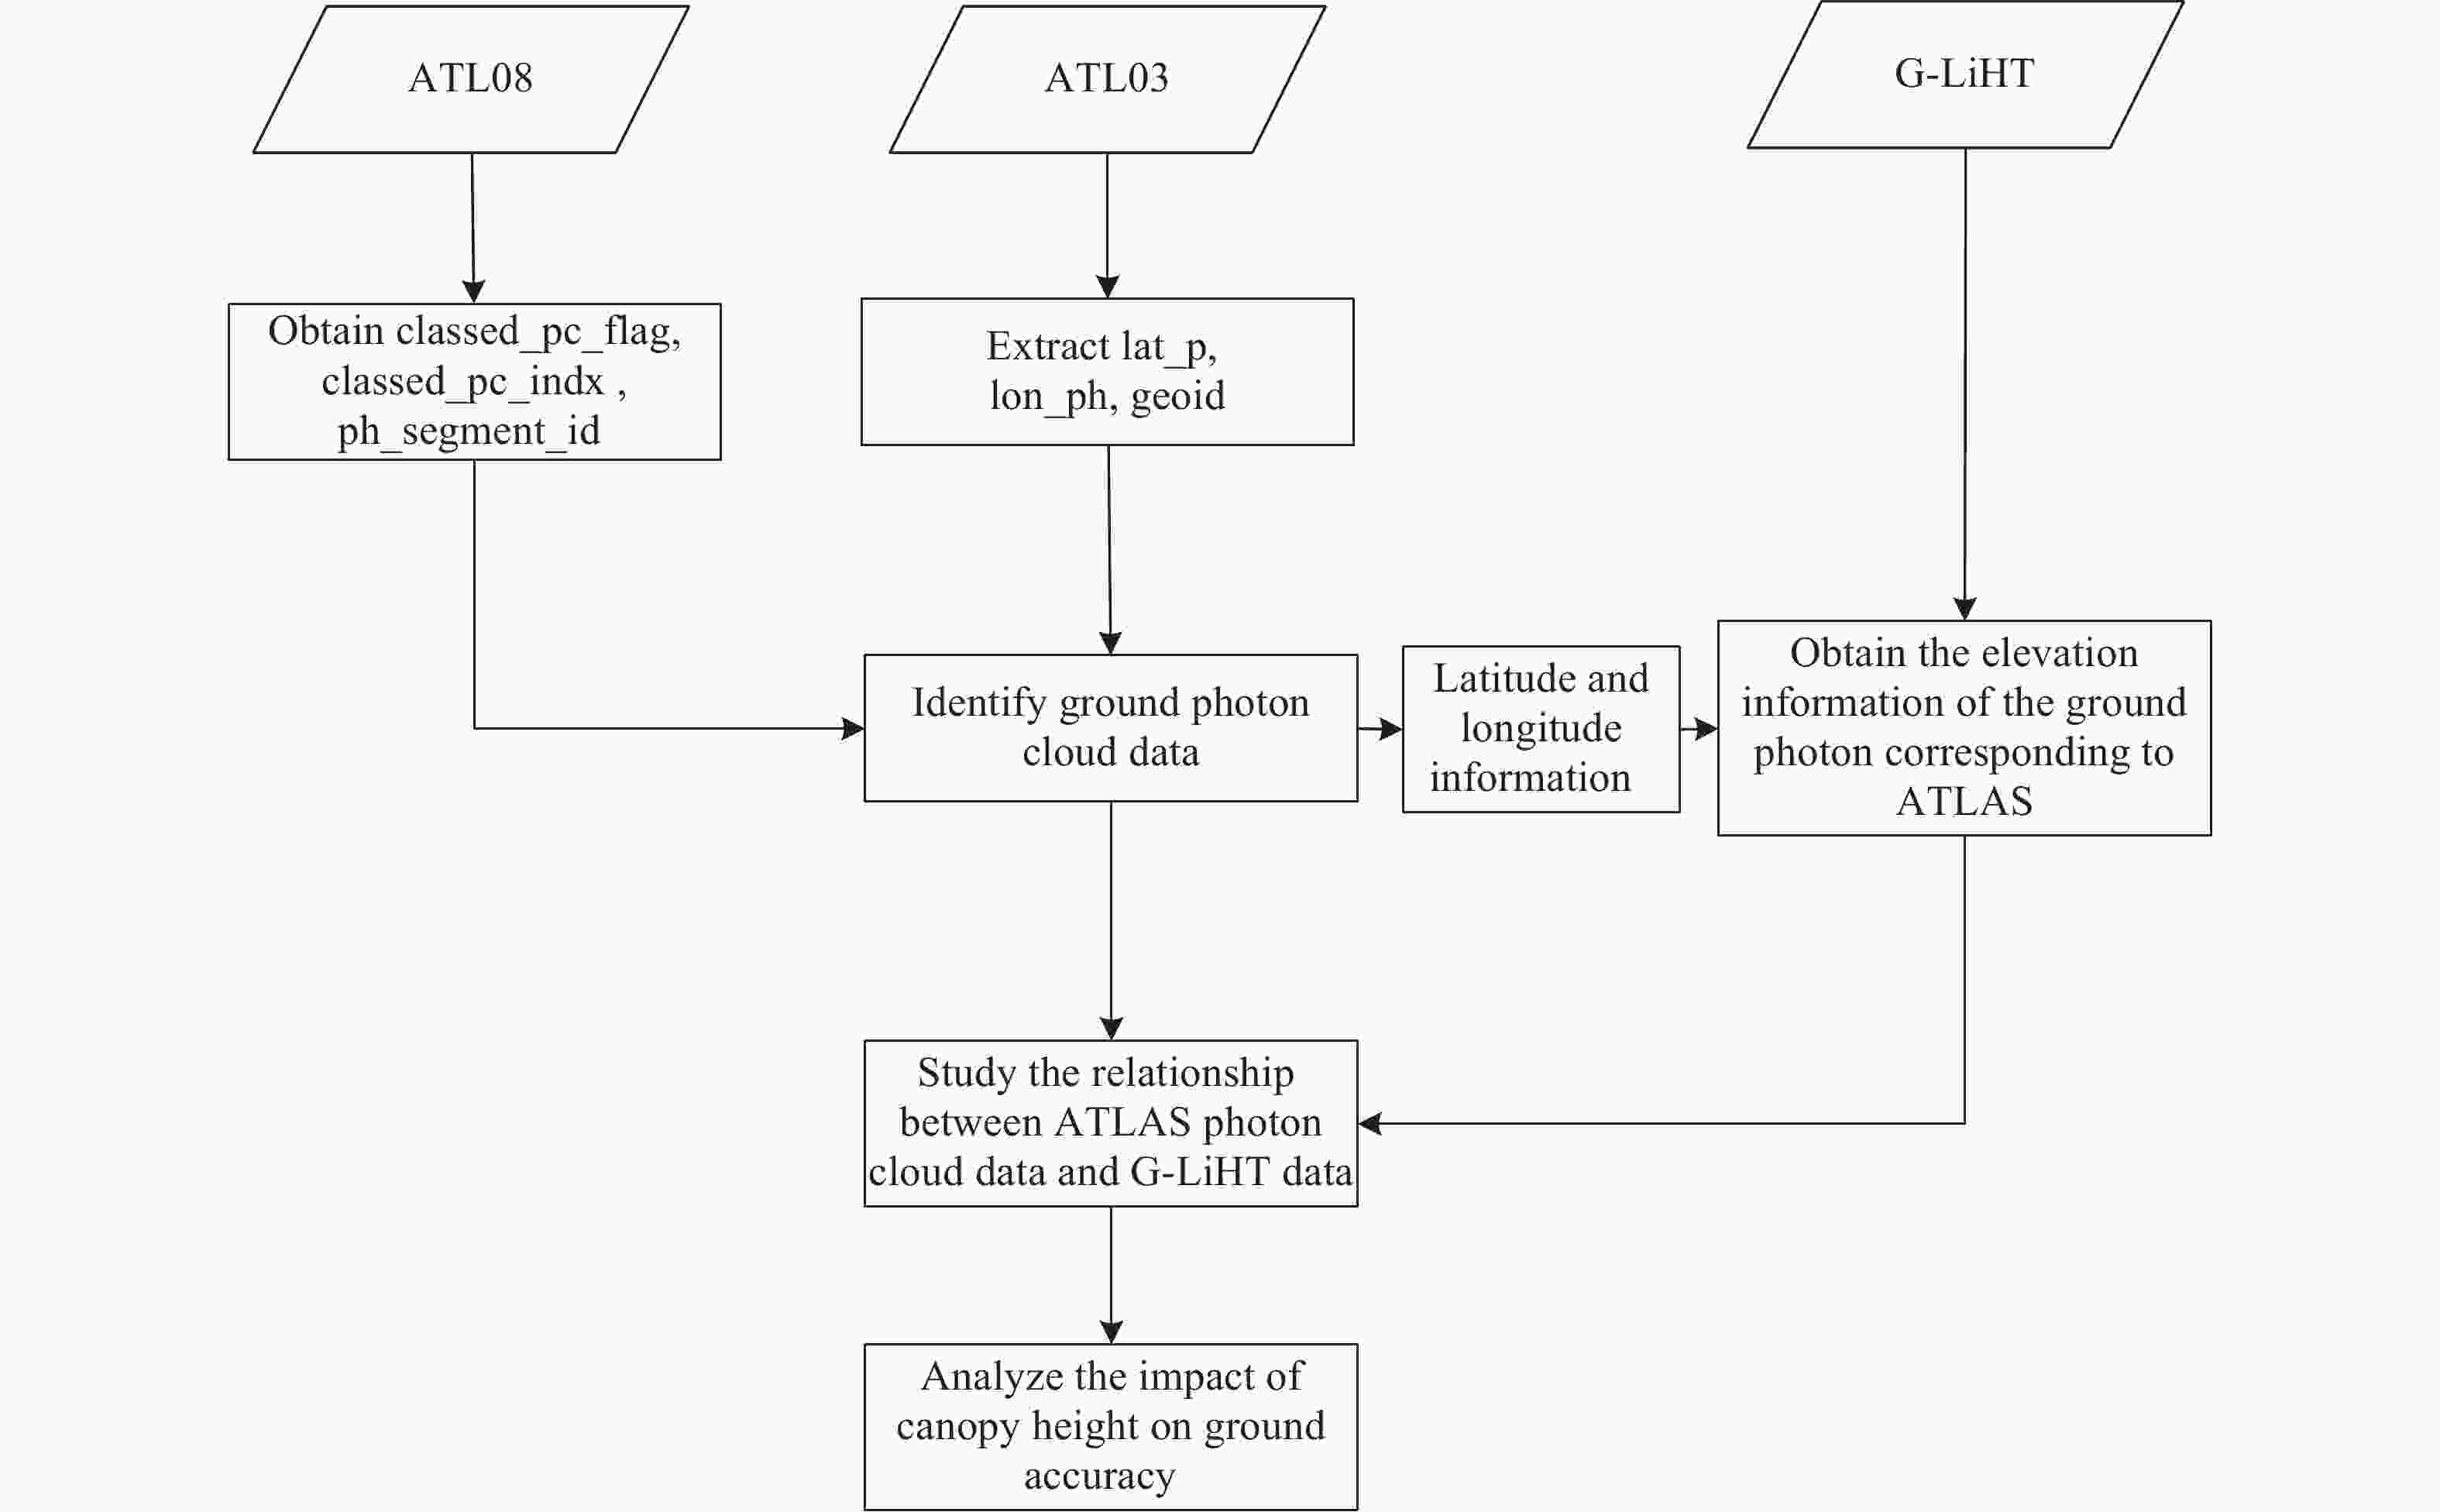
Figure 3. Research flow chart
(1)根据ATLAS轨道范围结合G-LiHT的KML文件,选择ATLAS轨道与G-LiHT轨迹重合区域作为研究区。
(2)提取ATL03数据产品中光子云数据的经度(lat_ph)、纬度(lon_ph)、高程(h_ph)和大地水准面改正信息(geoid)。由于光子云数据为基于WGS84坐标系统,需将光子云高程信息减去大地水准面改正信息获得带有大地水准面改正信息的光子高程数据。研究使用的ATL03文件与ATL08文件中的参数汇总如表1所示。
Parameters Description of parameters Source of parameters lat_ph Latitude of each received photon ATL03/gtx/heights/lat_ph lon_ph Longitude of each received photon ATL03/gtx/heights/lon_ph h_ph Height of each received photon ATL03/gtx/heights/h_ph geoid Geoid height above WGS-84 reference ellipsoid ATL03/gtx/geophys_corr/
geoidsegment_id A 7 digit number identifiying the along-track geolocation segment number ATL03/gtx/ geolocation/segment_id ph_index_beg Index (1-based) within the photon-rate data of the first photon within this segment ATL03/gtx/geolocation/
ph_index_begclassed_pc_flag Land vegetation ATBD classification flag for each photon as either noise, ground, canopy,
and top of canopy. 0=noise, 1=ground, 2=canopy, or 3=top of canopyATL08/gtx/ signal_photons/
classed_pc_flagclassed_pc_indx Index (1-based) of the ATL08 classified signal photon from the start of the ATL03 geolocation
segment specified on the ATL08 product at the photon rate in the
corresponding parameter, ph_segment_idATL08/gtx/signal_photons/
classed_pc_indxph_segment_id Segment ID of photons tracing back to specific 20 m segment_id on ATL03 ATL08/gtx/signal_photons/
ph_segment_idTable 1. ATLAS parameters used in the paper
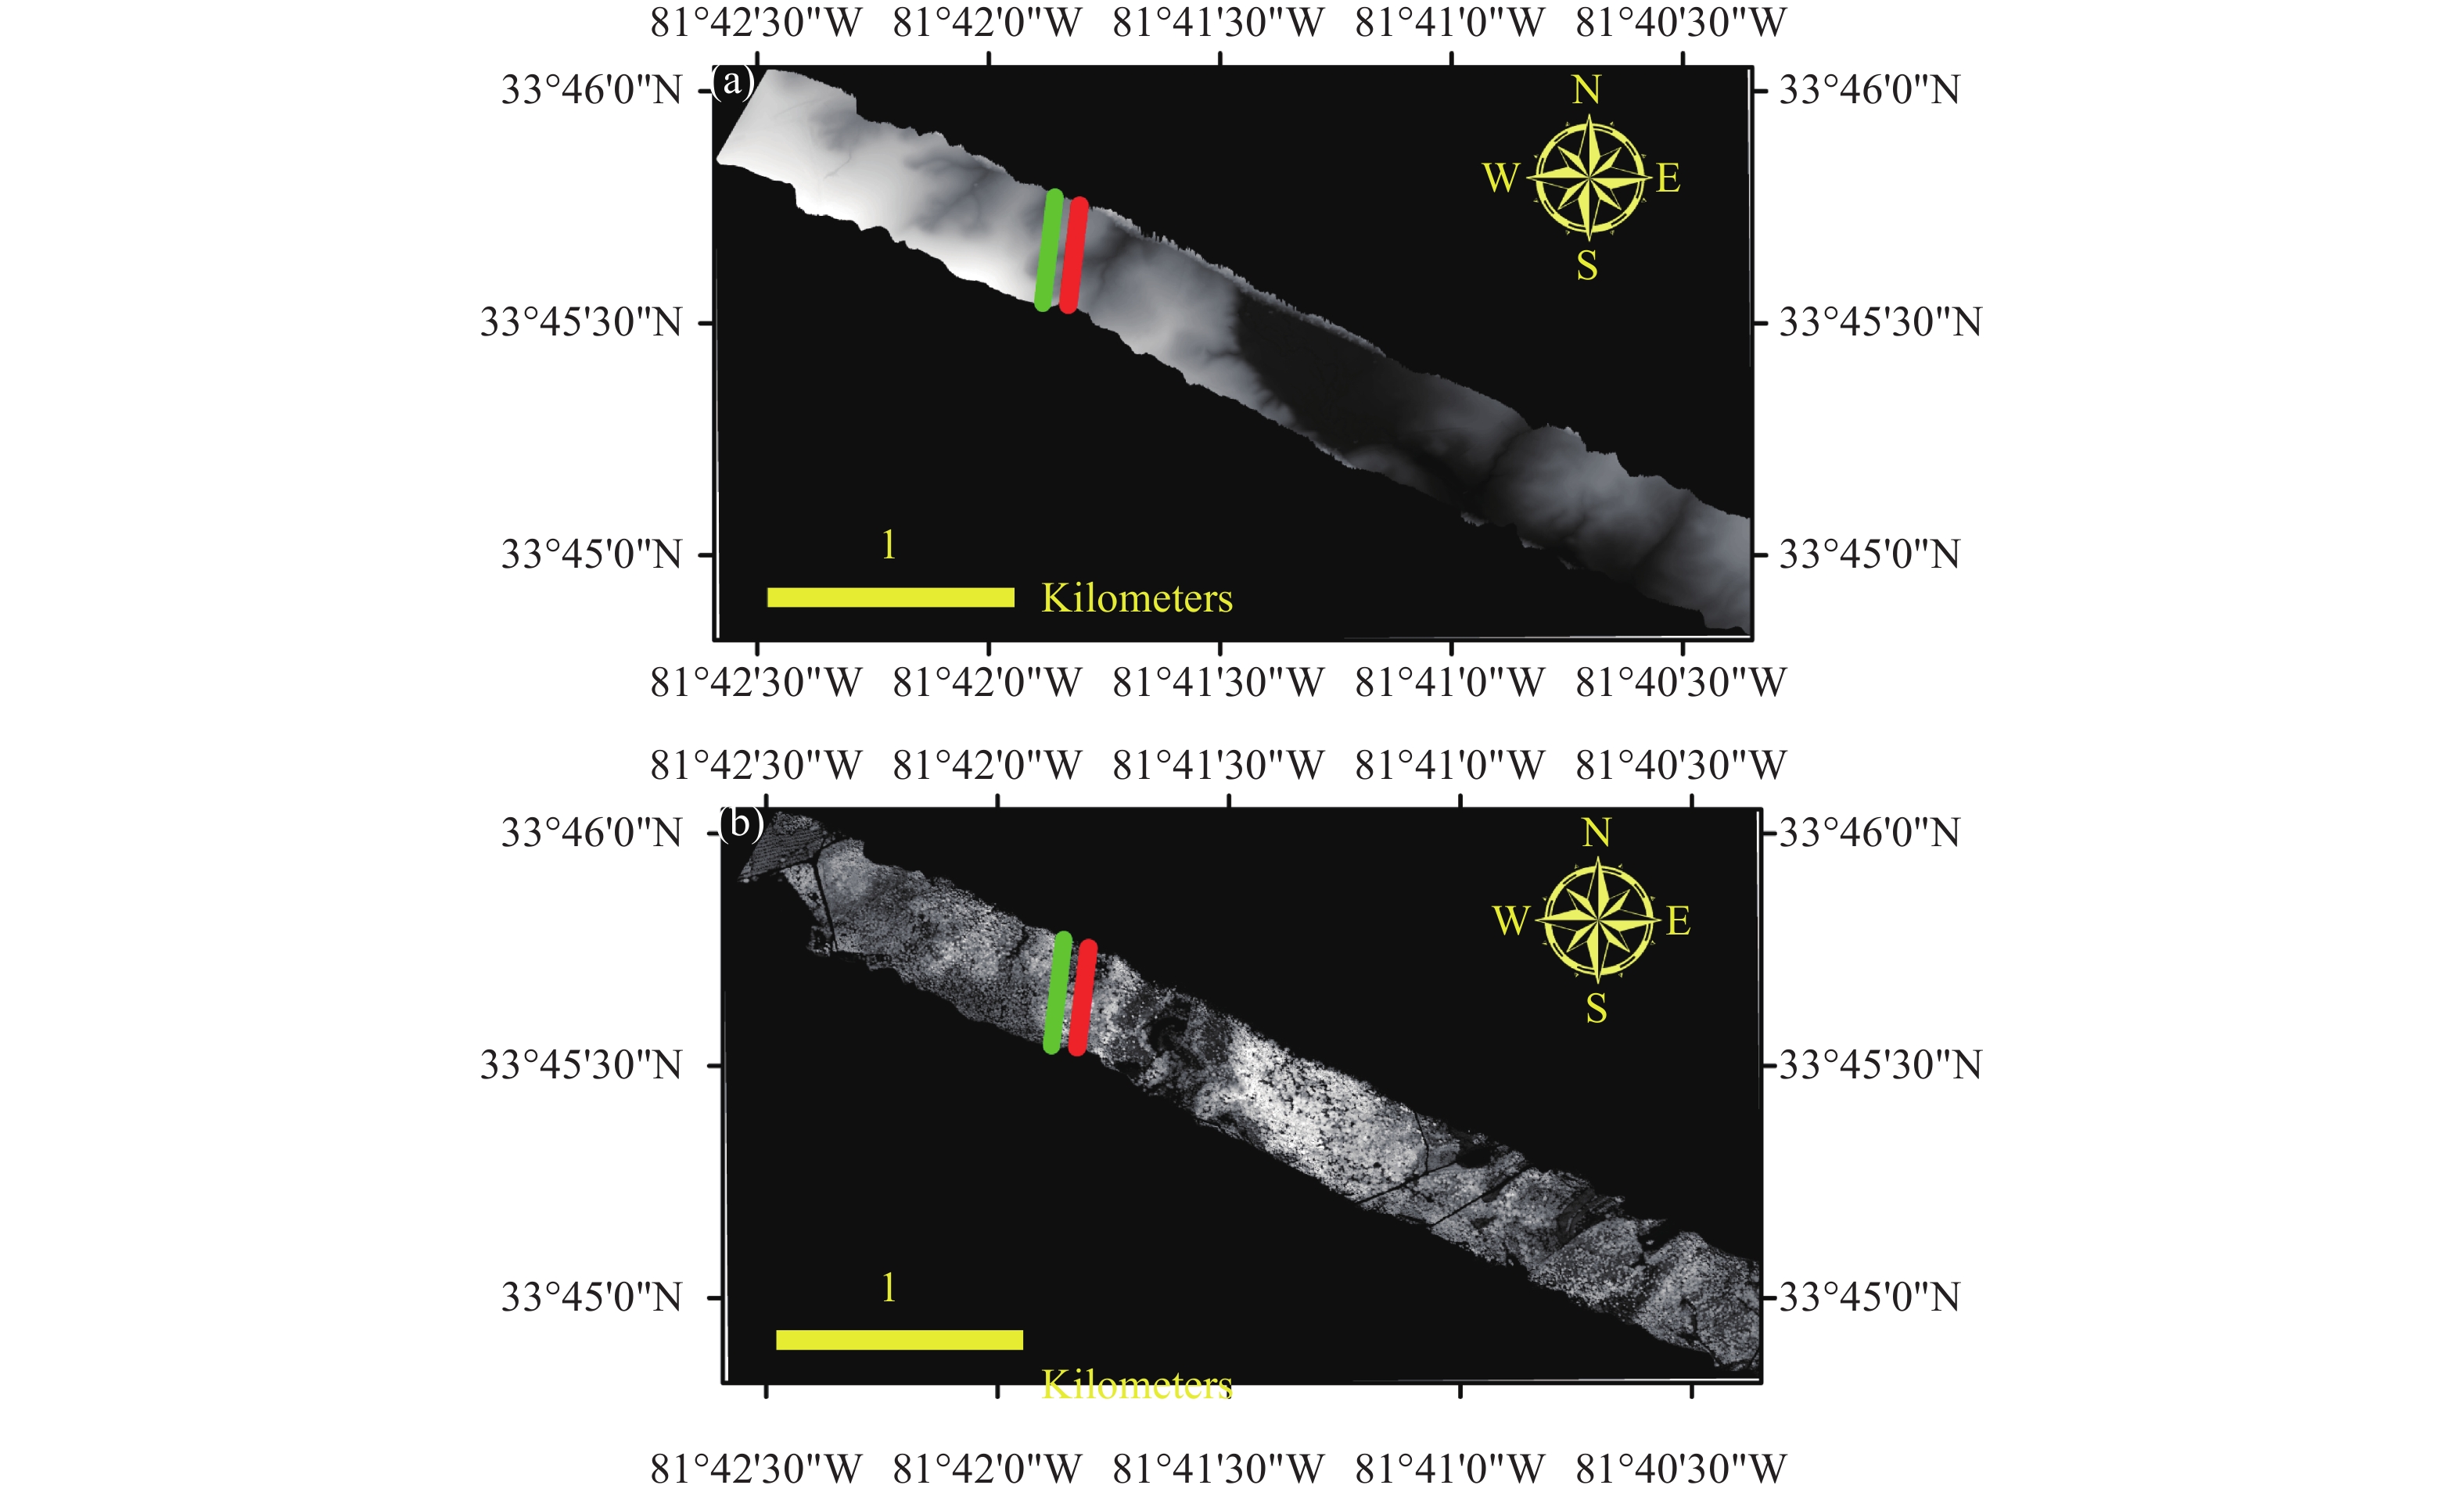
(3)通过ATL03数据产品中光子云数据的经纬度信息获取对应G-LiHT的DTM数据和CHM数据作为验证数据,如图4所示。图4(a)、4(b)分别为ATL03数据与对应研究区G-LiHT的DTM数据和CHM数据重合示意图。图中红色轨迹为gt2r轨迹,绿色轨迹为gt2l轨迹。图中ATLAS文件名为:ATL03_20181226053112_13530106_001_01.h5,G-LiHT的DTM、CHM文件名分别为:AMIGACarb_Augusta_FIA_Sep2011_ l47s557_DTM.jpg、AMIGACarb_ Augusta _FIA_Sep2011_l47s557_CHM.jpg。
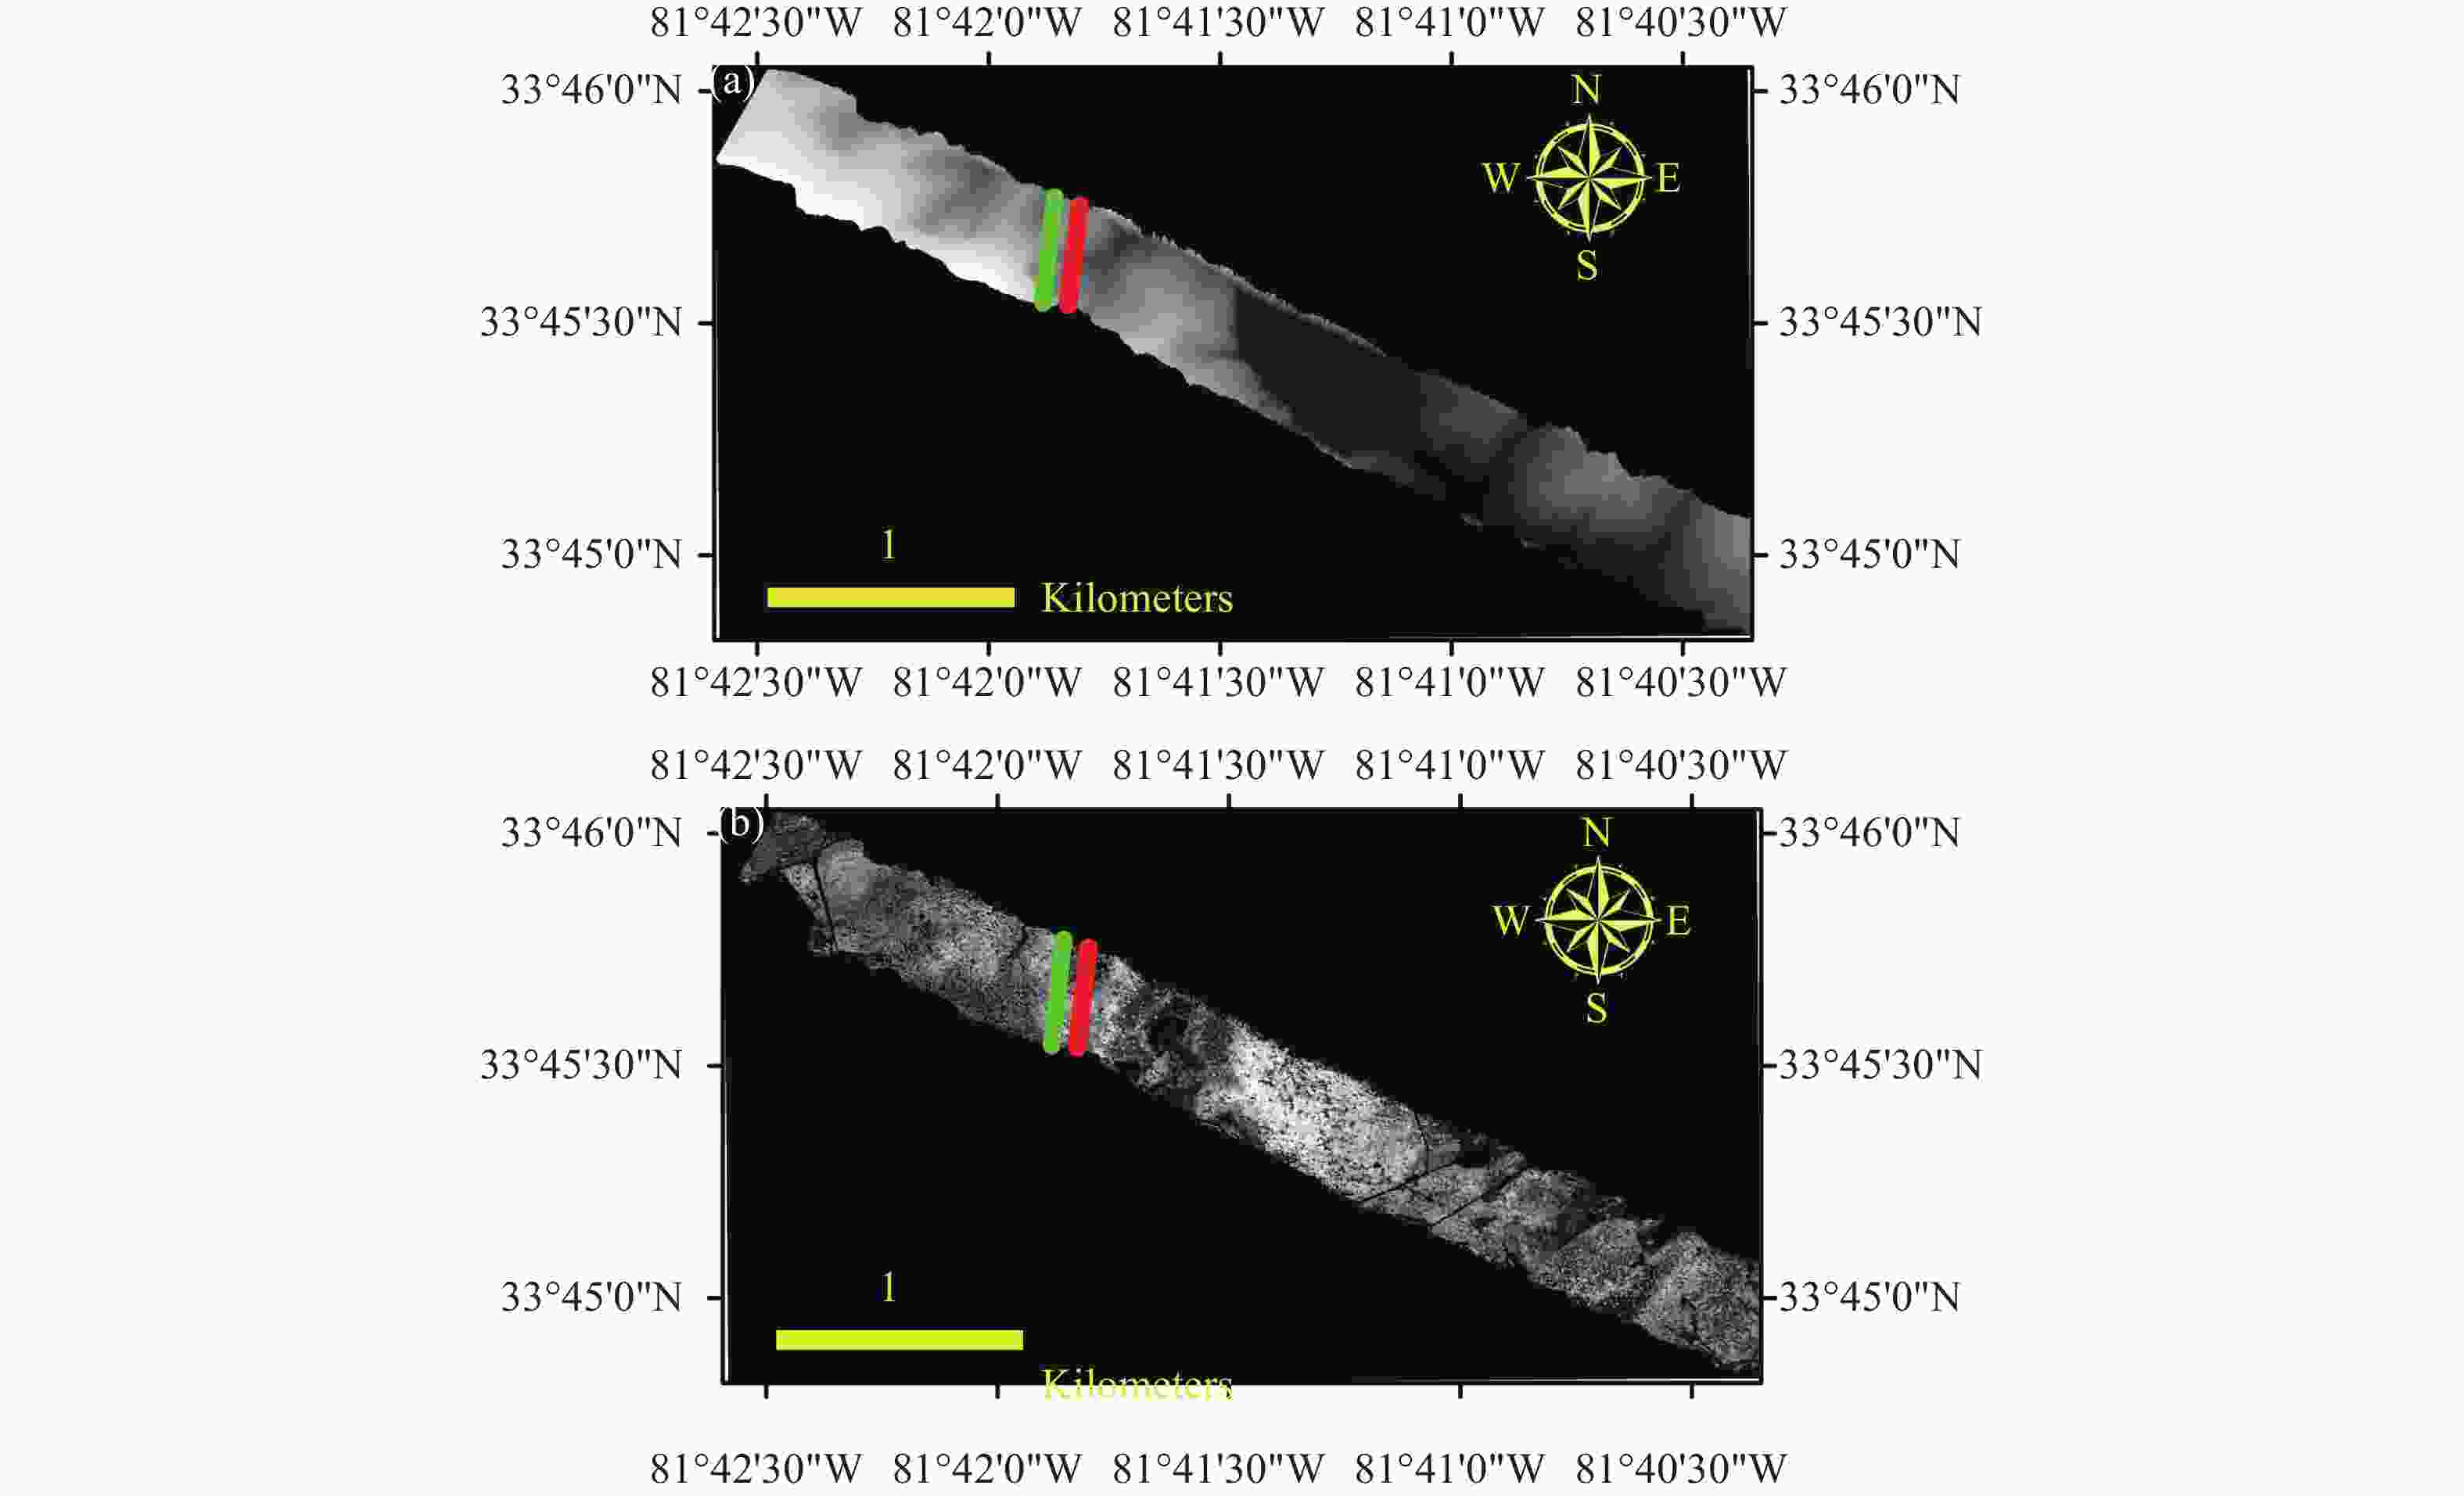
Figure 4. Schematic diagram of overlap between ATLAS data and G-LiHT data
(4)提取ATLAS数据产品中的光子分类参数(classed_pc_flag),关联参数(segment_id、ph_index_beg、classed_pc_indx、ph_segment_id)。关联方式为:遍历ATL03、ATL08的光子云数据,通过ATL03中的segment_id与ATL08中的ph_segment_id匹配两数据文件相同区段,获得该组的起始光子序号(ph_index_beg),光子的相对序号(classed_pc_indx)与所在组的起始光子序号相加,可得到其在ATL03文件中光子数据传输时间序号,即光子数据传输时间序号[21]。由此,可将ATL08中的光子分类参数与ATL03中的光子数据经纬度及高程进行关联,按照ATL08的分类参数确定ATL03光子云数据中的地面光子。
(5) classed_pc_flag为ATL08产品官方提供的NASA官方的光子云数据的分类参数,classed_pc_flag的值可能为0、1、2、3,分别对应噪声光子,地面光子,冠层光子,冠层顶光子。研究选择利用classed_pc_flag=1即ATL08分类为地面的光子作为研究使用的林下地面光子。ATL03与ATL08数据反演林下地形结果如图5所示。图5(a)、5(b)分别为ATLAS的弱光束与强光束对应的反演林下地形示意图,其中红色点为ATL03的数据,蓝线曲线为带有ATL08分类参数的ATL03光子数据所生成的DTM,绿线曲线为G-LiHT数据所生成的DTM。
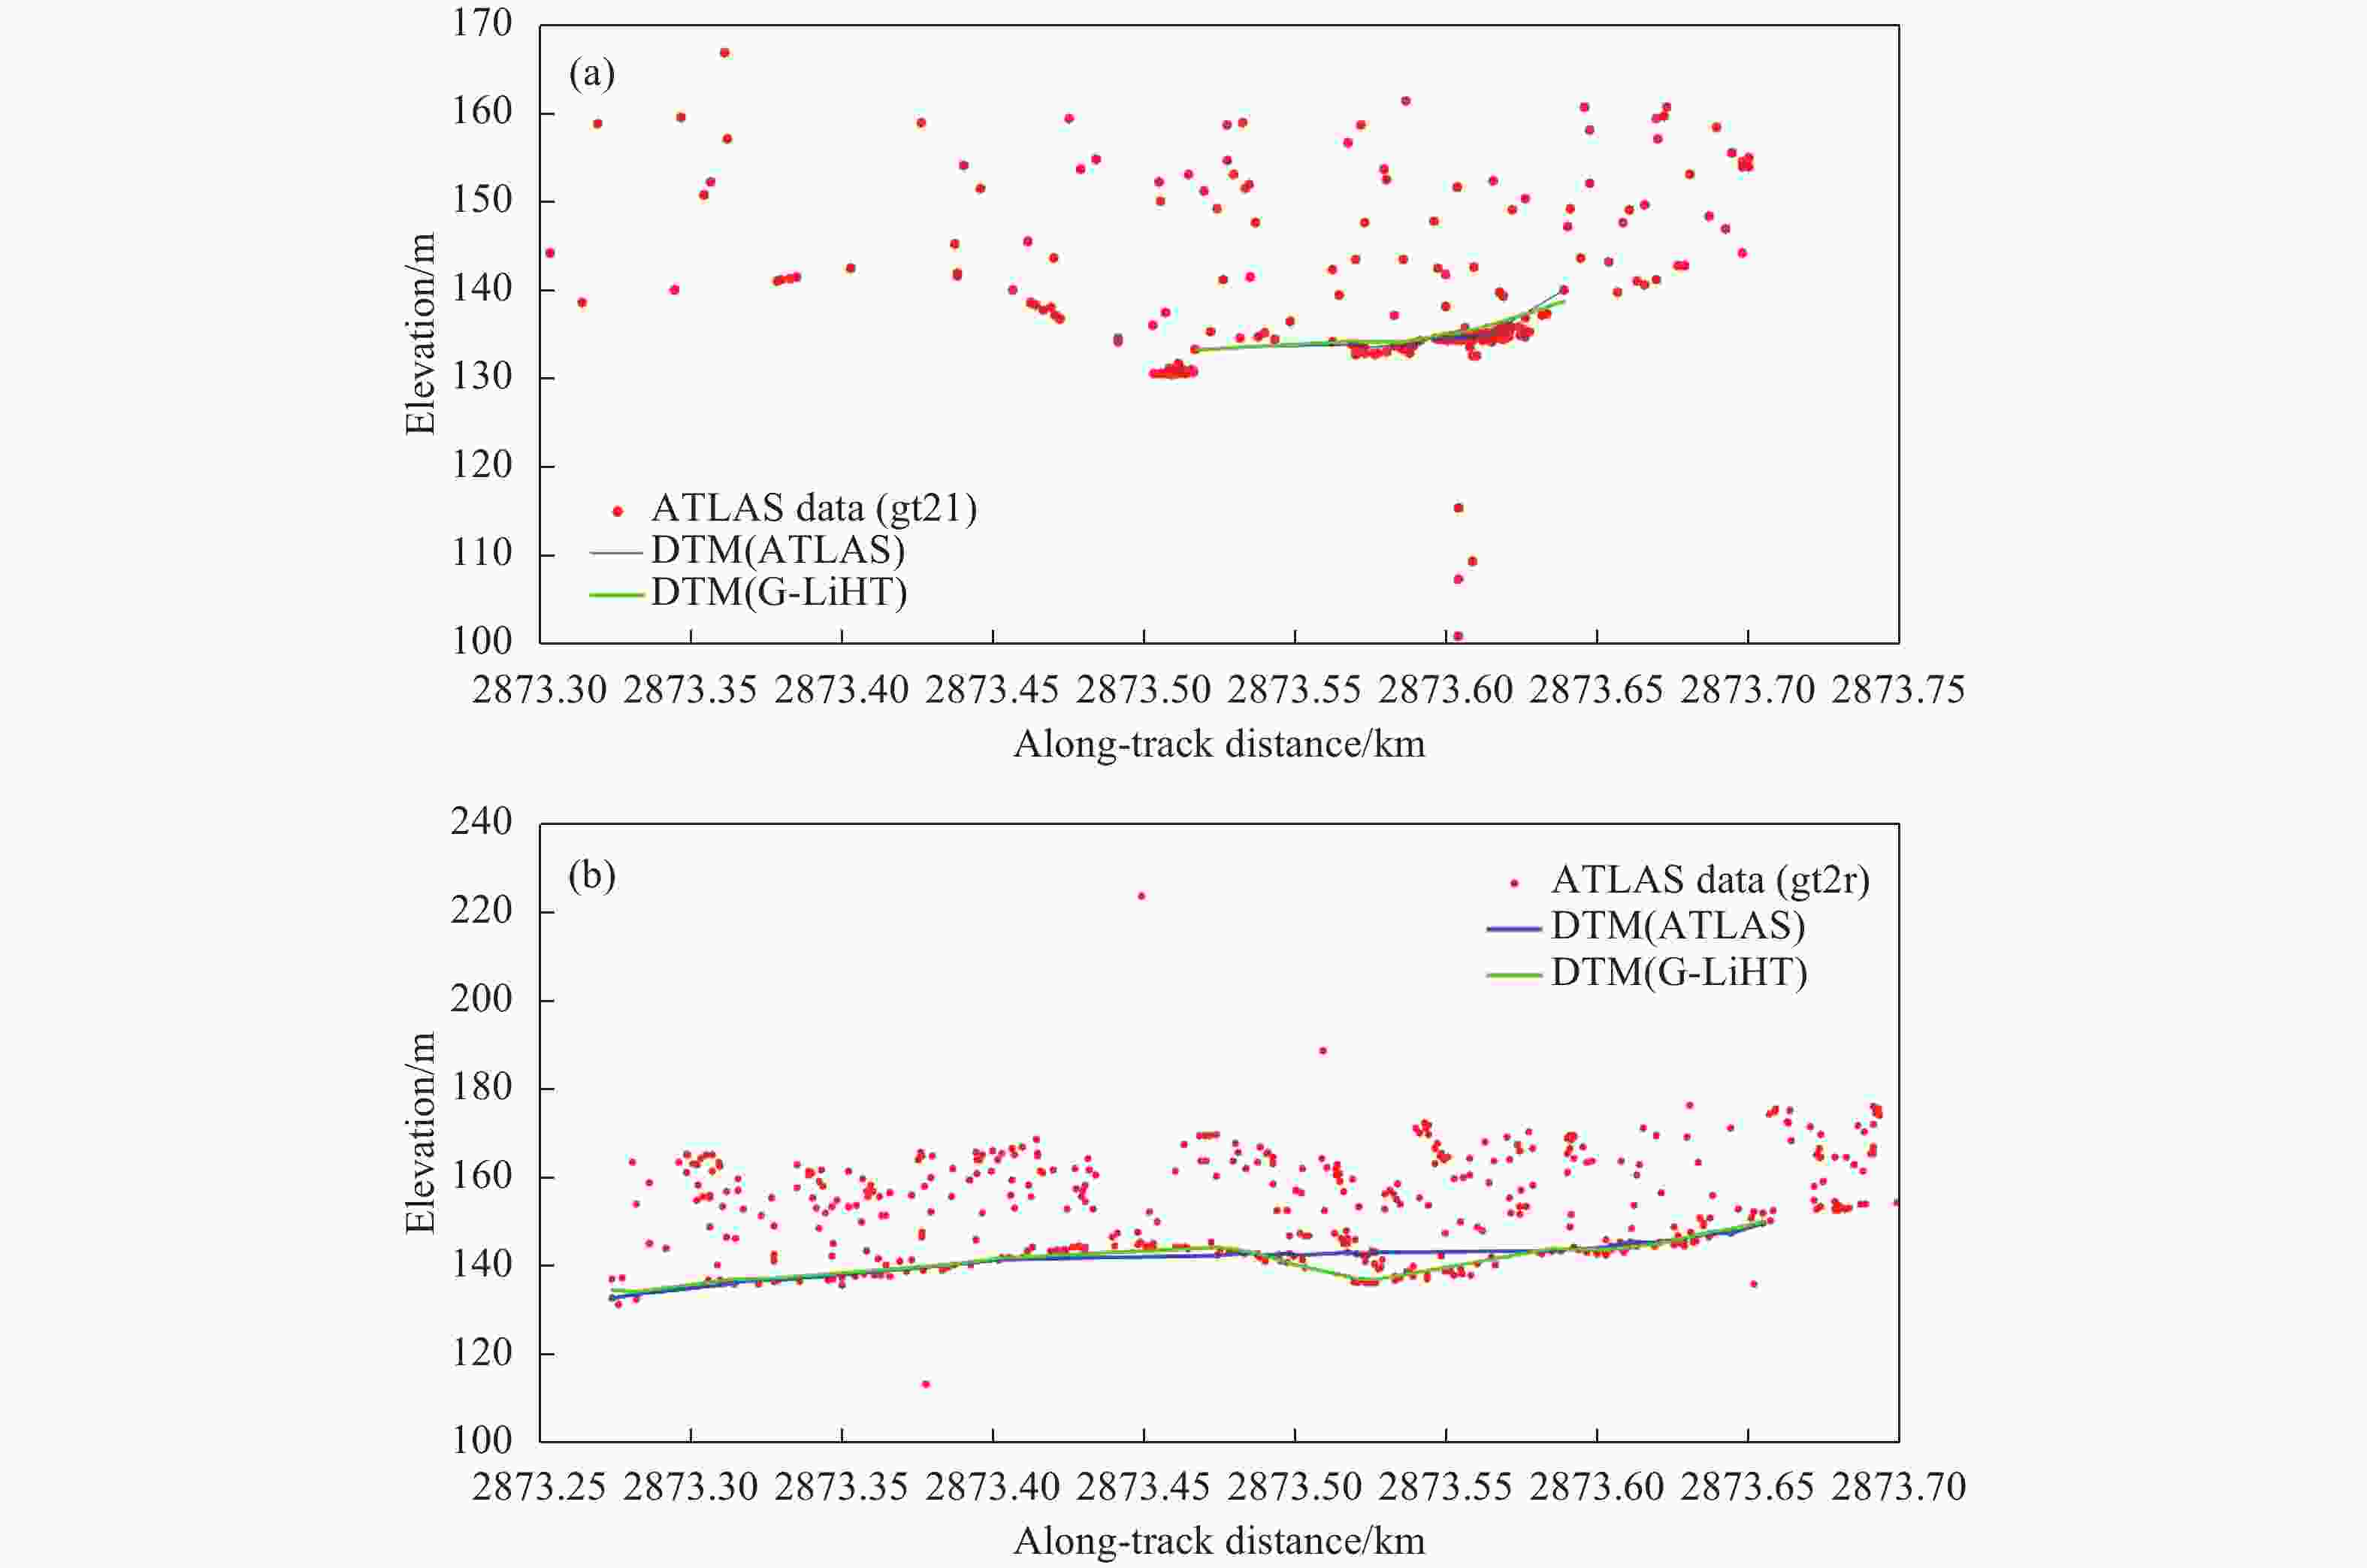
Figure 5. Schematic diagram of ground elevation under forest by using ATLAS and G-LiHT data
(6)比较分析ATL03产品中的地面光子与机载G-LiHT数据对应DTM数值的对应关系。若地面光子的高度与机载G-LiHT数据相应高度之间的绝对差大于20 m,则认为该光子被错误分类并剔除该光子。
(7)为探究不同冠层高度及植被覆盖率对于ATLAS强、弱激光束反演林下DTM的影响程度,研究选择以G-LiHT数据的CHM数据作为冠层高度验证数据,并以5 m为间隔,将研究区足印覆盖的冠层高度分为:0~5 m,6~10 m,11~15 m,16~20 m,大于21 m,统计不同冠层区段内,两种数据反演林下DTM相关性评价数据。
-
为评价ATLAS产品的地面光子高程与机载G-LiHT产品中的DTM数据的关系。研究选择统计了两种数据的均方根误差(RMSE),绝对平均误差(MAE),决定系数(R2),平均误差(ME)定量评价两种数据之间的关系。为探究不同冠层高度对于ATLAS数据反演林下DTM的影响程度,研究拟计算了ATLAS地面光子高程减去机载G-LiTH的对应高程数据,得到对应的高程误差,并统计不同冠层高度内,两组数据的误差统计指标(RMSE、MAE、R2、ME、不同冠层高度数量占比(N)、pearson相关系数、spearman相关系数、kendall相关系数),不同冠层高度内对应的高程误差及植被覆盖率。
-
为探究强弱激光类型的ATLAS数据反演林下DTM精度,统计了强弱激光类型的ATLAS数据反演林下DTM精度如表2所示,散点图如图6所示。
Different laser intensities types RMSE/m MAE/m R2 ME/m Weak beam 0.76 0.54 1.00 0.33 Strong beam 0.74 0.51 1.00 0.27 Mean of different laser intensities types 0.75 0.53 1.00 0.30 Table 2. Estimation accuracy statistics of ATLAS data under different laser types
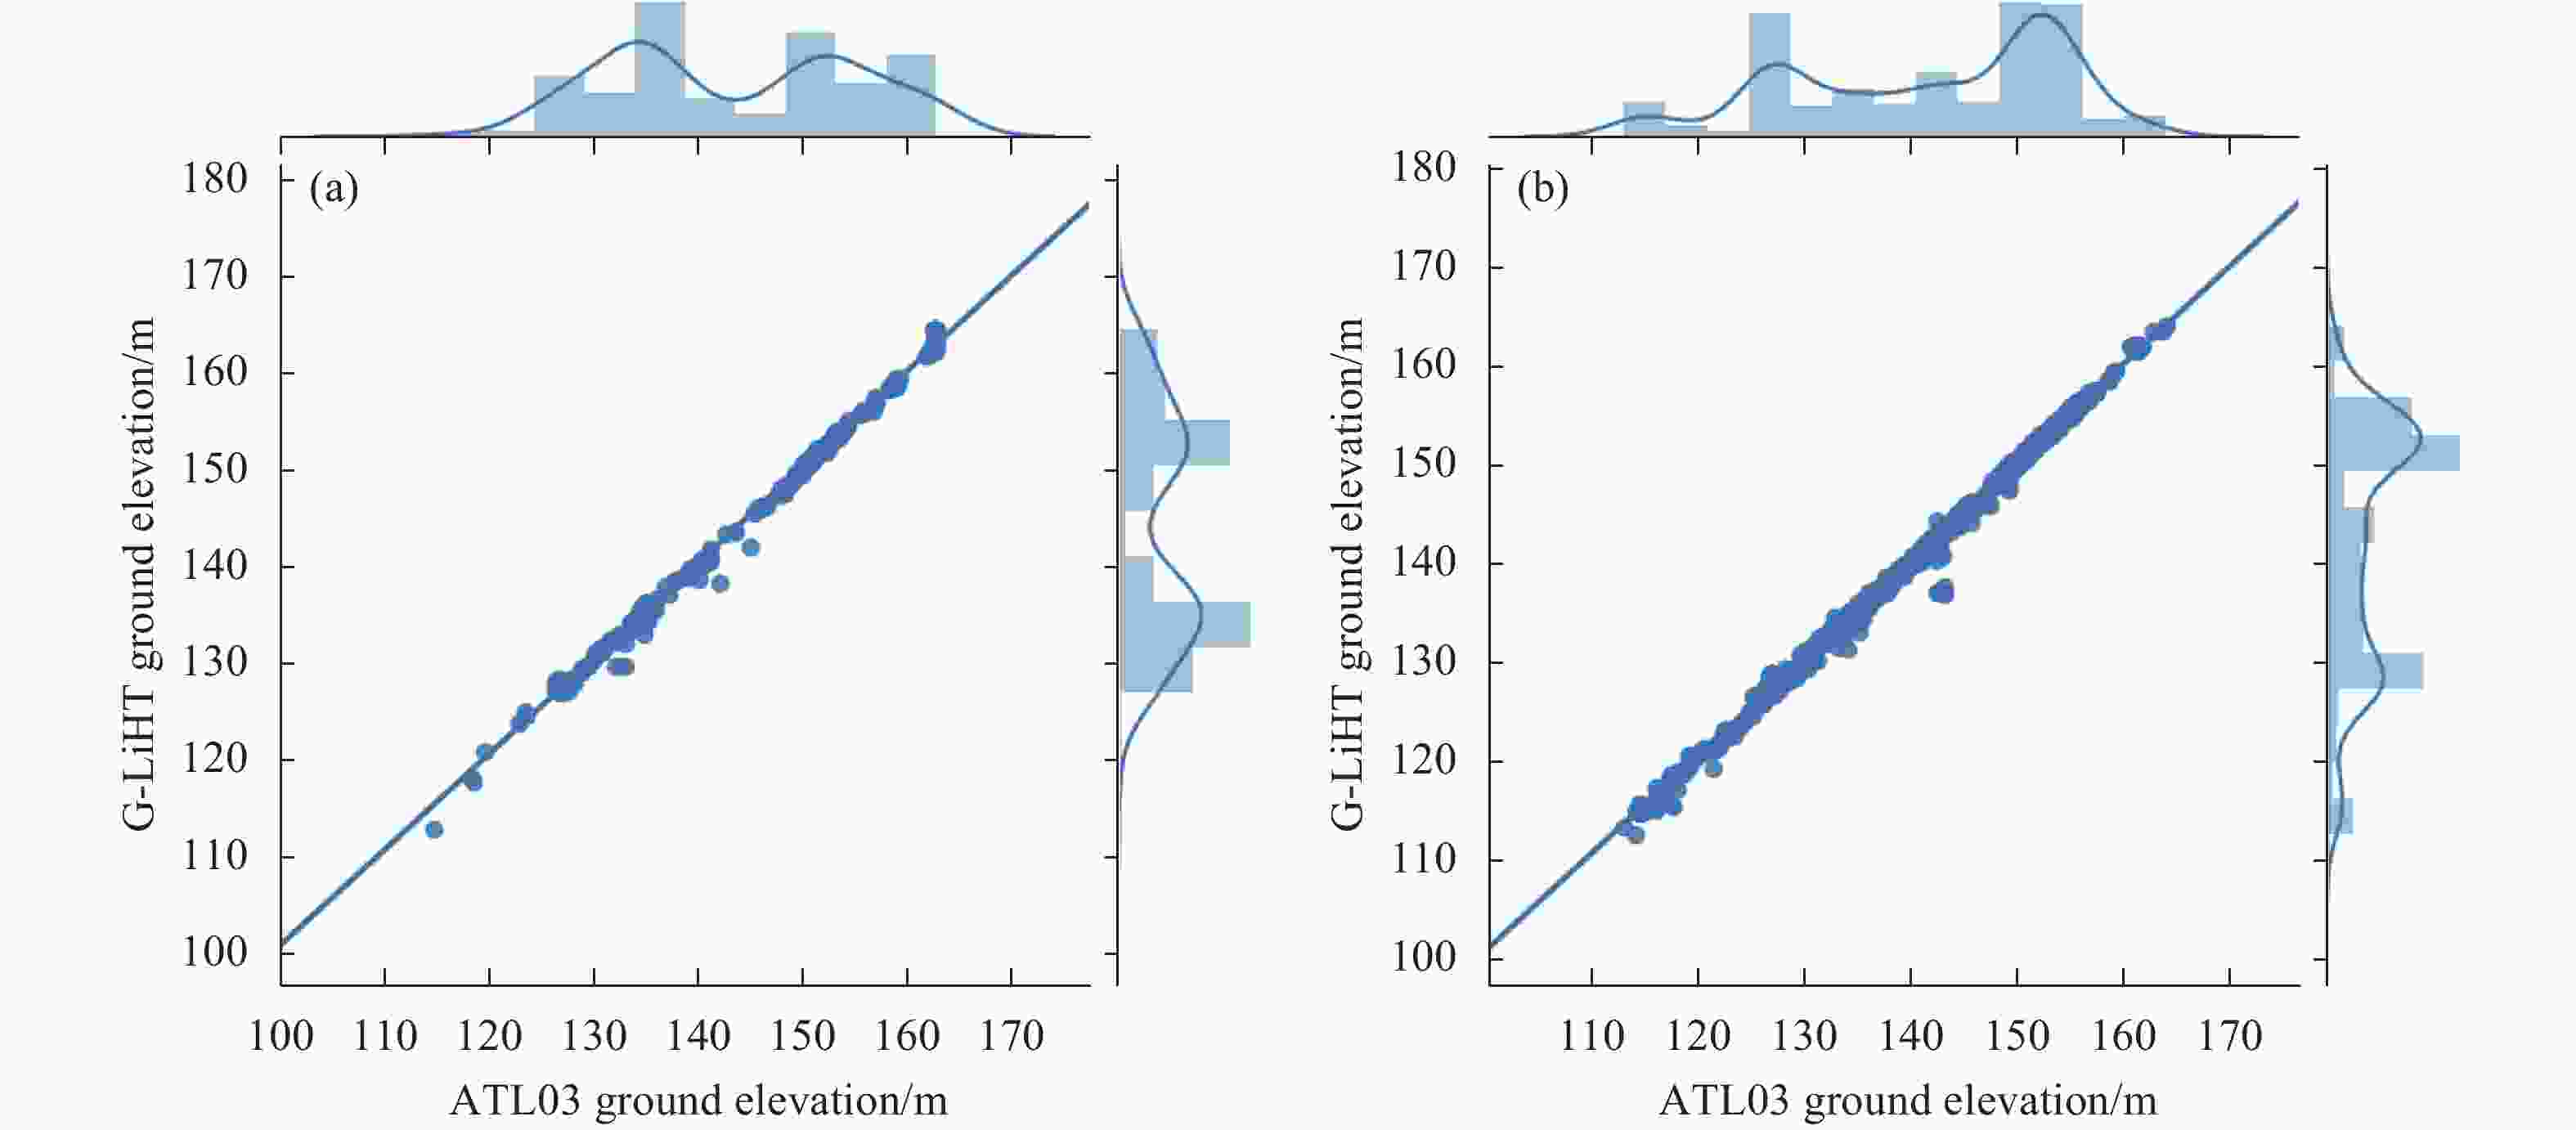
Figure 6. Scatter diagram of ATLAS data and G-LiHT data under different laser types. (a) Weak beam; (b) Strong beam
试验结果的定量结果如图6及表2所示。其中,R2值均为1,说明ATL03数据反演的林下DTM数据与机载G-LiHT的林下DTM高度一致。ATLAS数据的RMSE平均值和MAE平均值分别为0.75 m和0.53 m。强、弱光束条件下,RMSE分别为0.74 m、0.76 m,MAE分别为0.51 m、0.54 m。研究结果显示,该研究的强弱光束反演结果相对参考文献[15-16]表现出更高的R2,与更低的RMSE、MAE。试验结果显示,该研究中强光束类型相对弱光束类型表现出更优的反演精度。试验结果表明,激光强度对于ATLAS数据反演林下DTM存在影响,由于强、弱波束类型的标定激光发射强度比为4∶1[18],当测量同一类植被类型时,强波束类型可以获得更多的光子数据,用以描述被测地物,但是此次研究结果表明两种激光波束都可以为反演林下DTM提供科学数据。
-
为探究冠层高度对于ATLAS强、弱激光束反演林下DTM的影响程度,统计不同冠层高度条件下强、弱波束数据反演精度评价标准及植被覆盖情况如表3所示,其中表3中的植被覆盖率为该区段冠层高度情况下覆盖占比最大的植被覆盖率[20]。不同冠层高度条件下两组数据误差的箱形图如图7所示。
Canopy heights/m RMSE/m MAE/m R2 ME/m N pearson spearman kendall Vegetation coverage 0-5 0.49/0.90 0.41/0.57 1.00/0.99 0.33/0.32 21.39%/20.48% 1.00/1.00 1.00/0.99 0.95/0.93 27%(28.5%)/25%(35.7%) 6-10 0.47/0.50 0.41/0.38 1.00/1.00 0.29/0.25 22.37%/24.34% 1.00/1.00 1.00/0.99 0.97/0.94 27%(33.0%)/66%(36.4%) 11-15 0.52/0.82 0.42/0.68 1.00/0.99 0.33/0.56 27.20%/33.01% 1.00/1.00 1.00/0.99 0.96/0.94 36%(30.4%)/66%(61.8%) 16-20 0.66/0.97 0.47/0.76 1.00/0.99 0.35/0.50 13.28%/11.57% 1.00/1.00 0.99/0.94 0.93/0.84 36%(50.0%)/66%(51.0%) 21- 1.25/0.66 0.99/0.58 0.98/0.98 0.77/0.41 15.76%/10.60% 0.99/1.00 0.84/0.68 0.67/0.52 36%(42.0%)/40%(30.9%) 注:表格中数据分别为强波束数据/弱波束数据的精度统计数据 Table 3. Estimation accuracy statistics of strong beam and weak beam data under different canopy heights

Figure 7. Estimation accuracy of ATLAS data under different canopy height conditions. (a) Strong beam; (b) Weak beam
由于研究区处于亚热带季风湿润气候,森林冠层高度范围为0~34.8 m,故研究选择将植被冠层高度值分为5组,每组间隔5 m,如表3中N所示每组冠层高度数据分布较为平均。
表3中统计了各冠层高度区段内占比最高的植被覆盖率,由表3植被覆盖率情况可知,从研究区冠层高度整体变化趋势来看,随着冠层高度的增加,植被覆盖率也随之增加。但是,在弱光束冠层高度大于21 m的情况下,出现了植被覆盖率降低的情况。
由表3可知,从不同统计指标的整体变化趋势来看,在研究区冠层高度内,随冠层高度及植被覆盖率的增加,强波束激光束的MSE、MAE、ME也逐步增加。不同类型相关系数随植被冠层高度及植被覆盖率的增加,出现冠层高度与高程误差的相关性逐步降低的情况,该情况与参考文献[16]表现类似。其原因可能是由于随植被冠层高度及植被覆盖率的增加,ICESat-2/ATLAS发射的光子通过森林植被进而撞击地表和经过地表反射回ICESat-2接收器的概率降低,进而造成较大的高程误差。
由表3还可知,在研究区冠层高度范围为6~20 m的情况下,虽然主要植被覆盖率保持在66%,但是随冠层高度的增加,弱波束激光束的MSE、MAE、ME逐步增加。不同类型相关系数随植被冠层高度的增加,出现冠层高度与高程误差的相关性逐步降低的情况。其原因可能是由于随冠层高度的增加,地表反射回ICESat-2接收器的概率降低。这种情况表明,即使在植被覆盖率一定的情况下,随冠层高度的增加,误差也会随之增大。在冠层高度范围为0~5 m的条件下,出现RMSE与MAE不符合强波束激光类型的变化情况,其原因可能是由于弱激光束能量相对较低,在冠层高度为0~5 m的情况下,ICESat-2/ATLAS的光子较少,地面信号光子与冠层信号光子距离较近,难以通过ATL08的分类算法区分冠层信号光子与地面光子,故出现较大误差。在研究区冠层高度大于21 m的情况下,出现RMSE与MAE不符合误差随冠层高度增加而增加的情况,综合考虑冠层高度与植被覆盖率可知,虽然冠层高度增加,但是植被覆盖率出现降低情况,这种情况表明,冠层植被覆盖率也是影响光子云数据反演林下地形的一个重要因素。
-
为探究ICESat-2/ATLAS不同激光类型数据反演林下DTM的精度,以美国Aiken郡的林区作为研究区,以G-LiHT数据作为验证数据,分析了ICESat-2/ATLAS的不同激光类型数据的反演精度,并着重讨论了冠层高度及植被覆盖率对于反演精度的影响得出以下结论:
(1)研究结果显示,强波束反演精度为R2=1,RMSE=0.74 m,弱波束反演精度为R2=1,RMSE=0.76 m。虽然强波束反演林下DTM的精度表现优于弱波束,但是,强光束与弱光束的数据均可为反演林下DTM提供科学数据。
(2)从研究区植被整体情况来看,随冠层高度及植被覆盖率的增加,ICESat-2/ATLAS的不同激光类型数据均出现误差逐步增加的情况。
总体而言,研究针对ATLAS反演林下地面高程进行了初步探索,并探讨了冠层高度对地面高程误差的影响,这将为ATL03数据反演林下地面高程提供基础。但是,该研究主要分析了冠层高度对于ATLAS数据反演林下地面高程的影响,下一步的研究重点为植被覆盖率、森林类型等因素对于ATLAS数据反演林下地形的影响。
Accuracy verification of terrain under forest estimated from ICESat-2/ATLAS data
doi: 10.3788/IRLA20200237
- Received Date: 2020-06-09
- Rev Recd Date: 2020-07-10
- Publish Date: 2020-11-25
-
Key words:
- ICESat-2/ATLAS /
- strong beam /
- weak beam /
- digital terrain model under the forest /
- canopy height
Abstract: In view of the difficulties in retrieving Digital Terrain Model (DTM) with the spaceborne lidar data, the terrain elevation estimation accuracy of Ice, Cloud, and land Elevation Satellite-2 (ICESat-2)/Advanced Terrain Advanced topographic laser altimeter system (ATLAS) strong and weak beam data under the forest was studied, and the effect of canopy height and vegetation coverage on ICESat-2/ATLAS estimation accuracy of DTM was explored. The results show that the accuracy of DTM under the forest with strong beam estimation accuracy is R2=1, RMSE=0.74 m, and that with weak beam estimation accuracy is R2=1, RMSE=0.76 m. The performance of the strong beam estimation accuracy performed better than that of the weak beam, but both the photon cloud data of the strong beam and the weak beam can provide scientific data for estimating the DTM under the forest. In the study area, with the increase of the canopy height and vegetation coverage, the error of different laser types data gradually increases.


 DownLoad: