


-
Near-infrared spectroscopy refers to electromagnetic waves in the wavelength range of 780-2526 nm between visible light and medium-to-near-infrared light. It’s produced by the absorption of the main frequency and frequency of molecular vibrations when a non-resonant vibrational molecule transitions from the ground state to a high energy level state[1-10]. The analysis technology based on near-infrared spectroscopy is favored in chemical composition analysis, quality inspection and other fields due to its advantages of fast detection speed, high sensitivity, and no damage detection, etc. However, conventional near-infrared spectrometers are bulky, slow to sample, and costly for special environmental applications. With the urgent need for miniaturization and portability of instruments for special applications such as environmental testing and mineral exploration, small near-infrared spectroscopy equipment has become a research hotspot in recent years [11-12]. This paper combines digital micromirror device (DMD) and grating near-infrared spectroscopy technology to study the small near-infrared spectrometer based on DMD. It mainly focuses on the simulation design method of the spectroscopic imaging system. It has broad application prospects in practical applications.
-
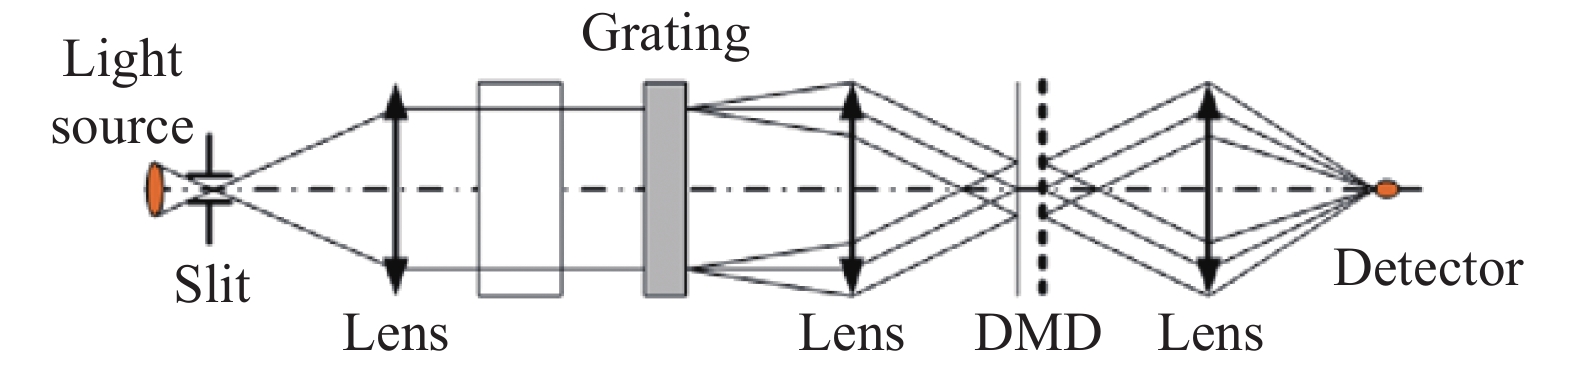
The DMD-based NIR spectrometer optical structure mainly includes a light source, a collimator lens, a grating, an imaging lens, a DMD, a focusing lens, a detector, a spectrum acquisition and processing system. The schematic structure is shown in Fig.1.
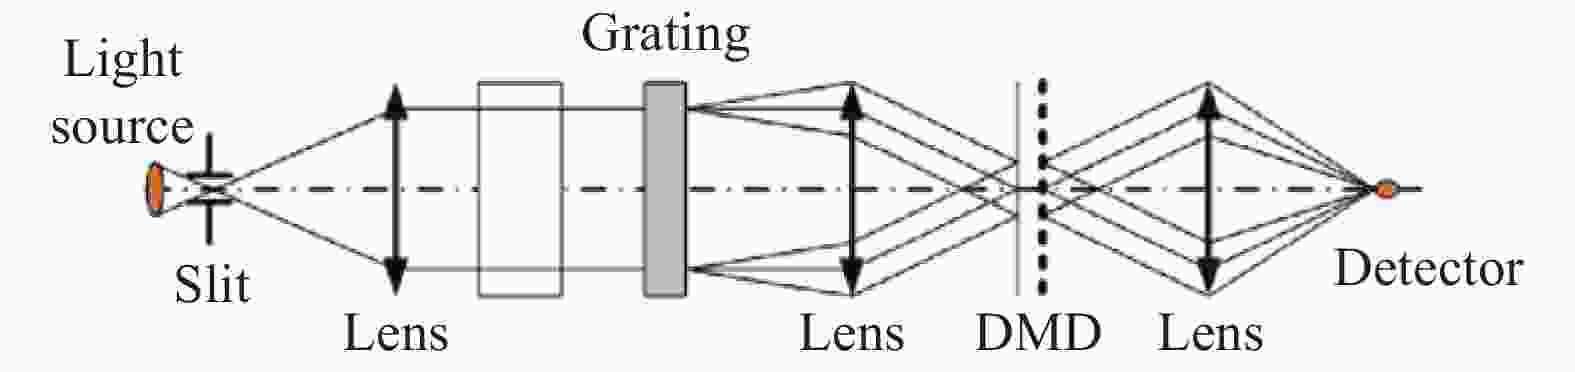
Figure 1. Schematic diagram of DMD-based spectrometer optical system
The light emitted from the light source passes through the slit and then enters the collimator lens. The collimator lens collimates the light into a multi-color parallel light through the sample cell, and the light that carries the sample information is incident on the planar reflective grating for diffraction and dispersion into a spectral band. Then, the image of the slit is imaged on the surface of the DMD by the imaging lens according to the wavelength. At this time, the DMD has two states: the incident light is reflected into the converging lens when the state is +12°, and the incident light is reflected into the absorbed by the absorption cell when the state is −12°. All the light entering the converging lens is converged on the detector for receiving. The detector measures the light intensity of different wavelengths in time, and the spectrum diagram containing the sample information is obtained after data processing.
-
The entrance slit is an important factor of the spectrometer. The smaller the slit is, the higher the resolution of the system is. On the contrary, the lower the resolution, the smaller the slit is, the higher the energy is in the system. According to the Rayleigh criterion, the resolution can be expressed as:
Assuming that the entrance slit width is a, spectral broadening
$\Delta {\lambda }' $ can be expressed$ \dfrac{a}{{\rm{d}}l/{\rm{d}}\lambda } $ according to the grating dispersion formula, where$ {\rm{d}}l/{\rm{d}}\lambda $ is the liner dispersion of the grating[13-14]. Moving$ {\lambda }_{1} $ to the left$\Delta {\lambda }'/2 $ made the spectrum resolvable, but the resolution of the spectrum is reduced and the resolution expression is:where
${\lambda _1}^\prime ={\lambda _1}+\Delta {\lambda ^\prime }/2$ -
The larger the focal length of the collimator lens is, the better the parallelism of the collimated light is. But when the system NA value is constant, increasing the focal length will increase the incident aperture, resulting in an increase in system aberration and reducing the spectral resolution; In addition, it also increases the system's size and the cost of the instrument. The focal length of the collimator lens can be chosen to balance the needs of the above two aspects. After the incident light is split by the grating, it is incident on the DMD, and only the micromirror with the DMD is at 12° to reflect the incident light to the subsequent optical system. According to the principle of geometrical optics, without considering slit diffraction and aberration, the linear dispersion of the DMD surface can be expressed:
where σ is the angle between the central axis of the imaging lens and the focal plane normal. In the DMD operating state, σ is 12°.
$ {f}_{2} $ is the focal length of the imaging objective, the line dispersion rate is expressed as:Using Eqs. (2), (3) and (4), the focal length of the imaging lens can be obtained:
-
A lens is an optical element in which a transparent medium is interposed between two refractive surfaces. The refractive surface of the lens is mostly a spherical surface. According to the basic principles of geometric optics, the lens focal length is:
where
$ f $ is the focal length of the object,$ {f}^{\mathrm{\text{'}}} $ is the image focal length,$ {r}_{1} $ and$ {r}_{2} $ are the radius of curvature of the two spherical surfaces of the lens, n is the refractive index of the lens, and d is the thickness of the lens[15-16]. -
Spectrometer optical system structure needs to consider the working wavelength range, spectral resolution, luminous flux, volume and its match with the detector and other factors[17], the main performance parameters of the designed spectrometer are shown in Tab.1.
Parameter Value Wavelength range 1000-1700 nm Spectral resolution <15 nm Size <150 mm×150 mm×150 mm Table 1. Main parameters of a DMD-based small NIR spectrometer
-
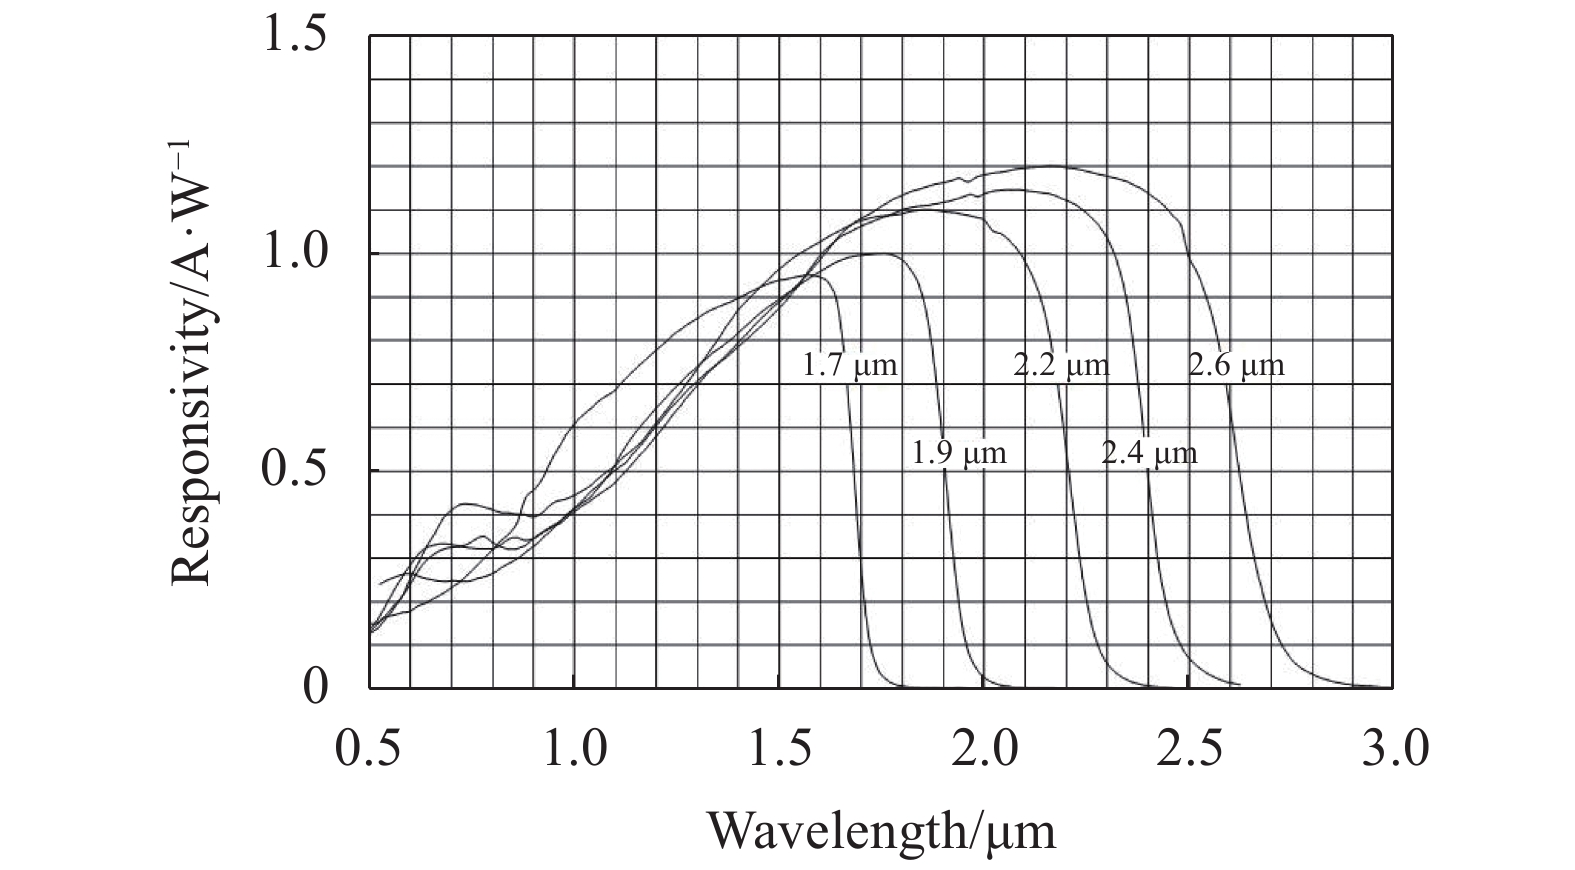
In order to realize the miniaturization of the spectroscopy instrument and satisfy the requirement that multiple channels of data can be collected at one time, a receiver system with high sensitivity and low dark noise should be selected. The InGaAs detector manufactured by Pioneer Technology Inc. is selected as the spectral receiver which has a PDA that is sensitive to near-infrared light and meets the needs of the band of 1000-1700 nm. Its spectral response curve is shown in Fig.2.

Figure 2. Corresponding curves of different bands of InGaAs single-point detector
-
The DMD-based small NIR spectrometer system uses a digital micromirror manufactured by Texas Instruments. The DLP4500NIR model has the advantages of fast switching speed and high reliability. It consists of 1140×912 coated digital micromirrors, each with a size of 7.6 μm×7.6 μm and a diagonal dimension of 10.8 micrometer. Each micromirror can rotate ±12° around the axis of symmetry under the action of an electrostatic drive circuit. Each angle corresponds to a different working state. Its working principle is shown in Fig.3. It keeps the direction of incident light unchanged. When the direction angle between incident light and the normal direction of the DMD surface is 24°, the light of the DMD surface is also emitting at 24° on the other side of the normal, rather than entering the optical system. When the incident light is +12° to the normal direction of the DMD, that is, the micromirror plane is rotated by 12°, the incident light is reflected by the DMD surface and enters the subsequent optical system; when the incident light and the DMD surface normal direction are 36°, the plane of the micromirror is rotated by −12°, and the reflected light and the incident light are emitted at 72°. Reflected light finally is absorbed by the light blocking plate.

Figure 3. Digital micromirror working principle diagram
-
The grating is a very important element in the spectrometer and can directly affect the resolution of the system. We select a planar reflective grating for spectral dispersion, from the grating equation:
where d is the grating constant, i and θ are the incident angle and the diffraction angle, respectively, and m is the diffraction order of the spectrum[11]. Angular dispersion rate of grating can be expressed as:
The dispersion rate of grating line is
where
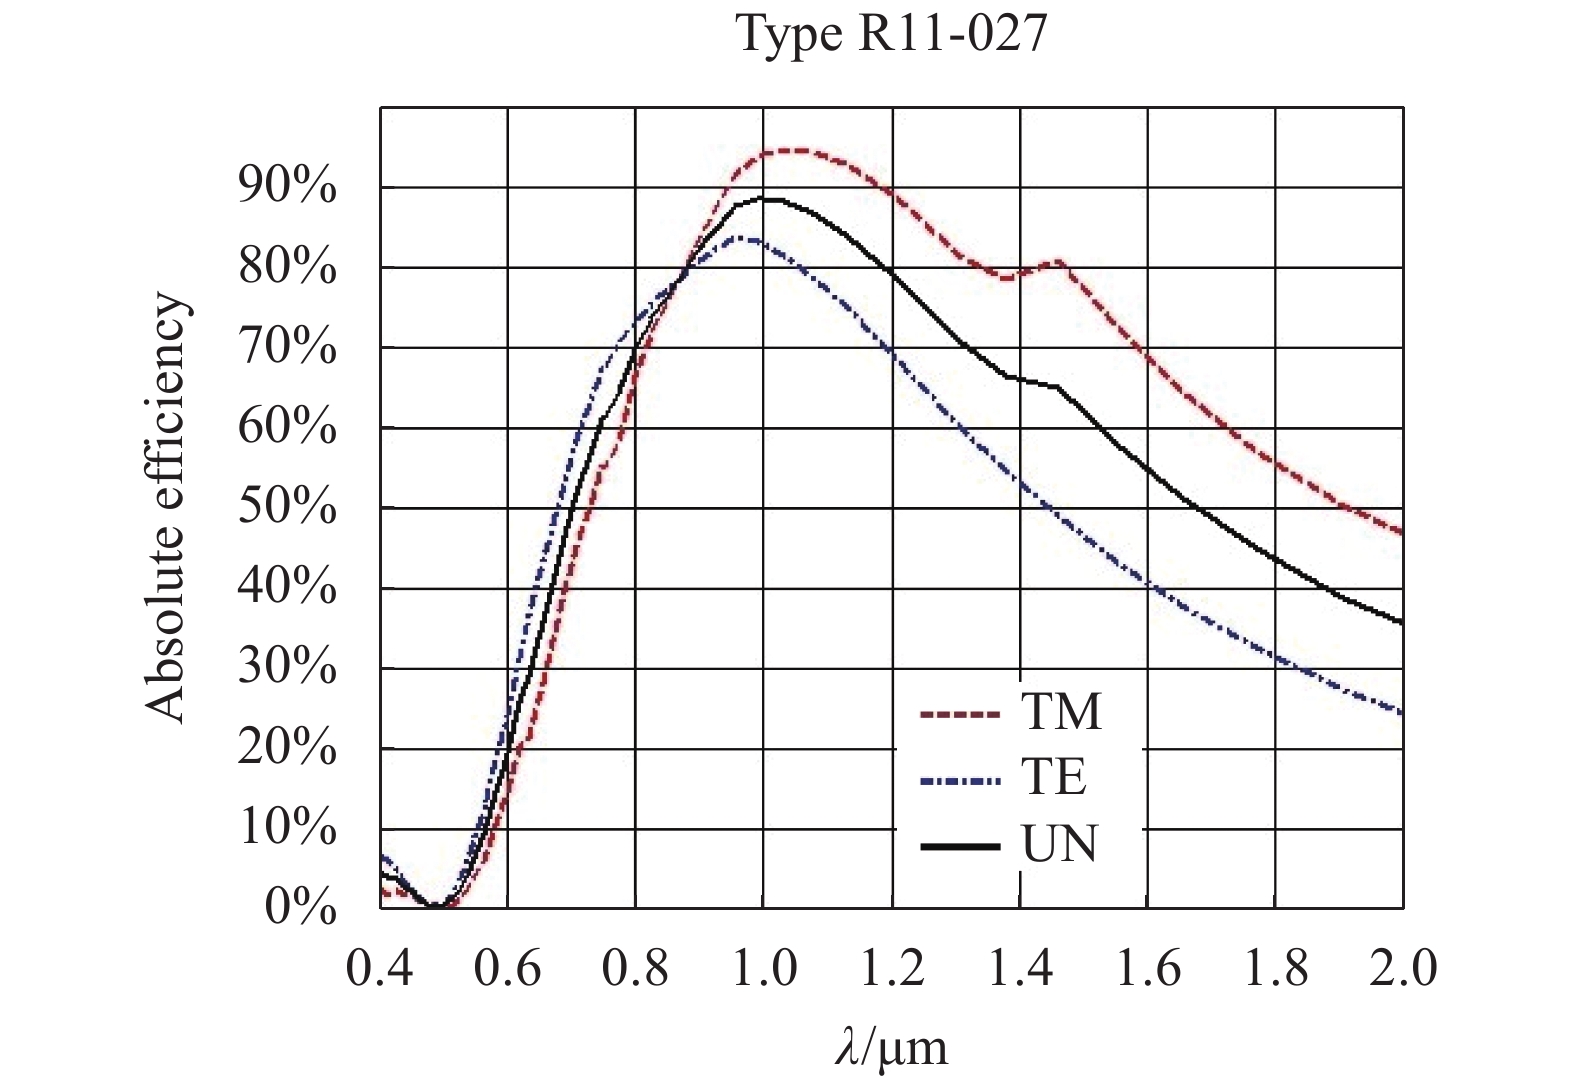
$ {f}' $ represents the focal length of the imaging lens behind the grating. In this design, the line dispersion rate and the size of the DMD's micro-mirror determine the spectral resolution of the spectrometer. According to the theory of diffraction grating, m=1, d=300 l/mm, the blaze angle is 13.0°, and the grating diffraction efficiency curve of the aluminized film is shown in Fig.4.
Figure 4. Diffraction efficiency curve
-
According to the Eqs. (1)-(9), a theoretical calculation model is established by combining the parameters of the detector, the grating, and the DMD. The structural parameters of the optical system obtained using the model are shown in Tab.2.
Parameter Value Working wavelength 1000-1700 nm Slit length 1 mm Slit width 50 μm Collimating lens focal length 75 nm Imaging lens focal length 45 nm Raster line density 300 l/mm DMD pixel size 7.6 μm×7.6 μm DMD pixel number 1140×912 pixels DMD tilt angle ±12° Table 2. Optical system design parameters
-
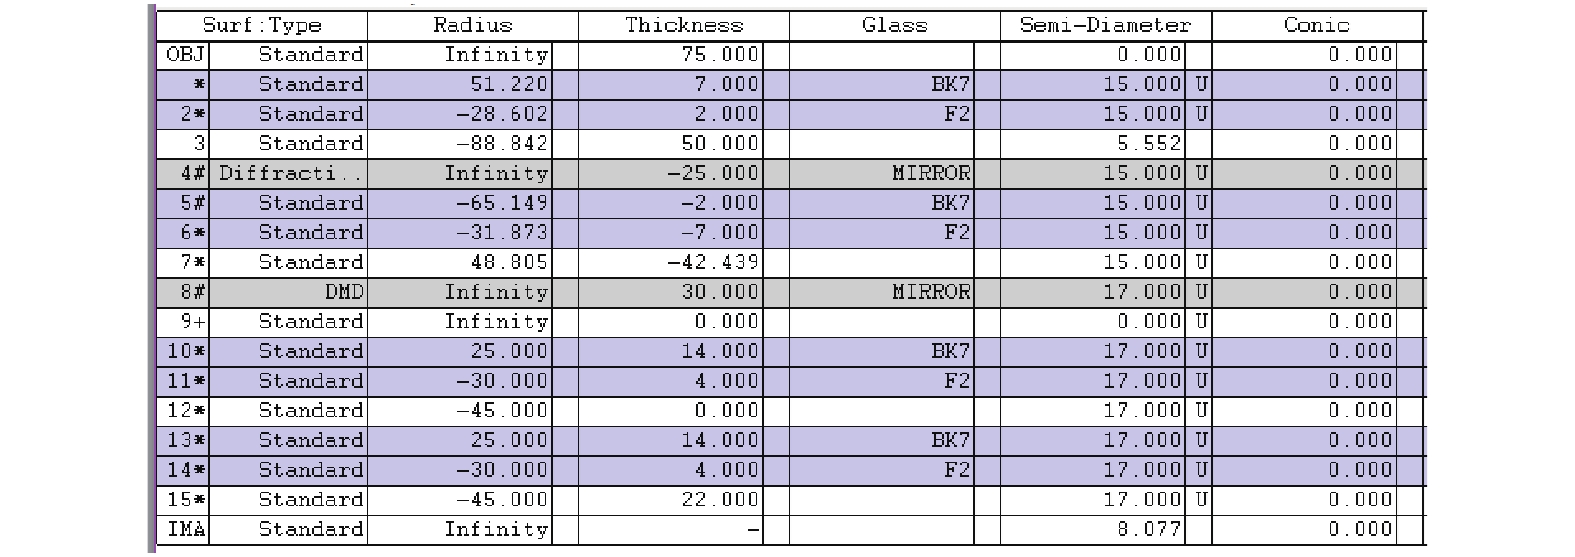
In this paper, the lens is designed as a plano-convex lens because the size of the object point and the aperture of the lens are small. The light source is an ideal point light source. The light path structure adopts a lens collimation light path. The collimating lens, the imaging lens, and the focus lens are designed using a double-glue to be used in a spectroscopic imaging light path system to reduce the influence of aberrations. The entire system is simulated. The resulting parameters of the system are shown in Fig.5, and the corresponding 3D structure system is shown in Fig.6.

Figure 5. System parameter diagram
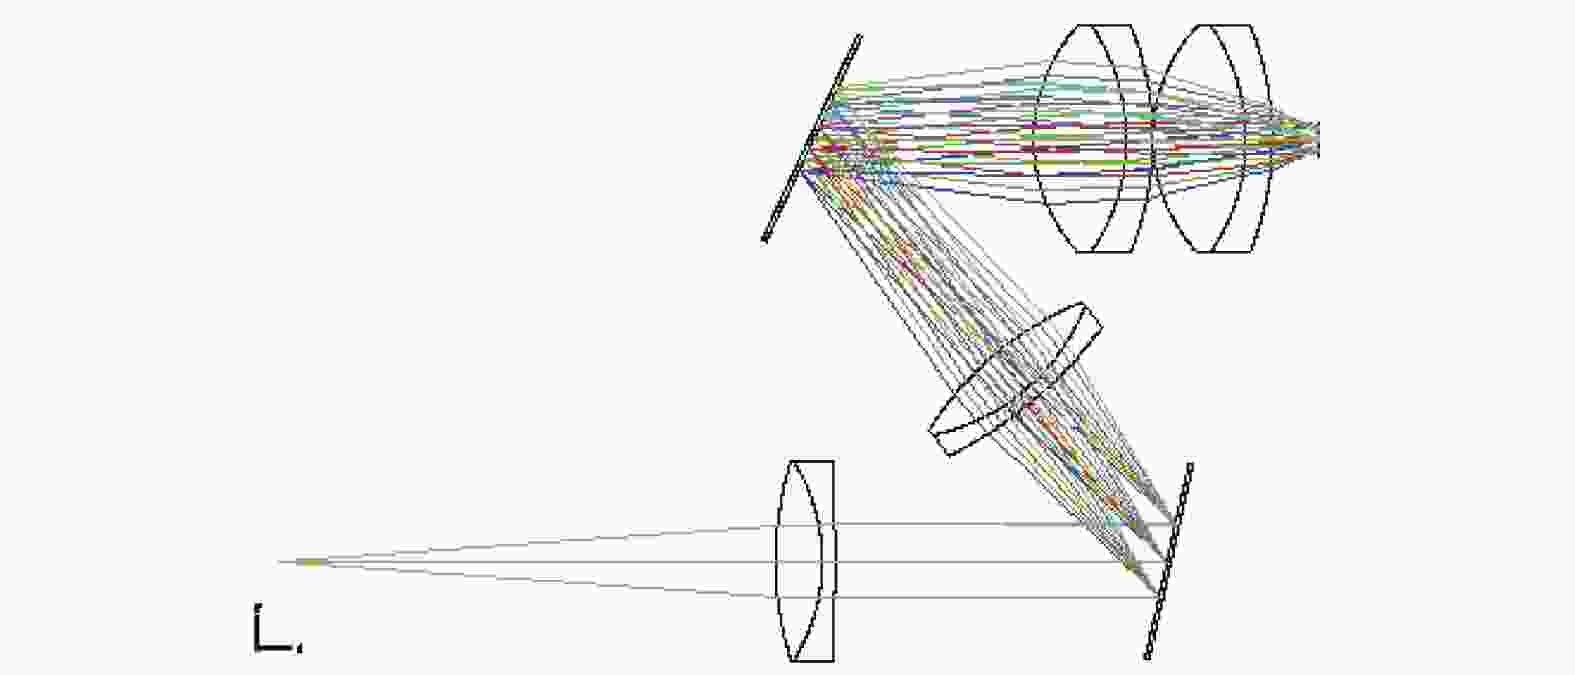
Figure 6. System optimization structure
The proposed method does not consider the influence of the slit width on the optical resolution, the theoretical resolution of the optical system is calculated according to the parameters shown in Tab.2. The DMD is regarded as the theoretical focal plane of the system in this optical system. The distribution of the spectrum on the DMD is 8.57 mm, and the number of micromirrors covering the DMD in the direction of dispersion is 794. The dispersion rate of the grating line is 10.8 μm/δλ, and the theoretical resolution of the available system is 0.88 nm. According to the Nyquist sampling theorem, the theoretical pixel resolution of the spectrometer is 1.763 nm. Considering the better image quality on the detector, the aberrations and dimensions of the imaging image of the detector are optimized and limited. Fig.7(a) is the spot diagram of the point light source imaging after optimization. It can be seen from the figure that the optimized imaging quality is better, and the edge image aberration is smaller, the imaging quality is high, and there is no overlap between adjacent image points. If the spectral resolution of the imaging image at the detector is used to analyze the resolution of the spectrum, a higher resolution can also be achieved. However, in this optical system, the DMD replaces the position of the conventional detector for spectral reception, so the imaging quality on the DMD surface is mainly concerned. And the detector can simply converge all the monochromatic light into a single point detector. Therefore, the position of the detector is adjusted to achieve the most concentrated position of the light convergence, and the spot image of the spot imaging at the detector is shown in Fig.7(b).
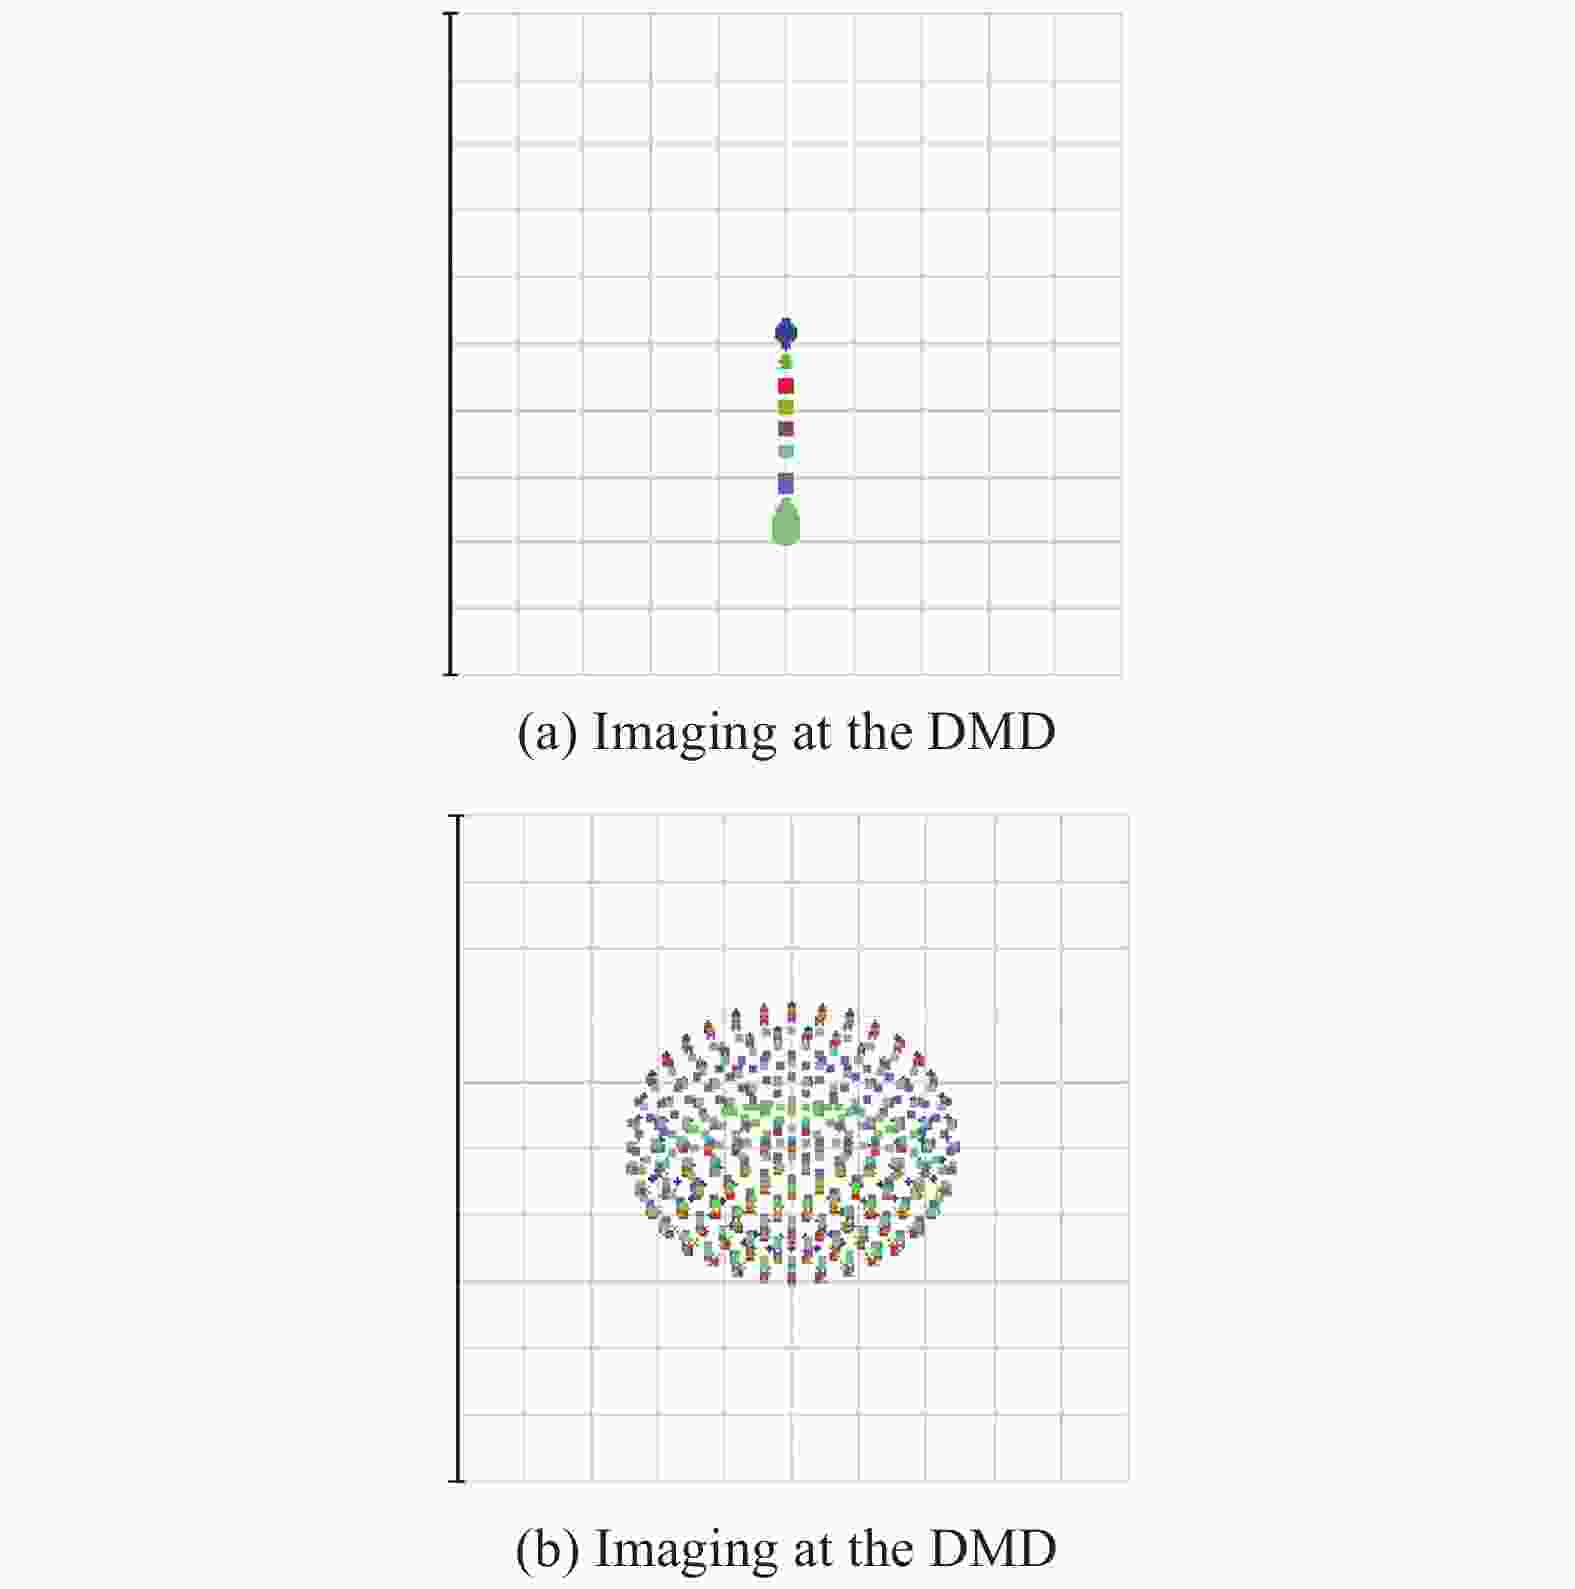
Figure 7. Spot diagram of the system simulation
In order to obtain the actual resolution of the simulation system, the wavelengths on the imaging at the DMD observed in the simulation are simulated according to (a) 1200 nm, 1210 nm, 1220 nm (b) 1300 nm, 1310 nm, 1320 nm (c) 1400 nm, 1410 nm, and 1420 nm, respectively. The images of the point map are shown in Fig.8.
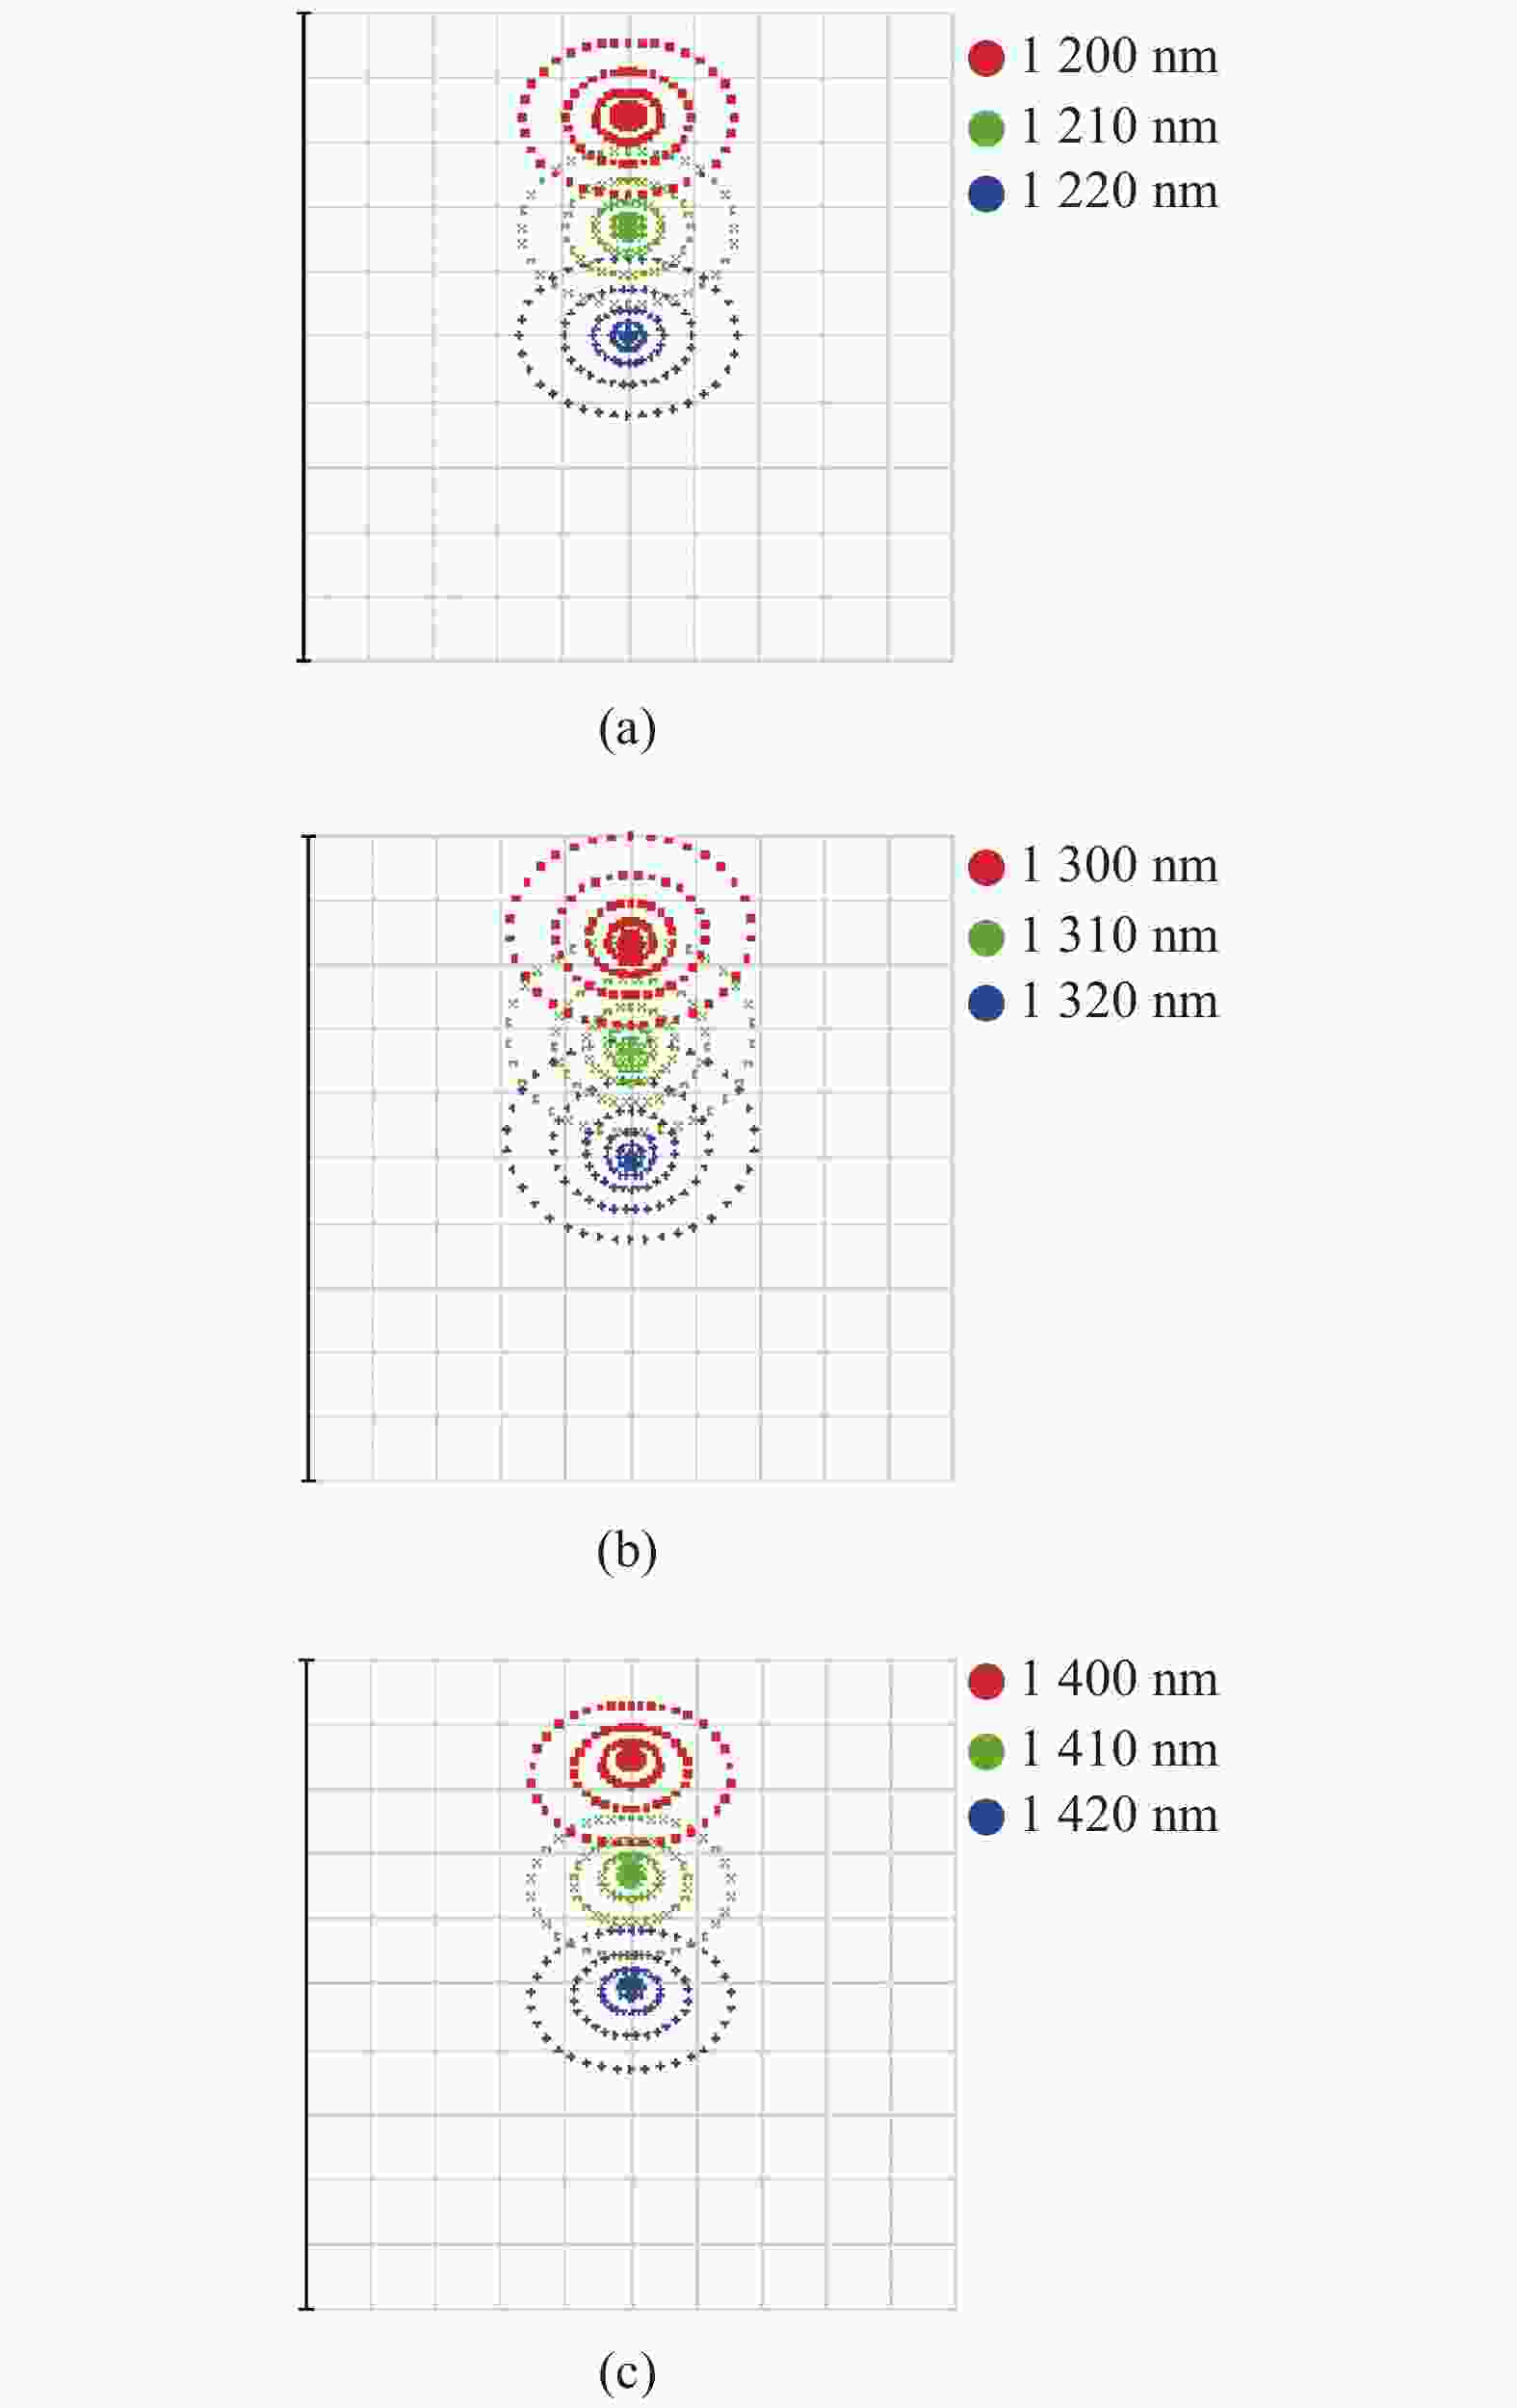
Figure 8. Spot diagram at different wavelengths during DMD imaging
According to the Rayleigh criterion, it can be obtained that any two spectral wavelengths separated by 10 nm on the DMD can be distinguished. It is better than the design target value and fully meets the actual resolution application requirements of the system.
-
The theoretical design method of the spectroscopic imaging system based on the DMD small NIR spectrometer is studied. A mathematical model for theoretical design is established. Theoretical parameters such as the resolution of the spectrometer and system aberrations are analyzed theoretically. The optical path system is calculated and designed using a lens collimation imaging scheme for the spectroscopic imaging system. The optical simulation is carried out using optical simulation software. Combining the geometric aberration theory, the double-gluing anti-aberration lens is designed to optimize the design of a small DMD near-infrared spectrometer. Reducing the aberration effect of the entire system eventually reaches the design's simulation requirements. The results show that the whole size of the spectrometer is less than 150 mm×150 mm×150 mm, and the resolution is better than 10 nm in the range of 1000-1700 nm in the working band, which meets the design requirements.
Principle and optimum analysis of small near-infrared spectrometers based on digital micromirror device
doi: 10.3788/IRLA20200427
- Received Date: 2020-12-05
- Rev Recd Date: 2021-01-07
- Available Online: 2021-02-07
- Publish Date: 2021-02-07
Abstract: The DMD small near-infrared spectroscopy instrument is widely used in chemical composition analysis and quality inspection for its advantages of fast detection speed, high sensitivity, no damage detection, and miniaturization of portable instruments. However, as the premise of instrument design, optical optimization design of the whole spectral range is the hard work of the system. In this paper, the theoretical design method of the spectroscopic imaging system based on the small near-infrared spectrometer of DMD was studied. The method was designed by using the double-dispensing anti-aberration lens and combining the geometric aberration theory to optimize the design of a small DMD near-infrared spectrometer to reduce the aberration of the entire system. Then, the optical simulation software was used to align the direct imaging system for optical simulation. And ultimately achieve the design simulation requirements. Simulation results indicate that the whole size of the spectrometer is less than 150 mm×150 mm×150 mm, and the resolution is better than 15 nm in the range of 1000-1700 nm in the working band. Therefore, the proposed method can meet the design requirements and has broad application prospects in practical applications.


 DownLoad: