


-
在遥感相机中,滤光片提供光谱带通的功能,使相机能够对不同带宽的谱段进行成像[1],实现色彩融合、资源勘查等诸多应用[2]。一般滤光片为平板玻璃,通过表面镀上特殊的膜层来实现光谱带通的功能。对于平板玻璃,使用平面波透射波前指标的测量,能够较全面的反应光线通过滤光片后产生的波前畸变,以用来评价对成像系统的影响[3-6]。波前检测一般使用激光干涉仪,主流干涉仪激光波长为632.8 nm、3.39 和10.6 μm等,在大多数情况下,这三种波长的光并没有在滤光片的带通范围内,因此镀膜后滤光片的透射波前将无法直接测量。
到目前为止,并没有有效的测量技术用于解决该项难题。为此提出了一种仿真间接计算的方法,该方法使用镀膜前的通光面面形、透射波前和镀膜后的通光面面形等数据,通过透射波前仿真算法,推导出镀膜后的透射波前数据。并且经过试验验证,可见光谱段的测量精度优于0.004λ,中波红外谱段的测量精度优于0.002λ。
-
为推导滤光片镀膜后平面波透射波前的计算公式,将这个过程分解为三部分:未镀膜时单光线光程计算公式推导、镀膜后单光线光程计算公式推导、镀膜后透射波前计算矩阵。
首先介绍未镀膜时单光线光程计算公式推导。如图1所示,平面波中的其中一根光线(红色)从参考平面起始,从未镀膜滤光片的前表面入射,从后表面出射,到达测量平面。期间光线经过了3种物质空间,分别是空气层-玻璃-空气层。光线在测量平面上的相位φ,等于光线在参考平面上的相位加上光线传播过程中产生的光程引起的相位变化量。入射光为标准平面波,参考平面上光线的相位都相等,对最终透射波前的影响,表现为常数量,可设为0。因此,测量平面上的光线相位仅为光线传播过程中引入的相位变化。

Figure 1. Optical path length calculation of filter without coating
公式(1)[7]为光线光程的计算公式,OPL为光程,PL为光线通过的物理长度,n为光线所在空间的折射率。
图1中d0分别为参考平面到滤光片前表面的距离和后表面到测量平面的距离。d为滤光片玻璃的名义厚度。ΔdF和ΔdR分别是前后表面在光线传播方向上的面形值。
计算前,约定各段距离值沿光线传播方向为正。空气折射率为1,设玻璃折射率为nm。
公式(2)为光线从参考平面到达测量平面的光程。
然后推导滤光片双面镀膜后的光线光程计算公式。如图2所示,Tc为双面膜层的平均厚度,ΔdF'和ΔdR'分别为镀膜后滤光片玻璃基体双面在光线传播方向上的面形。ΔtF'和ΔtR'分别为双面膜层在光线传播方向上的面形。
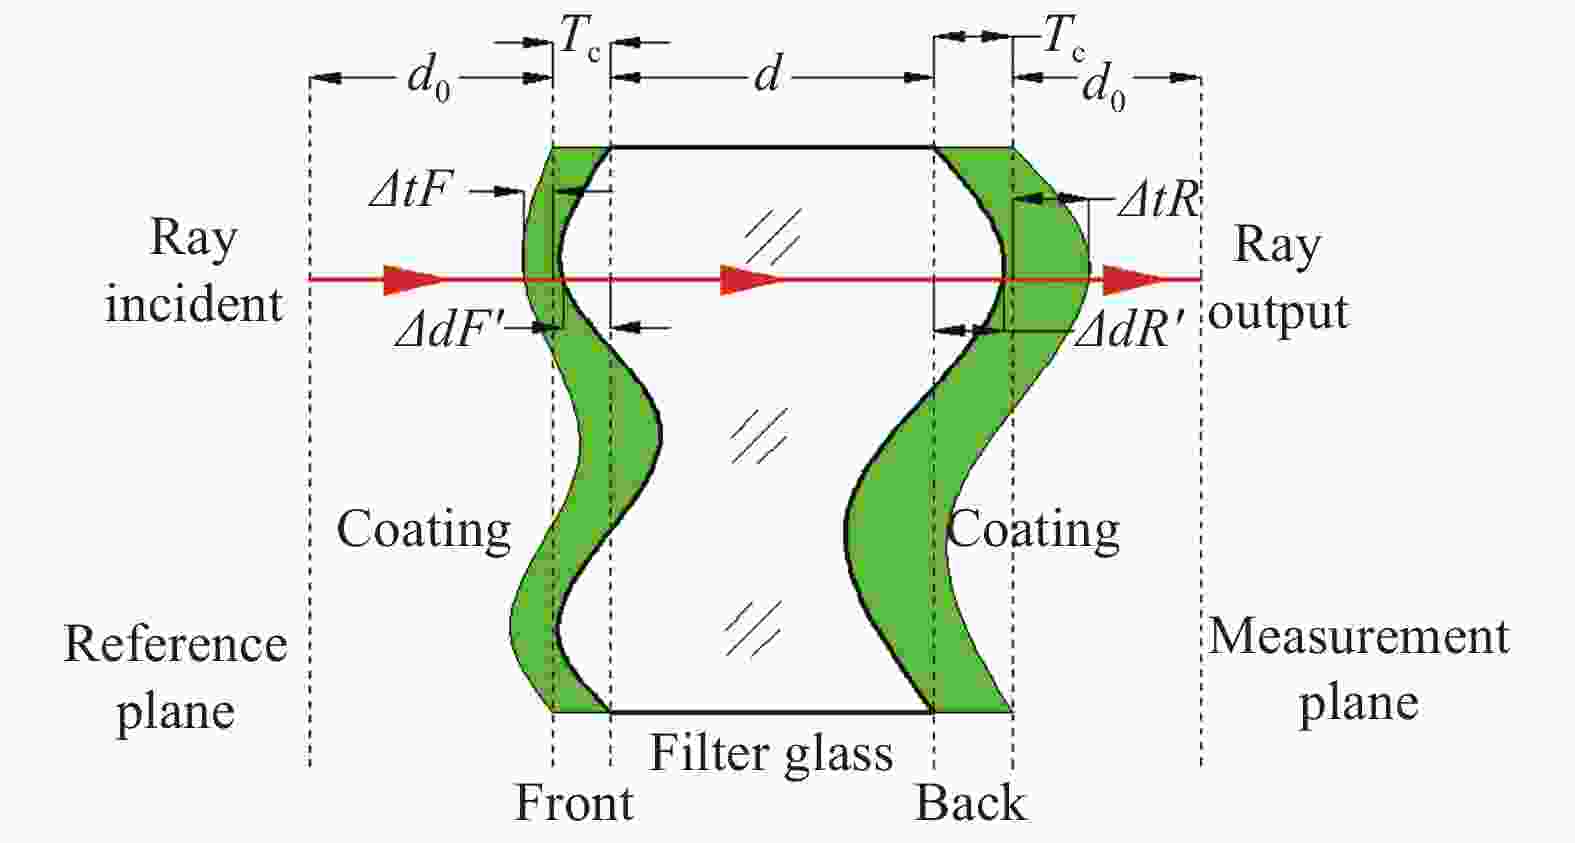
Figure 2. Optical path length calculation of filter with coating
滤光片的膜层一般包含许多单一膜层,设一共有k层,第i层单一膜层的厚度为ti,折射率为ni。
公式(3)为膜层对于光程总的贡献量。
公式(4)为对公式(3)进行的转化。其中,
$\displaystyle\sum\limits_{i = 1}^k {{t_i}} $ 为膜层在光线处的厚度。式中:
${n_{ca}}$ 为膜系的平均折射率[8]。公式(6)为镀膜后光线从参考平面到达测量平面的光程。
将镀膜后的光程公式进行重新组合得到公式(7),其中,
$(2{T_C}{n_{ca}} + 2d_0) + d{n_m}$ 为常数项,对透射波前没有影响;$\varDelta tR - \varDelta tF$ 为镀膜后膜层外表面前后表面的面形差值;$\varDelta dR' - \varDelta dF'$ 为镀膜后滤光片玻璃基体前后表面面形的差值。由于滤光片镀膜前后为整体变形,可得公式(9):
结合公式(2)、(7)、(8)得到公式(9),式中:
$2{T_c}{n_{ca}}$ 为平均厚度和膜系平均折射率的乘积,常数项;$O{P_{DMQ}}$ 为镀膜前的光线传播的光程或者是透射波前;$({n_{ca}} - 1)(\varDelta tR - \varDelta tF)$ 为镀膜后的膜层外表面前后面的面形之差乘以系数${n_{ca}} - 1$ ;最后一项为$(2{n_m} - {n_{ca}} - 1) $ $ (\varDelta dR - \varDelta dF)$ ,为镀膜前的滤光片玻璃基体前后面面形差值乘以系数$2{n_m} - {n_{ca}} - 1$ 。以上为单根光线计算透射波前的算法,扩展至具有一定大小的平面波范围内,在平面波横截面上使用矩阵分割进行离散化,设将横截面分成m行n列的矩阵,共有m×n个小面元,对于单个面元范围内,假设透射波前相等。
公式(10)为镀膜后透射波前均方根的计算公式。
-
可见光谱段实验数据如表1所示,该实验使用的干涉仪波长为632.8 nm,并设计膜层使其能透波长为632.8 nm的光线,如此能够直接进行镀膜后透射波前的测量,与仿真透射波前进行对比。对四片滤光片进行了镀膜前后面形的测量。在632.8 nm波长下,膜系平均折射率为
${n_{ca}}$ =1.825443,玻璃基体厚度d=5 mm,折射率nm=1.457016。Glass base Thickness/mm Refractive index Coating characteristics Average value of refractive index of coating Quantity Fused silica 5 1.457 046 632.8 nm pass 1.825 443 4 Table 1. Visible spectrum experiments data
测量得到四片可见滤光片镀膜前、后两面面形、镀膜前的透射波前、镀膜后面形、镀膜后实测透射波前和仿真透射波前如表2所示。
Before coating After coating Surface sag front Surface sag back Transmitted wavefront Surface sag front Surface sag back Transmitted wavefront simulated Transmitted wavefront measured 


0.086 0.051 0.012 0.607 0.621 0.026 0.028 


0.030 0.035 0.010 0.290 0.298 0.017 0.015 


0.041 0.082 0.014 2.447 2.419 0.043 0.040 


0.055 0.084 0.019 0.076 0.072 0.022 0.018 Table 2. Surface sag and transmitted wavefront of the filter before and after coating in visible spectrum(RMS@λ=632.8 nm)
-
红外谱段实验使用3.39 μm的激光干涉仪,并设计膜层使其能够透射该波长光线,实验条件如表3所示。测量得到两片红外滤光片镀膜前、后两面面形、镀膜前的透射波前、镀膜后面形、镀膜后实测透射波前和仿真透射波前如表4所示。
Glass base Thickness/mm Refractive index Coating characteristics Average value of refractive index of coating Quantity Germanium 3 4.045 1 3.39 μm pass 3.351 286 2 Table 3. Infrared spectrum experiments data
Before coating After coating Surface sag front Surface sag back Surface sag front Surface sag back Surface sag front Surface sag back Surface sag front 


0.033 0.015 0.008 0.656 0.656 0.012 0.011 


0.021 0.011 0.011 0.021 0.016 0.013 0.011 Table 4. Surface sag and transmitted wavefront of the filter before and after coating in infrared spectrum(RMS@λ=3.39 μm)
-
根据以上4片可见滤光片和2片红外滤光片的测量和仿真计算结果,仿真透射波前和实测透射波前最大偏差分别为0.004λ和0.002λ,且波前的高低点分布能够基本吻合。但在局部区域上,有较明显的区别。总的来说可见滤光片的精度要比红外的稍差一些,主要是因为可见滤光片的双面面形测试精度要求更高。在此分析可见滤光片的误差分布情况。根据公式(9),主要原因有:
(1)镀膜后的前、后表面面形测试误差
平面面形的测试误差的RMS值一般在0.002λ,根据公式(9),
$\varDelta tR - \varDelta tF$ 的误差为0.004λ。${n_{ca}}$ =1.825443,得到$({n_{ca}} - 1)(\varDelta tR - \varDelta tF)$ 项引入的测试误差${\varepsilon _1}$ 为:(2)镀膜前的前、后表面面形测试误差
同理按照平面面形0.002λ的测试误差,得到公式(9)中
$(2{n_m} - {n_{ca}} - 1)(\varDelta dR - \varDelta dF)$ 项的误差${\varepsilon _2}$ 为:(3)镀膜前滤光片基体的透射波前测试误差
${\varepsilon _3}$ 为:(4)膜系平均折射率
${n_{ca}}$ 和滤光片基体折射率${n_m}$ 一般折射率的测试误差为0.0001以内,公式(9)中,折射率共出现4次,可得折射率对透射波前的误差贡献量
${\varepsilon _4}$ :可知,折射率误差对透射波前影响相对较小。综上所述,得到的镀膜后透射波前的误差
$\varepsilon $ 为:以上误差分析的结果基本能够与实验误差相吻合。
当然,除了这些测试误差,在算法实现过程中,也会引入小量的计算误差。一是算法实现中的波前矩阵对准误差。根据2中的算法分析,需要将镀膜前前后表面的面形矩阵、透射波前矩阵、镀膜后面形矩阵进行点点对应,在实际计算中,由于各个面形标记点匹配都会有一定的误差,因此会引起微量的波前数据错位,从而引入计算误差。但是在大多数情况下,面形或者透射波前一般都为低阶像差,空间频率较低,对准误差比较小。二是对波前矩阵数据点间的插值误差,文中算法在进行波前矩阵对准中采用了物理距离对准,所有数据点都与基准标记点进行了坐标计算,根据像元对应的物理尺寸,对波前矩阵中的每个数据点都实现了物理坐标转换。但是在计算镀膜后透射波前的过程中,镀膜前后各波前矩阵数据点的物理坐标有可能并不相同,因此需要根据物理坐标插值,来实现数据点的真正对准。以上个算法实现误差通过算法实验,对镀膜后的透射波前的影响在0.0001λ以内,在更高精度要求的测试中应该予以考虑。
由上述可知,仿真透射波前算法中由于使用了多个面形测试、材料折射率等数据,任何一个数据的测试偏差就会影响仿真精度。要得到更高精度的仿真值,提升各参数的测试精度是非常重要的。滤光片镀膜后的透射波前,在当前没有有效的测试技术进行精确的测量,该仿真技术的优势是解除了单波长干涉测量对滤光片透射波前测量的限制,通过面形和镀膜前透射波前的测量实现了任意波长带通滤光片在镀膜后透射波前的间接计算,且保证了透射波前的测试精度。
-
对于多谱段滤光片镀膜后平面波透射波前的评价,给出了一种仿真技术,使用单波长干涉仪,测量镀膜前玻璃前后表面的面形、透射波前、镀膜后前后表面的面形,根据光程计算原理,推导出了测量得到的面形、波前数据与镀膜后透射波前的计算公式。对四片可见滤光片进行了仿真算法的验证,实验表明,镀膜后透射波前的仿真精度优于0.004λ。又使用两片红外滤光片进行仿真算法验证,精度优于0.002λ。后续对精度要求更高的可见滤光片的仿真误差进行了详细分析,面形的测试误差是主要的误差源,因此对面形和波前测试精度的要求非常高,通常要求在0.002以内。总之,文中方法可应用于可见到红外的超宽带宽的滤光片平面波透射波前测试中。作为该算法的扩展应用,滤光片基体的折射率均匀性的测量也成为可能,笔者将继续研究。
Plane wave transmitted wavefront simulation and measurement of filter with multi-spectrum
doi: 10.3788/IRLA20200528
- Received Date: 2020-11-28
- Rev Recd Date: 2021-08-02
- Publish Date: 2021-09-23
-
Key words:
- transmitted wavefront /
- filter testing /
- plane wave /
- optical testing
Abstract: Optical filter is widely used in multi-spectrum imaging of space remote sensor. Usually the base of the filter is optical glass. And optical coating on the glass is used to filter the specific spectrum. Plane wave transmitted wavefront testing is the main technique used to evaluate the wavefront distortion of the filter. The wavelength of the light interferometer uses is fixed. It can not cover the filter’s spectrum. And it is impossible to test every spectrum transmitted wavefront of the filter. In order to solve this problem, one solution was provided in this article. The interferometer with one fixed light wavelength was used. The front and back surface sag data, transmitted wavefront data of the filter before coating, and the front and back surface sag data after coating were used in a special algorithm together, the plane wave transmitted wavefront of the filter after coating can be obtained. The theoretical derivation of the algorithm was fully discussed in this article. And the experiments show the error of the transmitted wavefront RMS can be less than 0.004λ (λ=632.8 nm). The technique can be applied on the testing of infrared filter, experiments show the error is about 0.002λ (λ=3.39 μm), The accuracy requirement is satisfied and the cost is reduced.


 DownLoad: