-
甲烷的全球增温潜势(Global Warming Potential, GWP)约为二氧化碳(CO2)的21倍,对于CH4的排放检测是控制和减排温室气体的首要问题[1]。此外,由于CH4泄露导致的爆炸事件屡有发生,给社会经济造成巨大损失的同时也威胁着人身安全[2]。因此,对于CH4的高精度检测具有重要的科学价值和社会意义。
近年来,可调谐半导体激光吸收光谱(TDLAS)作为一种实时、高效的在线检测技术得到了广泛的应用,TDLAS通过可调谐半导体激光器扫描待测气体的单根吸收谱线,相比于电化学法、半导体法、催化燃烧法等检测方法,TDLAS检测响应速度快、灵敏度高,具有非接触性检测且选择性强的优点[3-6]。在TDLAS气体浓度检测系统中,传统的检测光源通常采用功耗较大的DFB激光器,其工作电流通常在100 mA左右[7]。VCSEL激光器工作电流仅为几毫安,使用VCSEL型半导体激光器作为检测光源具有更低的功率,使得检测设备符合本安特性,因此VCSEL型TDLAS检测设备在燃爆安全、井下作业中有着重要的应用前景[8]。与直接吸收光谱(DAS)技术相比,波长调制光谱(WMS)技术能够消除激光器本身以及外界环境扰动带来的低频噪声干扰,显著提高了检测系统的精度和灵敏度,因此得到了广泛的应用[9-12]。此外,文中采用了单波长双光路差分检测结构,可消除由光源波动引起的背景噪声进而提高检测精度。综合采用上述两种方法,可使TDLAS气体检测系统的整体检测精度得到较大提升,在不增加系统复杂度的情况下可以更好地满足实际应用当中对于CH4气体的高精度检测需求。
文中基于TDLAS和WMS,采用VCSEL激光器实现了CH4的浓度检测,激光器发射的激光波长为1 654 nm。自主开发了激光器驱动电路,自行开发了基于ARM的高精度激光器温度控制电路,控温精度为0.01 ℃。多反射气室的吸收程长为2 m。为了消除光源功率波动、电路温漂等影响,设计了单波长双光路差分检测结构,系统通过锁相放大器提取二次谐波(2f)信号的峰峰值,检测数据经算法处理后得出CH4的浓度值。进行了气体检测实验,研究了系统的响应性能,系统测量不同浓度的CH4具有良好的线性度。此外,对系统的检测精度和稳定度进行了分析,系统在50~500 ppmv范围内的精度优于10%,检测数据波动小于±2.4%。系统的检测下限为10 ppmv。
-
基于比尔-朗伯定律(Beer-Lambert),当一束光透过CH4分子时,CH4分子对特定波长的光具有吸收作用。由于CH4分子的选择性吸收会造成光能量的衰减,光衰减的能量与CH4的分子数成正比[13],吸收后的光强为:
式中:I0为入射光强;α(v)为吸收线型函数;C为待测气体的浓度;L为吸收光程。在一个标准大气压下,α(v)可采用Lorentz线型:
式中:α0为吸收峰中心的吸收系数;vcm为吸收峰的中心频率;Δv为吸收峰半宽度。
-
为了提高CH4检测系统的检测精度和灵敏度,采用WMS技术消除激光器本身以及外界环境扰动带来的低频噪声干扰,对激光器的注入电流进行调制[14],激光器的输出频率和输出光强为:
式中:
${v_0}$ 为激光器输出的中心频率;${v_m}$ 为调制信号的振幅;$\eta $ 为强度调制指数;$ \omega $ 为调制频率的2π倍。联立公式(4)和公式(1)可以得到经过气体吸收后的激光光强表达式:
由于实际的气体吸收和强度调制非常小,即
$\alpha (v)<<1$ 且$\eta <<1$ 。根据Lorentz线型表示式公式(2),调整激光器的中心频率${v_0}$ ,使得其发光的中心频率和气体的吸收峰重合,即${v_0}$ =${v_{cm}}$ ,则泰勒级数展开后,光电探测器的检测信号${S_1}(t)$ 和参考信号${S_2}(t)$ 可以表示为:式中:s为光电探测器的衰减系数,对公式(6)和公式(7)的差值
$S(t) = {S_2}(t) - {S_1}(t)$ 进行傅里叶级数展开,得到:其二次谐波系数为:
由公式(10)可知,在
$m,L,{I_0}$ 一定的情况下,气体的浓度C和2f信号S2f是成正比的。实验中,提取2f信号分析,即可计算出待测CH4的浓度,C和S2f之间的关系可以通过校准实验获取。 -
在对CH4进行激光浓度检测时,选择合适的吸收波长,可以有效地减小混入气体对系统检测精度的干扰。
根据HITRAN 2016数据库,CH4分子在1 492.5 ~ 1 694.9 nm范围内的吸收谱线如图1所示。可以明显看出在1 653.7 nm (6 046.955 cm−1)处,CH4分子具有吸收线强度最强的谱线,数量级为10−21。水(H2O)、二氧化碳(CO2)等常见干扰气体分子在此范围内的吸收线强度的数量级均小于10−25,远远小于CH4分子的吸收强度。综合考虑上述因素,为了得到精确的检测结果,尽可能避免其它气体分子的干扰,同时考虑到VCSEL激光器的制造工艺和成本,文中选用CH4分子1 653.7 nm (6 046.955 cm−1)处的吸收线实现浓度检测,吸收线强度为1.510×10⁻²¹。
-
CH4检测系统整体结构如图2所示,采用德国VERTILAS公司的VCSEL激光器作为激光光源,型号为VL-1654-1。针对CH4检测波长,选用日本滨松公司的G12180-003A型光电二极管,其波长响应范围为0.9 ~ 1.7 μm,对1654 nm的红外光有较强响应,且对可见光无响应,响应截止频率高达600 MHz,可以实现对高频调制激光的响应,符该系统的应用需求。
激光器发射的光由光纤耦合进入气室,多反射气室的物理尺寸为420 mm×100 mm×137 mm,容积为1 230 mL前后镜面间距约32 cm,光在气室内经过6次反射,有效光程为2 m。激光穿过气室被CH4吸收发生衰减后,由光电探测器预处理电路将光电流信号转化为电压信号。为了消除光源功率波动、电路温漂等影响,设计了单波长双光路差分检测结构,将实际的检测信号和参考信号做差分处理,经由放大滤波电路提取出实际的衰减后的激光光强信号。系统通过锁相放大器提取信号中2f信号的峰峰值,使用AD模数转换功能对锁相放大器输出2f信号的峰峰值进行实时连续采集,完成一个扫描周期后,将计算求得单个检测周期的CH4检测浓度。重复多个扫描周期,记录CH4浓度检测结果并计算平均值,完成一次CH4浓度检测。
-
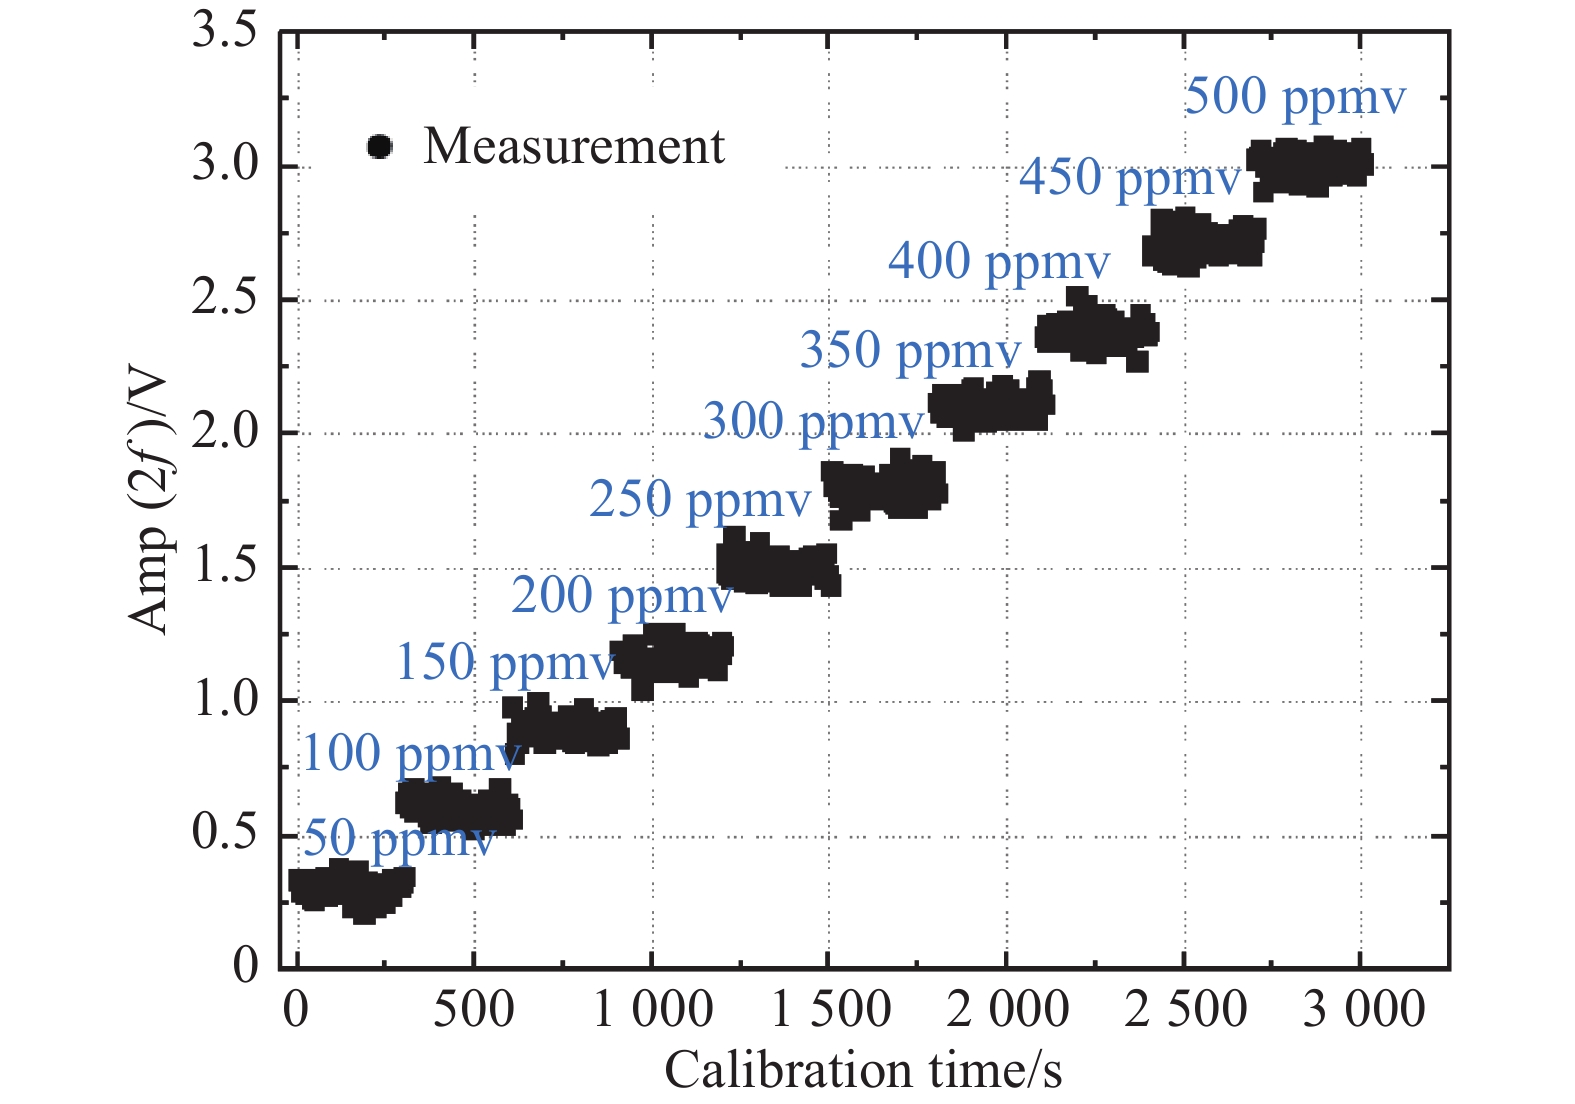
在20 ℃室温下,以N2为背景气体,配置50、100、150、200、250、300、350、400、450、500 ppmv的10组CH4标准气。为了测量2f信号的峰峰值和CH4浓度之间的关系,将已配置好的10组不同标准浓度的CH4以5 min时长为间隔,依次通入气室。系统每 5 s记录一次检测数据,每一种浓度的CH4进行60次检测。
如图3所示,实验中得到的2f信号的峰峰值记为amp(2f),数据表明CH4对激光能量的吸收与其浓度呈线性关系,线性拟合得到公式(11)(式中CCH4为被测CH4浓度):
继而推导出公式(12):
根据公式(12)可以将检测到的2f信号的峰峰值换算为相应的CH4浓度,其线性相关度为0.999 8,拟合曲线如图4所示。
-
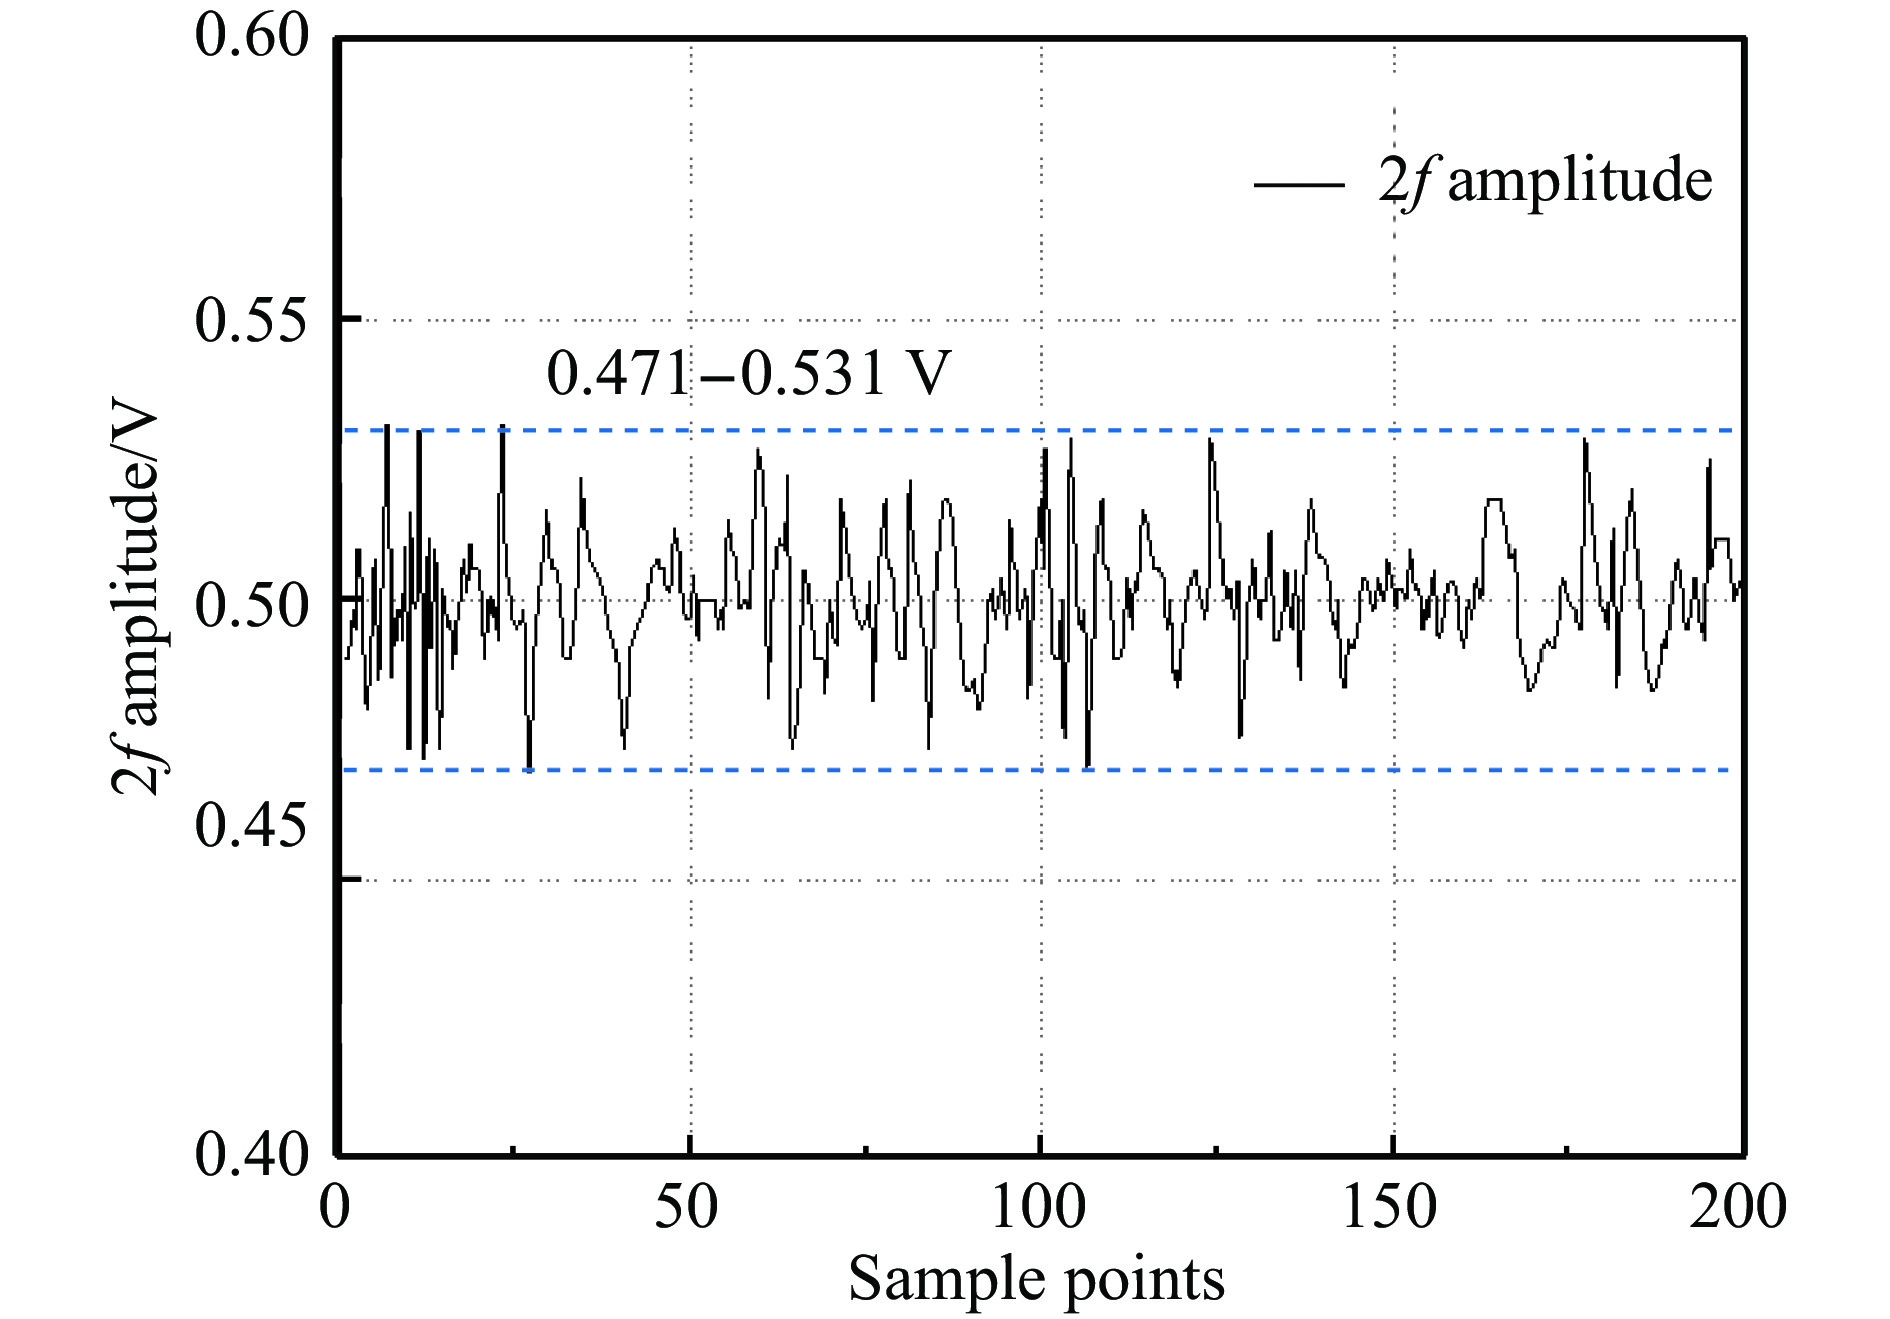
为了测量CH4检测仪的检测下限,配置250 ppmv的CH4通入检测气室,通过双光路差分检测结构消除光源功率波动、电路温漂等影响,锁相放大器探测到的2f信号的峰峰值如图5所示;CH4浓度为0 ppmv时,其2f信号噪声如图6
所示。数据表明,在CH4浓度为250 ppmv时,2f信号的峰峰值(SA)为1.501 V, 0 ppmv的噪声信号波动幅值(NA)为0.06 V,系统的检测下限为:250 ppmv×NA/SA≈10 ppmv。 -
为了计算系统的检测误差,在与标定实验相同的条件下,以5 min时长为间隔,依次对50、100、150、200、250、300、350、400、450、500 ppmv这10种浓度的CH4进行检测,根据拟合公式计算相应的浓度,表1给出了不同浓度的CH4检测数据。数据分析表明,CH4检测仪最大绝对误差为6 ppmv,最大相对误差在±10%范围内,系统的检测精度优于10%。
No. CCH4/ppmv 50 100 150 200 250 300 350 400 450 500 1 52 102 150 201 251 300 351 398 454 496 2 51 103 151 201 253 301 351 400 452 501 3 48 98 152 202 249 300 354 401 450 503 4 50 99 148 204 255 304 352 401 451 504 5 49 97 149 199 254 300 351 400 451 505 6 47 100 144 197 251 301 351 399 453 500 7 50 101 154 199 251 299 352 398 451 499 8 53 101 152 201 251 297 349 398 452 504 9 51 102 151 201 252 301 348 395 448 505 10 55 98 151 200 247 301 351 401 449 504 Maximum absolute error 5 ppmv 3 ppmv 6 ppmv 4 ppmv 5 ppmv 4 ppmv 4 ppmv 5 ppmv 4 ppmv 5 ppmv Maximum relative error 10.00% 3.00% 4.00% 2.00% 2.00% 1.33% 1.14% 1.25% 0.89% 1.00% Table 1. Test results with N2 as background
-
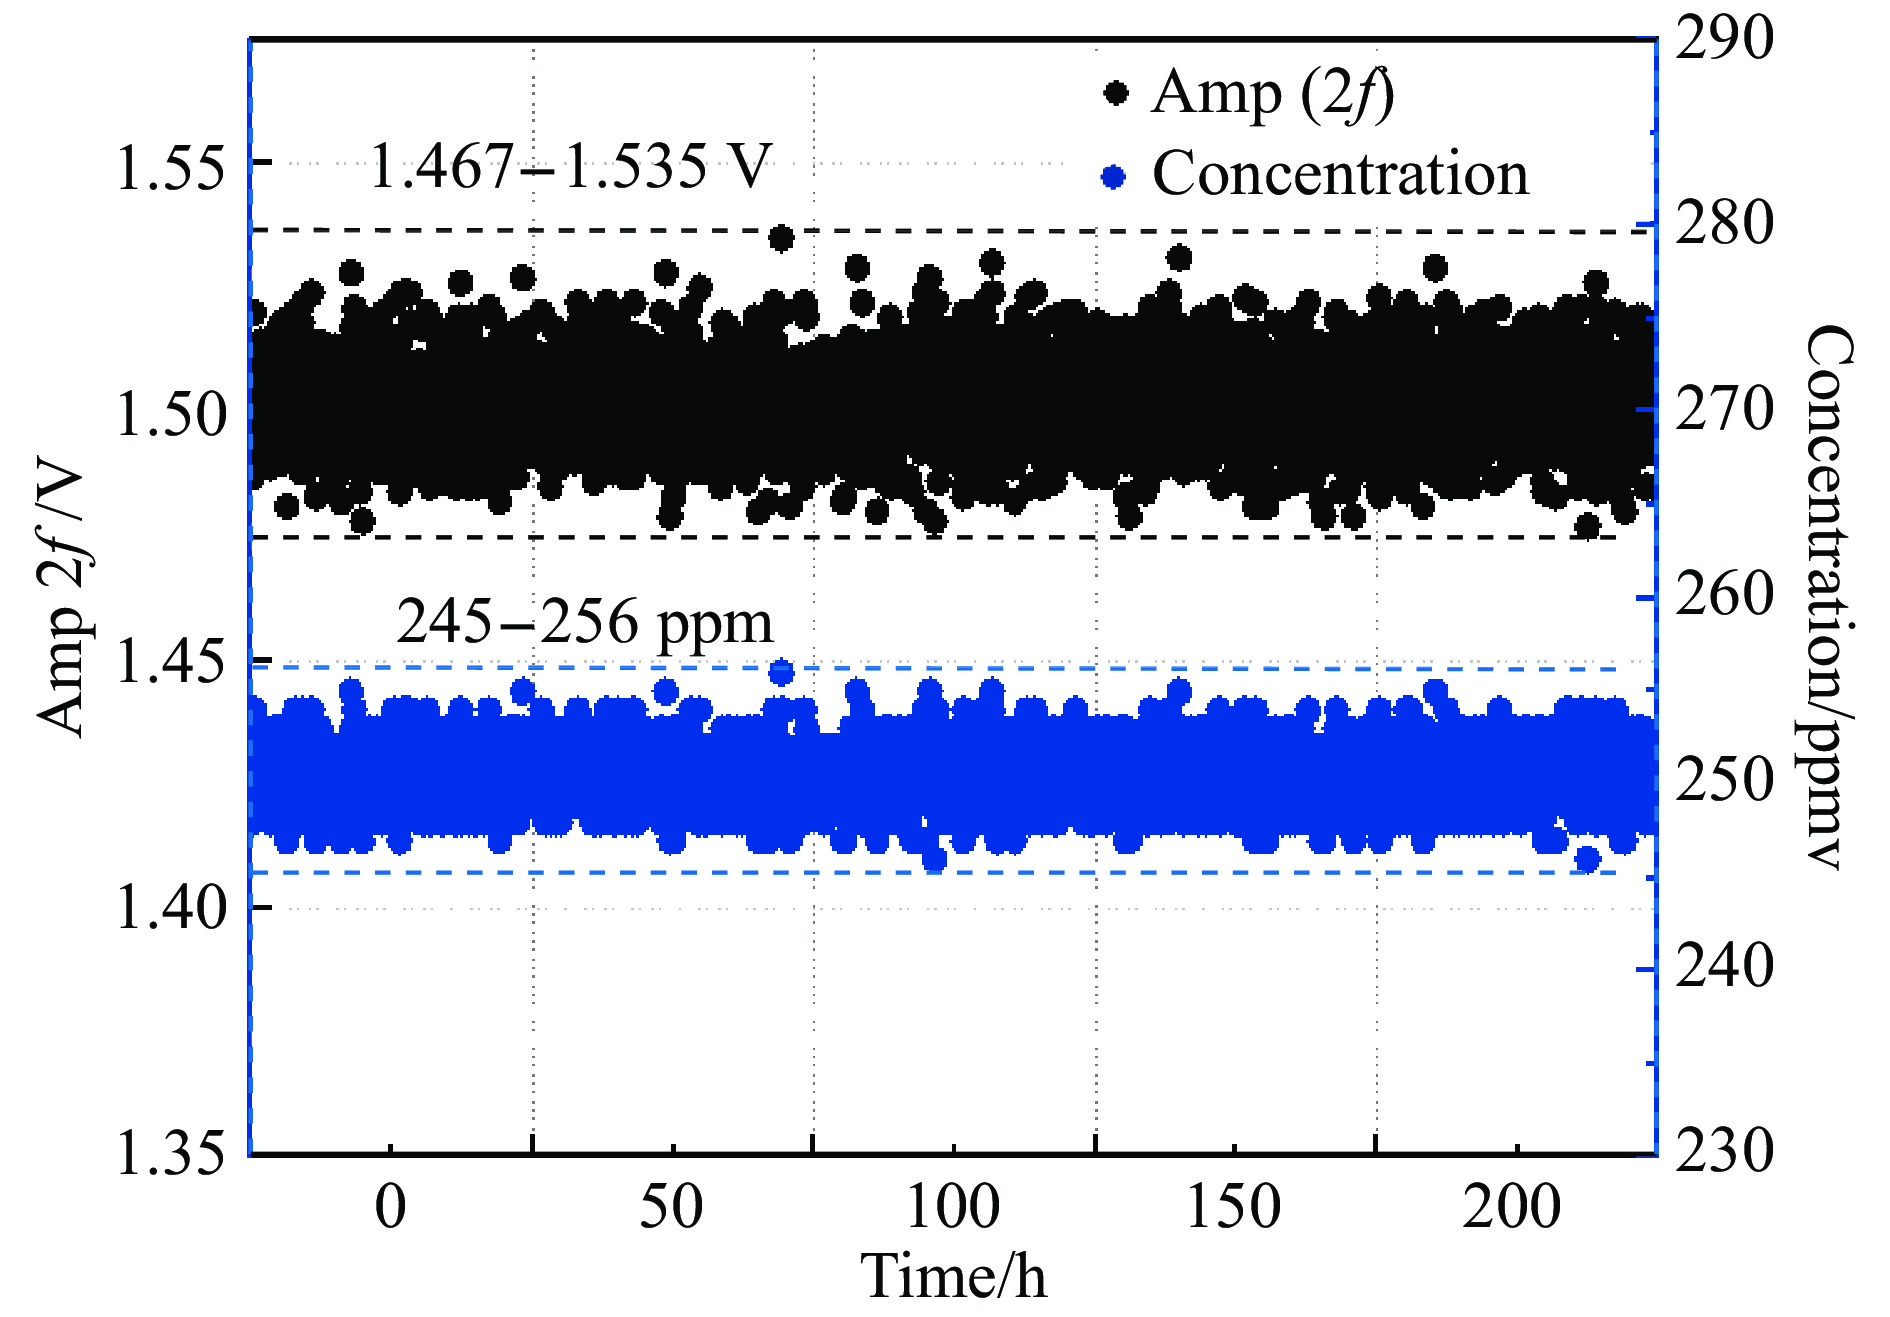
为了测定检测系统稳定性,可以通过长时间向气室内输入一定标准浓度的CH4气体,观测检测系统输出值与时间的关系来衡量。将浓度为250 ppmv的CH4通入检测气室内,每1 s记录一次检测仪输出的浓度数值,在恒温条件下进行时长10 h的稳定度观测实验,分析检测仪输出的气体浓度数值与时间的关系,如图7所示。在持续10 h的长时间检测时,2f信号的峰峰值为1.467 ~ 1.535 V范围内,检测仪输出的CH4浓度值均处在245 ~ 256 ppmv之间,波动小于±2.4%,检测数据的平均值为250.5 ppmv。
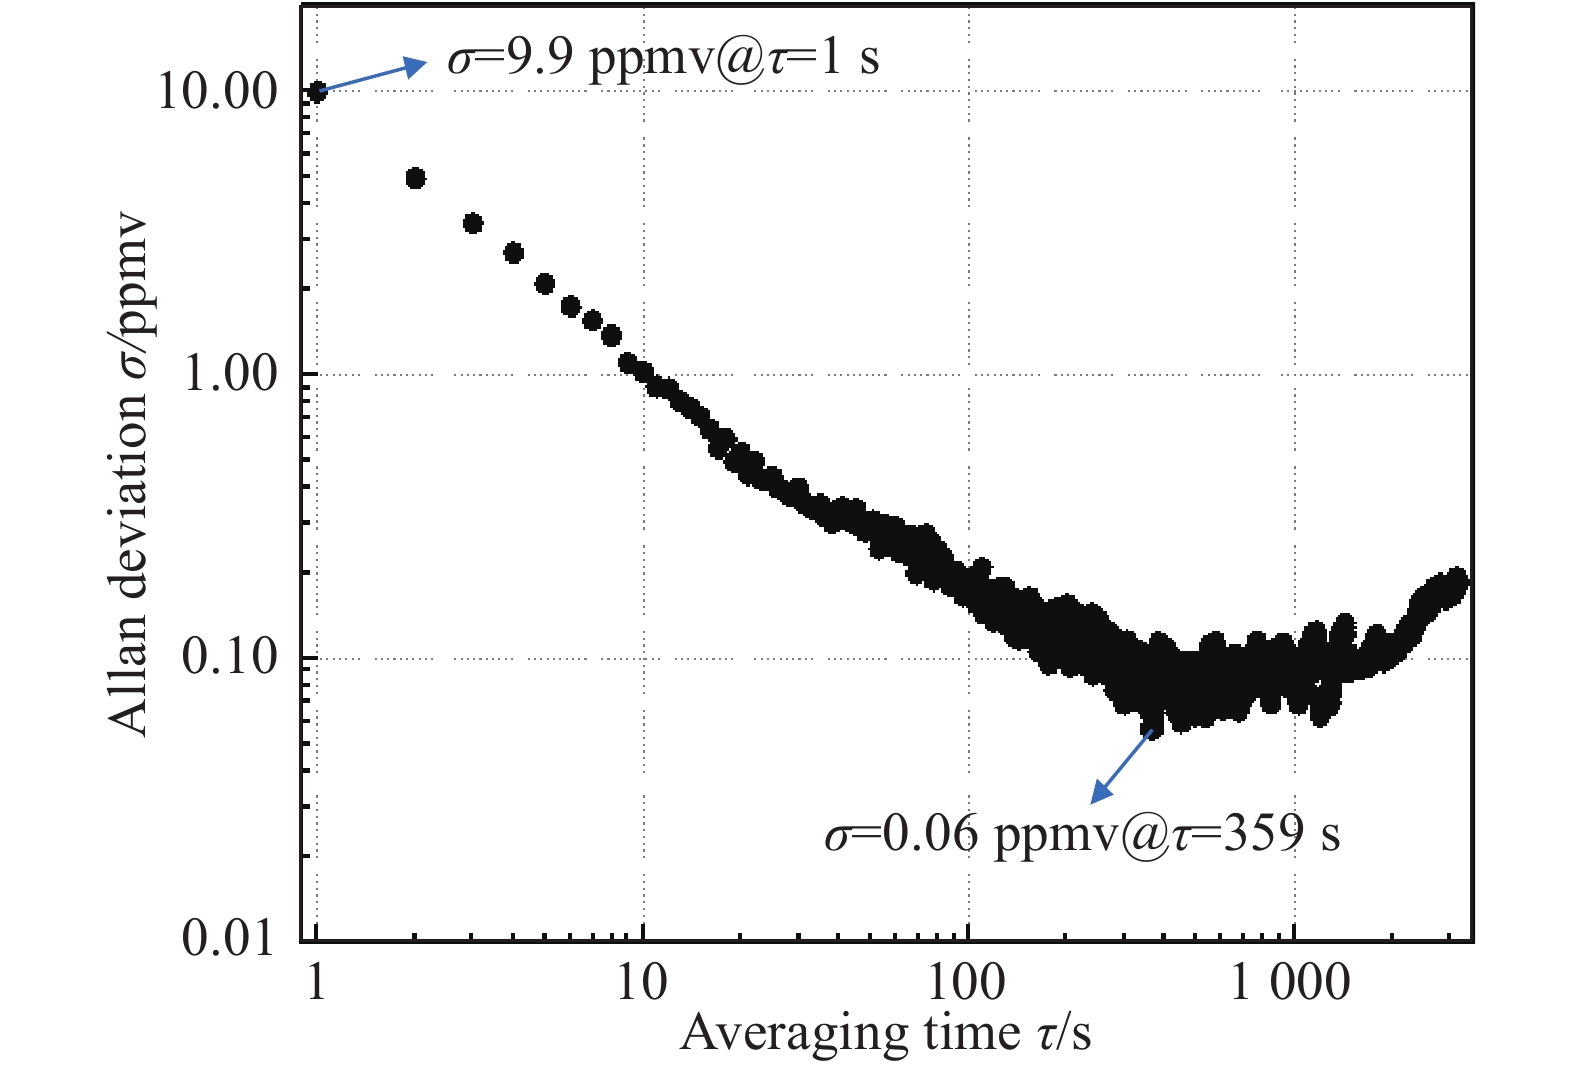
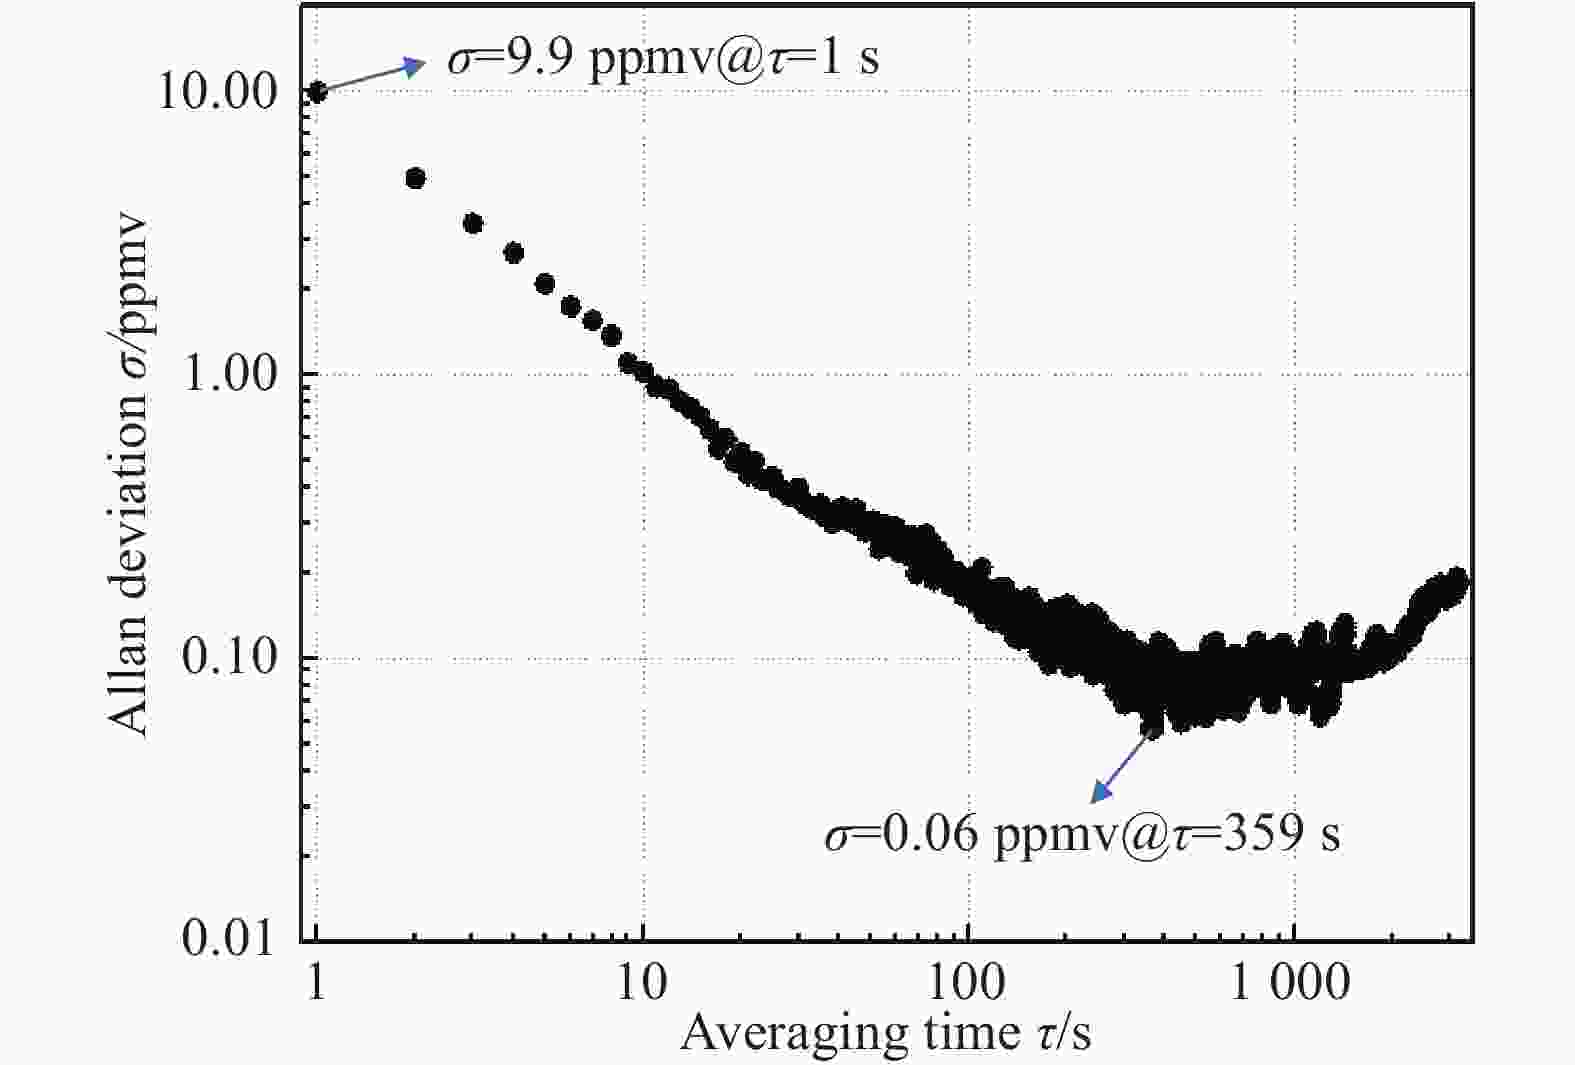
引入Allan偏差对检测系统的长期特性进行分析[15],由图8所示的Allan偏差结果可知,积分时间为1 s时的Allan偏差为9.9 ppmv,如果积分时间持续增加,则Allan偏差大大降低,积分时间增加到359 s时Allan,偏差可降至0.06 ppmv,表明了系统具有良好的稳定度。
-
文中基于TDLAS技术,选择CH4分子1 653.7 nm附近的吸收峰作为吸收谱线,研制了一套采用VCSEL光源的甲烷检测系统。结合VCSEL激光光源调制特性,自主开发了驱动电路和温度控制电路,锁相放大器被用于提取2f信号。采用单波长双光路差分检测结构,用以消除检测系统中激光光源波动带来的干扰。使用该检测系统做了大量的实验,研究了其各项性能。实验结果表明系统具有良好的性能指标,WMS技术的应用大幅度提高了该系统的精确性和灵敏度,检测系统在50 ~ 500 ppmv之间检测精度优于10%,检测下限为10 ppmv。采用 Allan偏差分析实验数据,初始积分时间为1 s时的Allan偏差为9.9 ppmv;积分时间增加至359 s时,Allan偏差为0.06 ppmv,表征了系统良好的稳定度。此外,使用VCSEL激光器作为检测光源,其功耗仅为传统DFB激光器的十分之一,符合本安特性,在TDLAS检测领域中具有独特的优势及应用价值。
Research of TDLAS methane detection system using VCSEL laser as the light source
doi: 10.3788/IRLA202049.0405002
- Received Date: 2019-12-27
- Rev Recd Date: 2020-01-11
- Publish Date: 2020-04-24
-
Key words:
- VCSEL laser /
- low power /
- TDLAS /
- WMS /
- methane concentration detection
Abstract: Compared with the DFB laser, the TDLAS laser gas detecting system using the VCSEL laser as the detecting light source has the advantage of low power consumption. According to the characteristic of the low power TDLAS gas detection signal, combined with the characteristics of modulation VCSEL laser source, a laser driver, signal acquisition and processing were designed, and a low-power TDLAS methane (CH4) gas detector based on WMS was designed. The absorption peak of CH4 molecule near 1653.7 nm was selected as the absorption line, and the second harmonic (2f) signal was extracted by a lock-in amplifier. The response of different concentrations of CH4 detection was studied experimentally, and the 2f signal's amplitude was recorded and linearly fitted. The results show that the CH4 concentration has a good linear relationship with its 2f signal's amplitude, and the linearity is 0.9998. Accuracy of the detection system is better than 10% in the range of 50 - 500 ppmv, and the detection limit is 10 ppmv. With the long-term detection of 250 ppmv of CH4 for 10 h, the fluctuations are less than ± 2.4%. Allan deviation analysis was introduced. When the initial integration time was 1 s, the Allan deviation was 9.9 ppmv. When the integration time reached 359 s, the Allan deviation was 0.06 ppmv, which indicated the good stability of the system.






 DownLoad:

