


HTML
-
The Upper Stratosphere and Lower Mesosphere (USLM) is an important region in the Earth’s atmosphere. In this region, the amplitudes of atmospheric gravity waves (GW) and solar tides can be increased due to the decrease of air density with altitude[1]. When these waves propagate upwards, their energy and momentum can be deposited into the background and thereby modulate the atmosphere[2]. Long-term observations are important for studying the seasonal and inter-annual variability in the USLM region and for understanding global climate change[3-5]. Rayleigh scattering lidar has been proven an efficient means for making high-resolutionmeasurements of density and temperature in the USLM region[5].
The first Rayleigh lidar observation of neutral density and temperature profiles was made by Hauchecorne and Chanin at the Haute-Provence Observatory[6]. Gardner et al. used a Rayleigh lidar to study the gravity waves characteristics at Urbana, Illinois[7]. Wichwar et al. used 3 years of Rayleigh lidar data at Logan, Utah to study the climatology of mesospheric temperature[8]. Recently, Llamedo et al. used an 11-year lidar temperature dataset at the altitudes of 20-56 km at Rio Gallegos, Argentina to study gravity wave activities and found that GW specific potential energy inside the polar vortex is larger than the outside or the edge of the vortex[5].
In the Antarctica region, Di Donfrancesco et al. used Rayleigh lidar observations to show an interesting temperature behavior and variation at McMurdo station (78° S, 167° E)[9]. Then Pan and Gardner combined Fe/Rayleigh lidar and high-altitude balloonsonde data to characterize the seasonal variations of atmospheric temperature from surface up to 110 km at South Pole[10]. Klekociuk et al. reported the seasonal variations of temperature in the stratosphere and lower mesosphere using the lidar data at Davis station (68.6° S, 78.0° E) near the Antarctica Circle[11]. Then Alexander et al. used Rayleigh lidar at Davis station to study the wintertime gravity wave activities in the USLM region[12]. Recently, Chu’s group used 5 years (from 2011 to 2015) of lidar observation to characterize the GW between 30 km and 50 km at McMurdo station[3-4].
In China, Wu et al. firstly used a dual-beam Rayleigh lidar to obtain the air density and temperature profiles between 30 km and 43 km at Hefei[13]. After the system was upgraded, the lidar could measure the vertical distribution of atmospheric temperature from 22 km to 60 km[14]. From 2008, the Chinese meridian project deployed several lidars in China, including Rayleigh lidars at Beijing, Hefei, Wuhan, and Hainan[15]. Yue et al. used Rayleigh lidar data to analyze the middle atmosphere temperature structure at Beijing[16]. Qiao et al. and Dai et al. used a Rayleigh lidar measurements at Golmud, Qinghai to show the temperature and density profiles over the Tibetan Plateau region and analyzed the seasonal variations of atmospheric density[17-18].
The Rayleigh lidar presented in this paper is the first Rayleigh lidar deployed at Chinese stations in Antarctica. We will describe the lidar system configuration in Section 1, the data retrieval method in Section 2, our initial measurement results in Section 3, and then summarize in the last Section.
-
The Rayleigh lidar system at Zhongshan station consists of three units: laser transmitter, optical receiver, and time control & signal acquisition unit. Figure 1 shows lidar schematic diagram and the system configurations are listed in Tab.1.

Figure 1. Schematic diagram of Zhongshan station Rayleigh lidar
Configuration Parameters Laser transmitter Wavelength/nm 532 Pulse energy/mJ 400 Repetition rate/Hz 30 Pulse width/ns 8 Lidar receiver Telescope diameter/m 0.8 Telescope f number 1.8 Fiber diameter/mm 1.5 Fiber NA 0.39 PMT quantum efficiency ~40% @ 532 nm Time control & signal acquisition Time generator DG645 Photon counting card P7882 Table 1. System configurations of Zhongshan station Rayleigh lidar
The lidar transmitter unit mainly consists of a neodymium-doped yttrium aluminum garnet (Nd:YAG) pulsed laser. The output laser is at the wavelength of 532 nm with single pulse energy ~400 mJ and repetition rate of 30 Hz. A high-precision beam controller is used to steer the laser beam to the zenith direction.
A prime focus telescope with the diameter of 0.8 m is used as lidar receiver. In order to perform well under the cold weather condition in Antarctica, the telescope's primary mirror was made of devitrified glass, which has relatively smaller thermal expansion coefficient. A multi-mode optical fiber with 1.5 mm core diameter and 0.39 numerical aperture (NA) is used to couple the telescope to the subsequent optical path. A mechanical chopper with the rotation rate of 5400 rpm is used to block the photon signal at lower altitudes for protecting the photon multiplier tube (PMT) from saturation. After passing through the chopper and an optical filter, received photons are finally detected by a PMT (Hamamatsu H7421-40, with the quantum efficiency ~40% at 532 nm).
The PMT converts optical photons to electrical signals being recorded by a digitizer (Fast ComTec MCA-3 Series/P7882). The timing control of the lidar is designed as follows. The primary timing is generated by the chopper in the receiving channel at the frequency of 180 Hz. Then the chopper triggers a digital delay/pulse generator (DG645) so that for every six pulses from the chopper, the DG645 is triggered once. Therefore a timing signal with the repetition rate of 30 Hz is produced to trigger the Nd:YAG laser's flash lamp. The same timing is also synchronized to the data acquisition unit.
-
The atmospheric density and temperature retrieval of Rayleigh lidar we used here follows a standard method[6], which is based on the lidar equation, ideal gas law, and hydrostatic equilibrium equation.
-
The Rayleigh scattering lidar equation can be expressed as:
where A is a parameter dependent on both laser pulse energy and telescope diameter,
$ \eta $ is system efficient,${T}_{{\rm{A}}}$ is atmospheric transmittance,${\sigma }_{{\rm{ray}}}$ is Rayleigh backscatter cross section,$ \rho \left({\textit{z}}\right) $ is atmospheric density at altitude z, and${N}_{{\rm{B}}}$ is background noise. If we choose$ {{\textit{z}}}_{0} $ as the reference altitude, we can calculate atmospheric density at altitude z as:where
$ \rho \left({\textit{z}}\right) $ and$ N\left({\textit{z}}\right) $ are the air density and lidar photon count at altitude z, respectively,$ \rho \left({{\textit{z}}}_{0}\right) $ is the reference density from an atmospheric model. In our case, we used the MSIS (Mass Spectrometer and Incoherent Scatter) model[19-20].The uncertainty of Rayleigh lidar density is caused by the random statistical uncertainty of PMT detectedphoton counts, which obeys the Poisson distribution, that is,
$ \Delta {N\left({\textit{z}}\right)}^{2}=N\left({\textit{z}}\right) $ . Therefore, the uncertainty of Rayleigh lidar density can be expressed as: -
The ideal gas law is expressed as:
where
$ P $ is atmospheric pressure, V is volume,$ n $ is the amount of gas,$ R $ is the ideal gas constant, and$ T $ is temperature. The relation between mass and density can be expressed as:And hydrostatic equilibrium equation is shown as:
By combining Eq. (4)-(6), we can get the atmospheric temperature as:
where
$T\left({{\textit{z}}}_{{\rm{seed}}}\right)$ and$\rho \left({{\textit{z}}}_{{\rm{seed}}}\right)$ are temperature and density at the seeding altitude zseed, respectively. They are usually adopted from atmospheric model, such as the MSIS model.To estimate the Rayleigh temperature uncertainty, Eq. (7) can be approximately expressed as:
where
${N}_{{\rm{R}}}\left({\textit{z}}\right)=N\left({\textit{z}}\right)-{N}_{{\rm{B}}}$ is the Rayleigh scattering signal.And from Eq. (8), the temperature uncertainty can be calculated as:
where
$ k\left({\textit{z}}_{i}\right)=\dfrac{\Delta {\textit{z}}}{R}g\left({\textit{z}}_{i}\right){\left(\dfrac{{\textit{z}}_{i}}{\textit{z}}\right)}^{2} $ for$ {\textit{z}}_{i}={\textit{z}}+\Delta {\textit{z}}, {\textit{z}}+2\Delta {\textit{z}},\cdots ,{\textit{z}}_{0} $ . Since the air density decreases exponentially with increasing altitude, the maximum temperature uncertainty is around the seeding altitude where the lidar signal is the weakest. From Eq. (9), the Rayleigh temperature uncertainty can be estimated by:where
$S\!\!BR\left({\textit{z}}\right)={N}_{{\rm{R}}}\left({\textit{z}}\right)/{N}_{{\rm{B}}}$ is the signal to background ratio. -
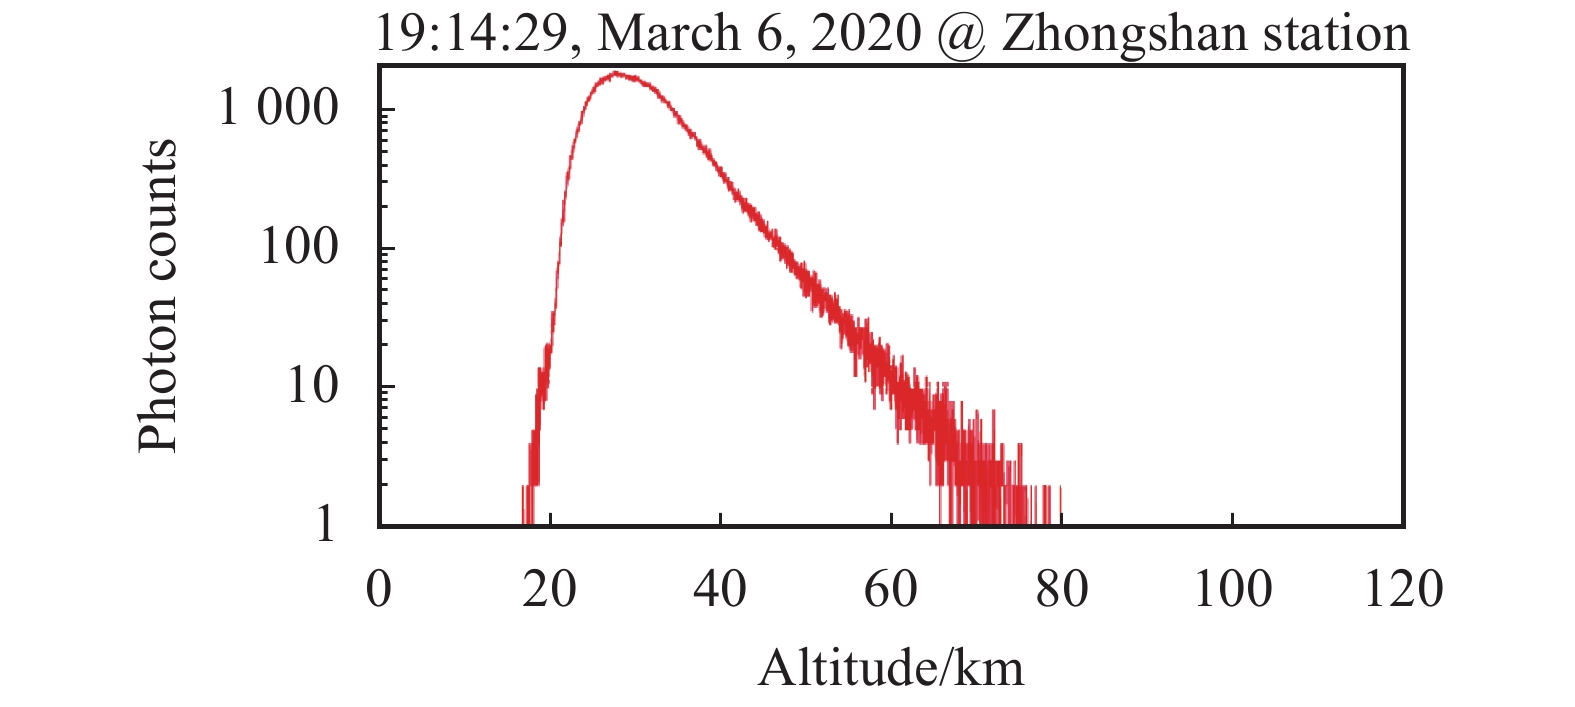
A typical Rayleigh lidar raw signal profile at Zhongshan station is shown in Fig.2. This dataset was collected at 19:14:29 UT on March 6, 2020, with vertical resolution of 30 m and time resolution of 1 min (1800 laser pulses at 30 Hz repetition rate). From Fig.2, we can see that the lidar signal below 17 km is fully blocked by the mechanical chopper. The transition for this chopper from fully close to fully open is about 15 km, so in our case we can use the lidar signal above 32 km for data retrieval. From 32 km to 60 km, the photon counts level decrease from ~1000 to ~10. The background signal above 90 km is negligible, benefiting from less light pollution at night in the Antarctica region.

Figure 2. Rayleigh lidar raw signal profile at night on March 6, 2020, at Zhongshan station. The raw data has a vertical bin width of 30 m and an integration time of 1 min
Using the retrieval method described in Section 2, we can calculate the atmosphere density and temperature profiles, shown in Fig. 3(a) and 3(c), respectively, with the vertical resolution of 300 m and temporal resolution of 30 min. The MSIS model results and the satellite measurements from the Sounding of Atmosphere Broadband Emission Radiometer (SABER)[21], onboard the Thermosphere Ionosphere and Mesosphere Electric Dynamics (TIMED) satellite, are used for lidar comparison. In general, we can see the atmospheric density and temperature profiles of lidar, MSIS, and SABER show a good agreement. The density in Fig.3(a) exponentially decays from 0.005 to ~0.0002 kg/m3 with increasing altitude. In Fig.3(c), all three results show that the temperature increases with altitude below stratopause and decreases with altitude above stratopause. Both lidar and SABER measurements exhibit more wave perturbation structures than the model. This may indicate that the MSIS model represents a mean status of atmosphere, but observations can reveal more details of the atmospheric wave information. Therefore lidar observations can be used to characterize the wave characteristics and to study how these waves influence the background atmosphere. Figure 3(b) and 3(d) are the lidar measurement uncertainties of density and temperature, respectively, based on the calculation of Eq.(3) and Eq.(10). The uncertainties shown here are mostly induced by lidar photon noise. We can see that the air density uncertainty is less than 1.5% and the temperature uncertainty is within 1 K.

Figure 3. Comparison of atmospheric density (a) and temperature (c) between lidar (red solid), MSIS model (blue dash), and SABER satellite (green dash) data near Zhongshan station on March 6, 2020. The vertical resolution is 300 m and the temporal resolution is 30 min for lidar data. Lidar measured density uncertainty (b) and temperature uncertainty (d) were also plotted
Presented in Fig.4 are lidar observations lasting for ~10 h continuously on June 30, 2020, with 300 m vertical and 30 minutes temporal resolutions. From Fig.4(a), we can see that stratopause is around 52 km, and the stratopause temperature increases by almost 20 K from 265 K at 11∶15 UT to 285 K around 18∶15 UT, and then gradually decreases. The air density profiles, exponentially decreasing with increasing altitude, are shown in Fig.4(b) under the logarithm scale. In this case, the air density at 40 km is around 0.002 kg/m3, and decreased with altitude to
$ 5.0\times{10}^{-5} $ kg/m3 at 70 km. If we subtract the mean background temperature from the temperaturecolor contour in Fig.4(a), we can get the temperature perturbation in Fig.4(c), which shows wave structures of larger amplitude with increasing altitude. Similar method was applied to observe the atmospheric density and density perturbation. From Fig.4(c), we can estimate some wave parameters, such as the wave period of 6-7 hours, the vertical wavelength of 16-18 km, and the wave downward propagation speed of around 2.5 km/h. And in Fig.4(d), similar wave structure is also shown in density perturbation plot. Overall, the temperature and density perturbations presented here demonstrate that the Zhongshan station Rayleigh lidar is capable of providing high-resolution dataset for investigating the middle atmosphere waves in the Antarctica region.
Figure 4. Zhongshan station Rayleigh lidar measured temperature (a), density (b), temperature perturbation (c), and density perturbation (d) on June 30, 2020. The density (b) is plotted in color contour under the logarithm scale
-
A Rayleigh lidar has been deployed at Zhongshan station (69.4° S, 76.4° E), Antarctica, and operated since March 2020. Using a 400 mJ laser and 0.8 m diameter primary focus telescope, atmospheric density and temperature were measured in the USLM region. The lidar measured density and temperature profiles on March 6, 2020 are presented. A comparison of lidar, MSIS model, and satellite (SABER/TIMED) result shows a good agreement. Lidar measurement uncertainties of density and temperature were mostly induced by photon noise. At nighttime under clear sky condition, the density uncertainty is less than 1.5% and the temperature uncertainty is less than 1.0 K. A continuous observation on June 30, 2020 showed wave structure in the middle atmosphere at Zhongshan station. Thus, this lidar can provide a reliable dataset for studying USLM thermal structure, waves, and energy exchange among different atmospheric layers. We also plan to upgrade the lidar system by extending the altitude coverage.


 DownLoad: