


-
星敏感器主要应用于航天领域,以一颗可见星等的恒星为基准,测量其相对于航天器的角位置坐标,并与星表中该恒星的角位置参数对比,进而得到航天器的具体位置,星敏感器用于提供卫星的三轴姿态数据以及恒星的光谱探测[1-5]。星敏感器在使用之前需要进行功能性能的测试,但在空中进行测试难度极高且价格非常昂贵,因此测试工作要在地面上进行,星模拟器就是模拟天空中真实的恒星,配合星敏感器完成地面的标定[6-8]。宇宙中恒星数量极多且恒星的光谱型和亮度种类繁多,为了模拟真实的恒星,尽可能提高星敏感器的标定精度,则多色温、多星等、高精度的星模拟器光源的研究就格外重要。
目前,星模拟器光源存在色温和星等的模拟范围小且模拟精度低的问题。如2014年,李晓妮[1]等基于最小二乘法,采用以白光LED光源为基底光源,多种单色LED进行光谱补偿的方法,经过双积分球的匀化,实现了色温3 900、4 800、6 500 K的模拟,星等0 Mv和2 Mv的模拟,模拟光谱的误差和模拟星等误差分别在15%和6%范围内。2018年,张晓娟[9-10]等从理论分析,采用氙灯和溴钨灯组成的宽光谱光源阵列,在350~900 nm波长范围内,采用最小二乘法和遗传算法,模拟色温3 900、4 800、6 500 K,色温模拟误差优于3.73%,并且建立星等能量计算模型,利用线性渐变密度滤光片和步进电机共同作用实现−2~6Mi的模拟,星等模拟误差优于±10%;2020年,sun[11]等设计了一种基于可调背景光的星等模拟系统,采用氙灯和卤素灯混光,经过积分球的匀化,且在积分球出口处安装可变光阑来控制积分球出口处的辐射照度,实现了−2~+6等星的模拟,匹配误差优于±0.23Mi。
根据所了解的星模拟器光源发展现状,可知常规的星模拟器光源所模拟的色温和星等的范围小,且模拟精度低,不能精准的模拟天空中恒星的特性。为精准标定星敏感器,文中研究了高精度模拟的多色温多星等星模拟器光源系统。
-
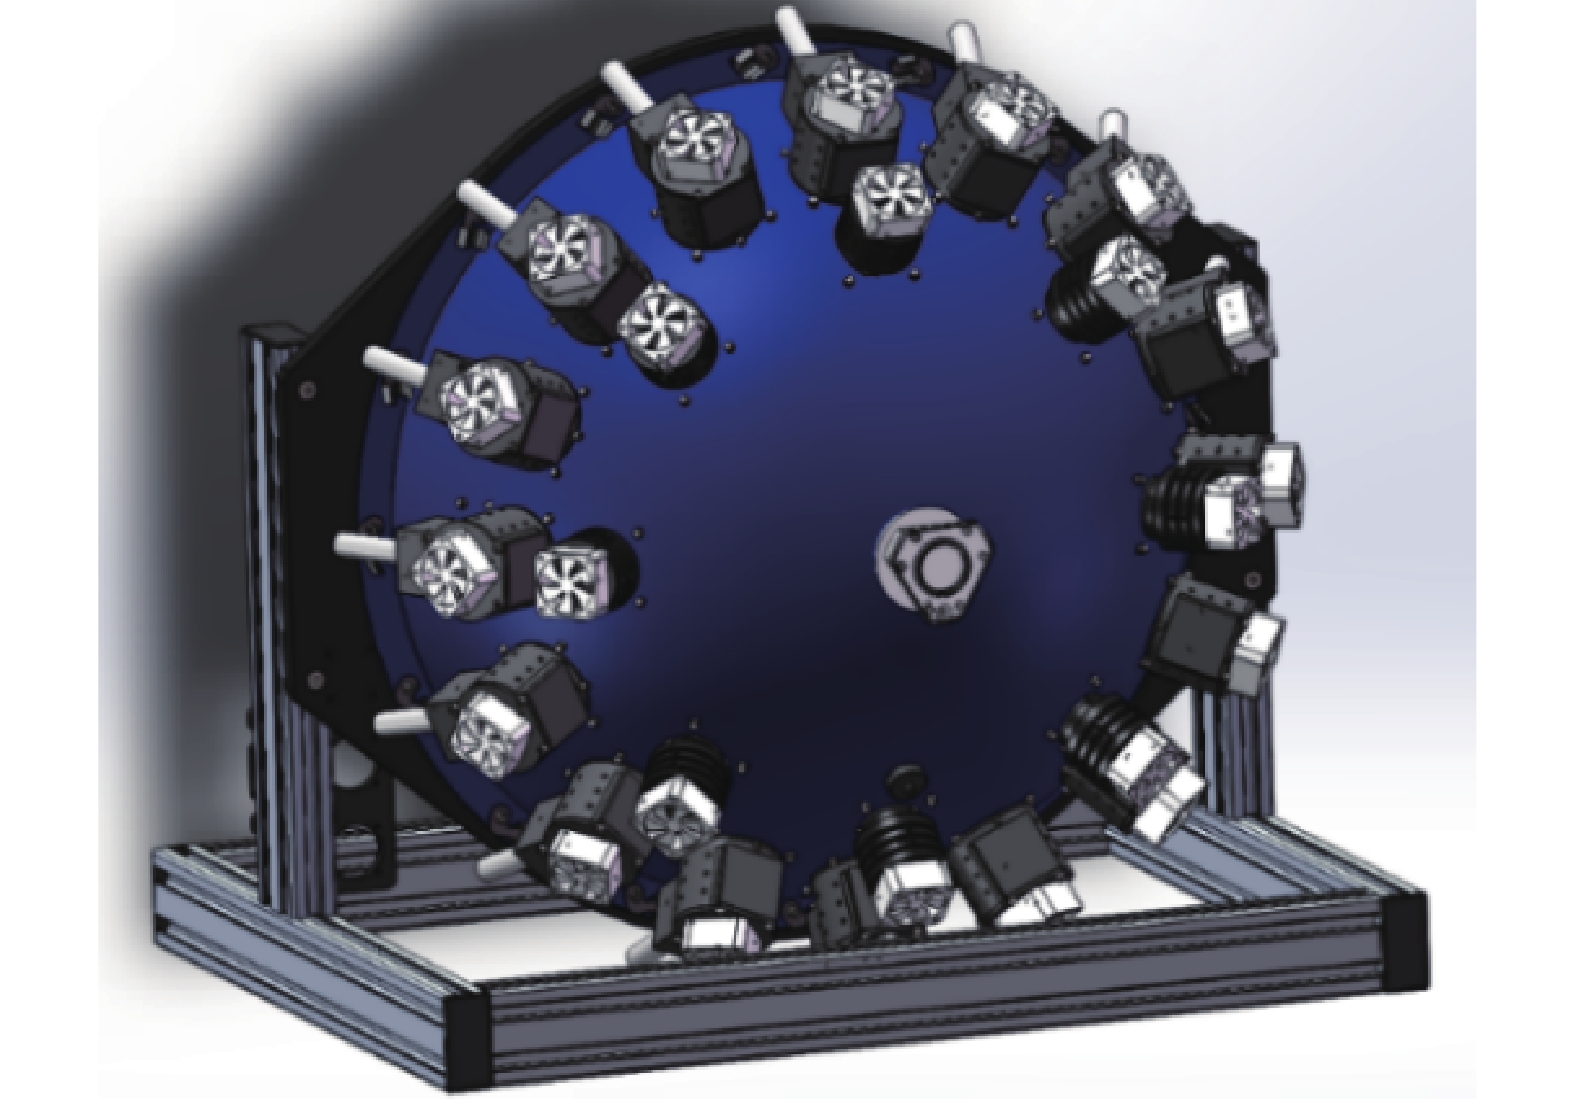
该系统由积分球、LED光源、溴钨灯光源、光纤光谱仪及控制系统等组成,如图1所示。控制程序主要包括光谱匹配模块和LED驱动控制模块。LED模块上安装了不同峰值波长和光谱分布的LED,通过调整LED的开关或者电流占空比来改变积分球的输出光谱分布。同时,光纤光谱仪实时地监测光源的输出光谱分布,反馈到主控计算机,主控计算机通过控制软件计算模拟色温光谱和目标色温光谱的差异,并根据差异对LED参数进行调整,直至光源输出与目标色温和星等最为匹配的光谱分布。
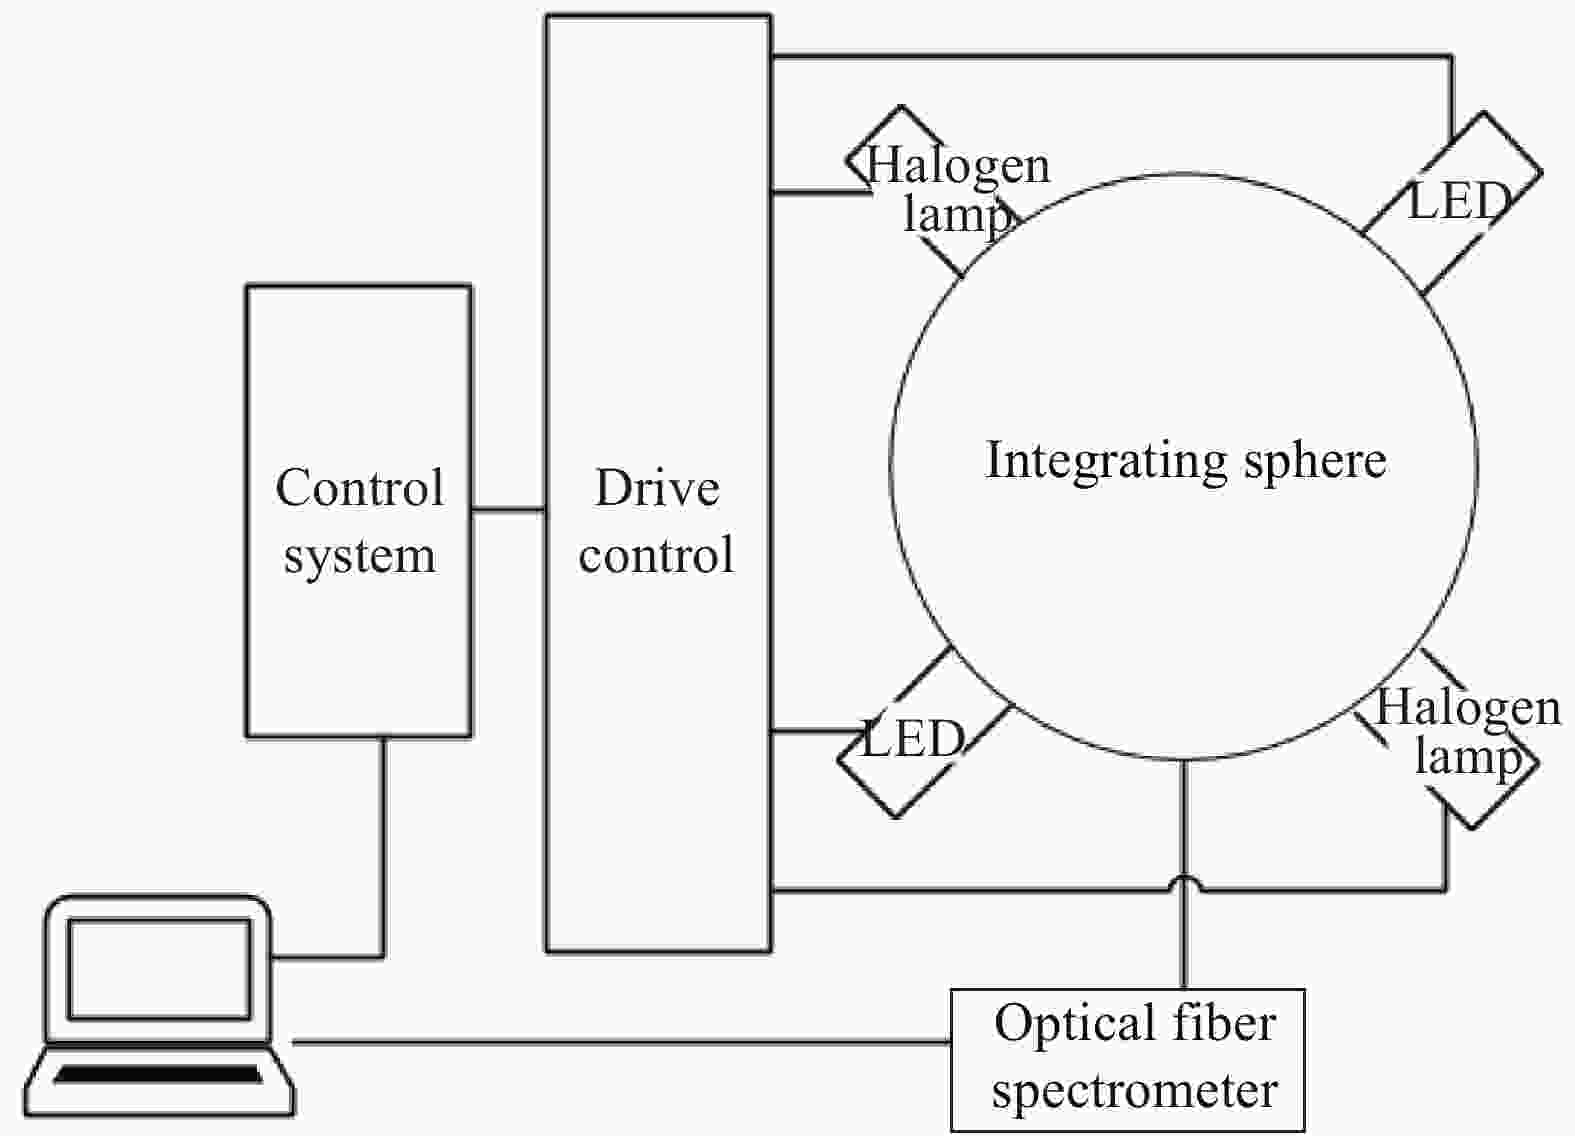
Figure 1. System composition diagram
-
积分球是一种具有高反射内表面的空腔球体,积分球的作用是将各个光源发出的光进行混合和匀化[12]。积分球的内部涂有漫反射材料,通常选用的漫反射材料有聚四氟乙烯(F4)或硫酸钡(BaSO4),F4涂层的反射率可达到98%[13]。因此文中采用在积分球内壁喷涂聚四氟乙烯(F4)漫反射材料。根据计算得到400~900 nm波长范围内积分球出口处的辐射亮度最低为0.686 W/(m2·sr),根据积分球内LED的辐射通量以及积分球尺寸与开口大小的关系,最终设计积分球的内球半径为
$R = 250\;{\rm{mm}}$ 。图2所示为积分球的结构图。
Figure 2. Integrating sphere structure diagram
积分球的辐射方程为:
式中:Φin 为输入积分球的总辐射通量;S为积分球的内球径面积,S=4πR2;ρ为积分球内壁光谱平均反射率,ρ=0.98; f为开口系数:f=
$\displaystyle\sum $ Si /S,为保证积分球出口处的光度均匀性,开口比不能大于5%,本积分球的出光口直径为25 mm,则f=0.05。当Lout(max)=307.31 W/(m2·sr)时,Φin=53.45 W;Lout(min)=0.416 W/(m2·sr)时,Φin=0.072 W。 -
根据市场调研,选择USHIO LED,在400~900 nm波长范围内,USHIO LED的辐射功率在0.85~200 mW范围内,个别LED辐射功率可达到500 mW,选择的LED功率过低则所需的LED数量增多,会导致开口面积增大,不能保证输出光的均匀性。因此,采用较大功率基底光源和LED混光的模式,通过增大光源功率,减小积分球开口面积以保证输出光的均匀性。星模拟器光源的基底光源通常选择氙灯和溴钨灯,氙灯的色温接近6 000 K,但氙灯的启动电压极高,通常可达到上千伏,且氙灯光度稳定性差,易受外界磁场、内部气压和环境振动等影响;溴钨灯是可见-近红外波段的光源,色温接近3 000 K,具有稳定性好、尺寸小、使用方便的优点,在400~900 nm谱段范围内光谱辐射曲线光滑且连续。综合考虑,文中所设计的星模拟器光源采用以3个20 W溴钨灯为基底,多种单色LED光源进行混光而成。
溴钨灯的光谱辐射亮度曲线如图3所示。

Figure 3. Spectral radiance curve of bromine tungsten lamp
LED光源具有寿命长,稳定性好、低功耗的优点[14-15]。其作为准单色光,半峰宽度大部分在10 ~40 nm,高斯分布函数可近似表示单色LED的光谱分布曲线,关系式为:
式中:λp为LED光源的峰值波长;α为电光转换的比例系数;WF为LED辐射强度光谱分布的半峰宽度。图4所示为400~900 nm波长范围内所选32种不同峰值波长的LED归一化后的光谱曲线图。
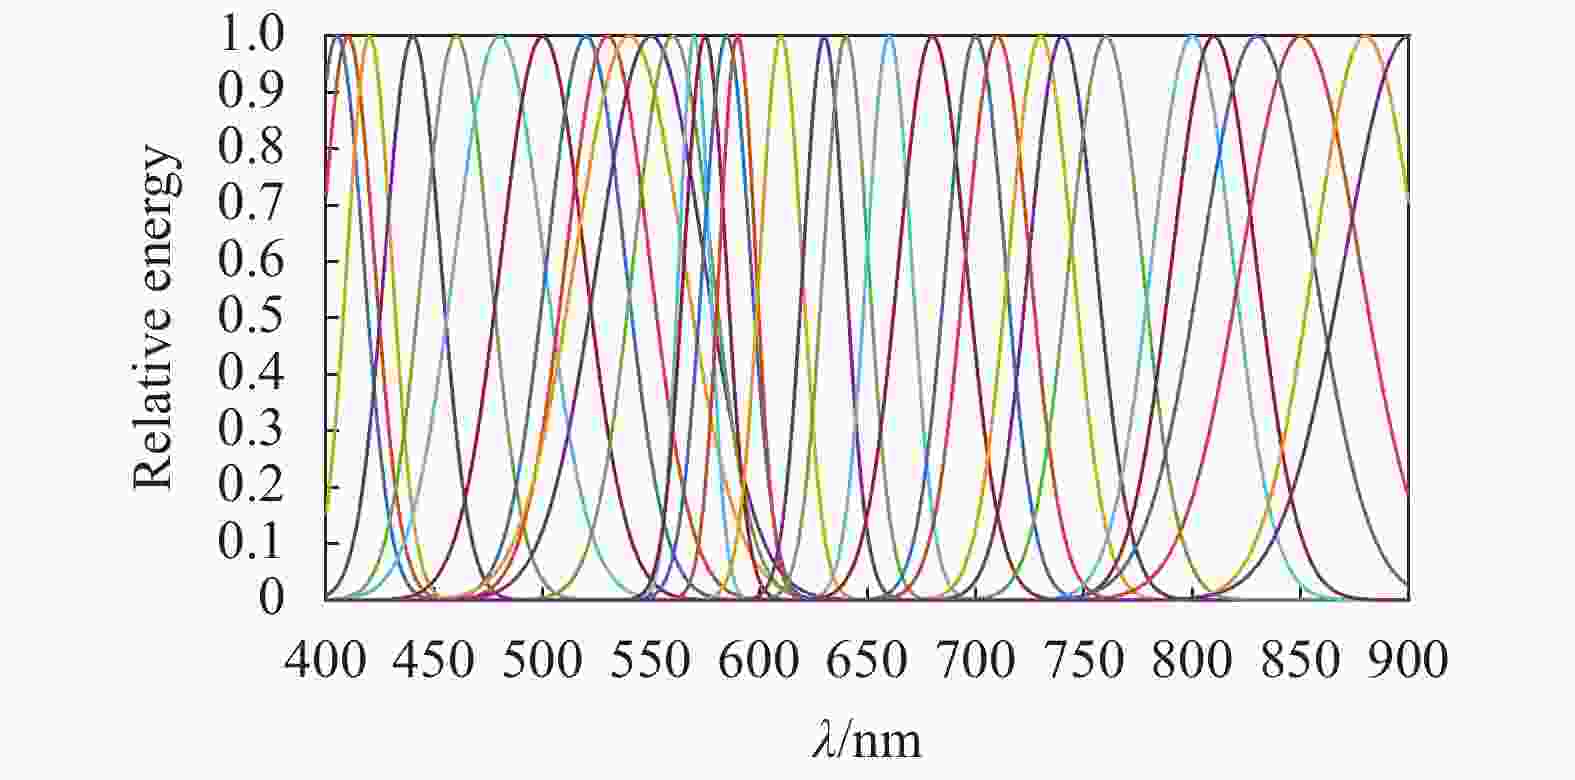
Figure 4. Spectral curve of selected LED
-
星等是用来衡量天体亮度的物理量,星等分为视星等和绝对星等[16-18]。文中所指星等代表的是视星等,星等的值越小,表示星星越亮。文中模拟的照度达到10−12量级,经过市场调研显示国内外的弱光照度计的探测范围仅能达到10−9量级,因此采用间接计算的方法计算出积分球的出射光辐亮度。
如图5所示,已知面光源在距离r处的表面上形成的照度:
式中:dAs为光源的发光面积;L0为光源的光亮度;α为发光面的法线与r方向的夹角;β为受照面的法线与r方向的夹角。
则星点分划板上的照度:
由于经过平行光管的光存在一定的损耗,则平行光管出口处的辐照度为:
式中:D为星点板星点直径;f为平行光管焦距;L为积分球出口处亮度;τ为平行光管的透射率。
文中所设计的星模拟器平行光管出口处的辐照度如表1所示。
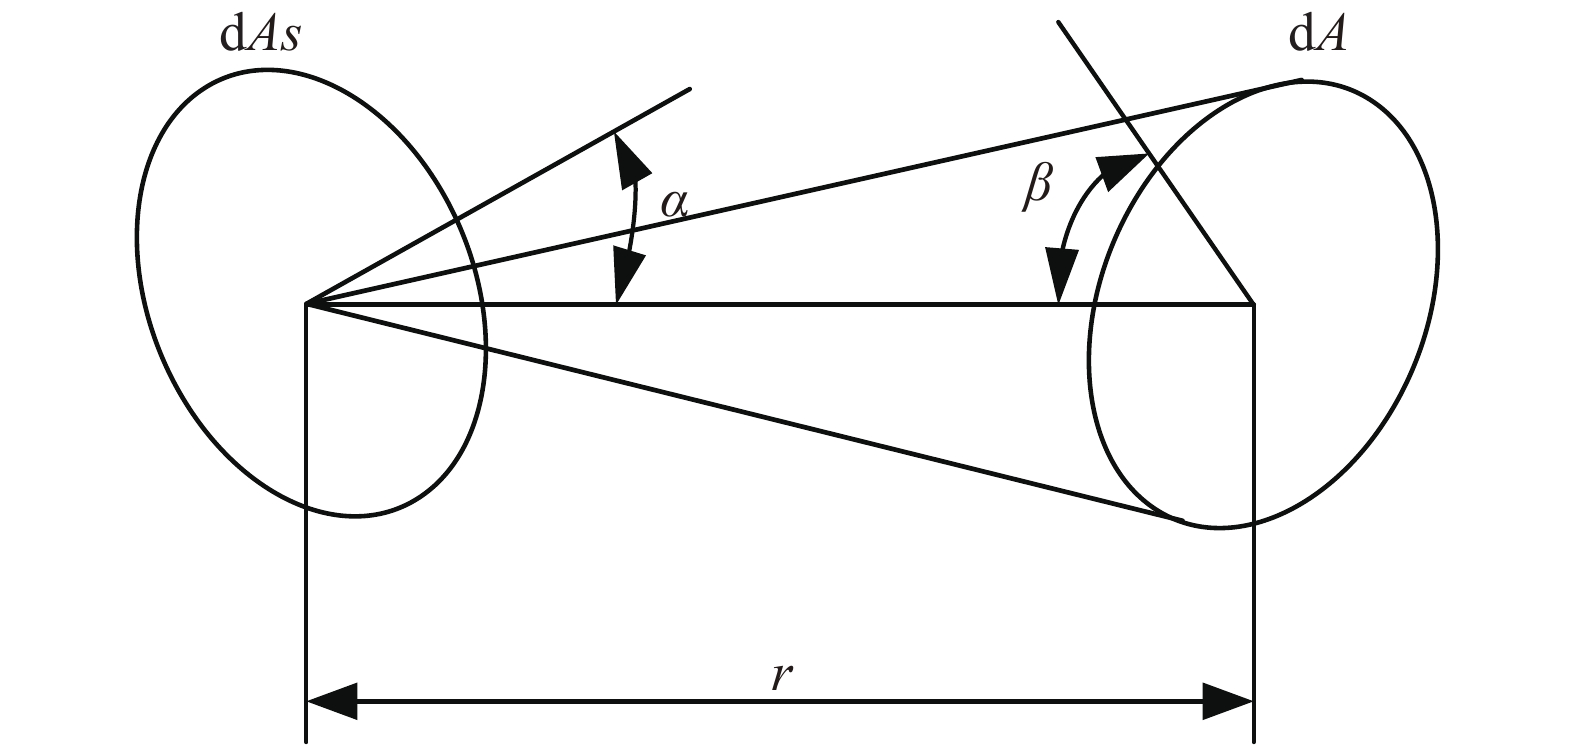
Figure 5. Illuminance formed by the surface light source on the surface at the distance r
Color temperature
magnitude3 000 K/
(W/m2)4 300 K/
(W/m2)5 500 K/
(W/m2)6 500 K/
(W/m2)7 600 K/
(W/m2)20 000 K/
(W/m2)+2Mi 4.29×10⁻⁹ 2.81×10⁻⁹ 2.47×10⁻⁹ 2.36×10⁻⁹ 2.32×10⁻⁹ 2.37×10⁻⁹ +3Mi 1.71×10⁻⁹ 1.12×10⁻⁹ 9.82×10⁻¹⁰ 9.40×10⁻¹⁰ 9.22×10⁻¹⁰ 9.42×10⁻¹⁰ +4Mi 6.79×10⁻¹⁰ 4.46×10⁻¹⁰ 3.91×10⁻¹⁰ 3.74×10⁻¹⁰ 3.67×10⁻¹⁰ 3.75×10⁻¹⁰ +5Mi 2.70×10⁻¹⁰ 1.77×10⁻¹⁰ 1.56×10⁻¹⁰ 1.49×10⁻¹⁰ 1.46×10⁻¹⁰ 1.49×10⁻¹⁰ +6Mi 1.08×10⁻¹⁰ 7.06×10⁻¹¹ 6.20×10⁻¹¹ 5.93×10⁻¹¹ 5.82×10⁻¹¹ 5.95×10⁻¹¹ +7Mi 4.28×10⁻¹¹ 2.81×10⁻¹¹ 2.47×10⁻¹¹ 2.36×10⁻¹¹ 2.32×10⁻¹¹ 2.37×10⁻¹¹ +8.5Mi 1.08×10⁻¹¹ 7.06×10⁻¹² 6.21×10⁻¹² 5.92×10⁻¹² 5.81×10⁻¹² 5.94×10⁻¹² Table 1. Irradiance at the exit of the collimator
积分球光源发出的光线经过位于焦面位置的星点分划板形成携带色温、星等特性的星点光源,星点光源的光线经过准直光学系统后形成平行光线入射到星敏感器的入瞳。其中星点板星点直径D=20 μm,平行光管的焦距f=3 m,平行光管的透过率τ=0.4,根据公式(4)计算得到+2~+8.5等星,色温3 000 、4 300 、5 500 、6 500、7 600 、20 000 K时积分球出口处的辐射亮度如表2所示。
Color temperature
magnitude3 000 K
/W/(m2·sr)4 300 K
/W/(m2·sr)5 500 K
/W/(m2·sr)6 500 K
/W/(m2·sr)7 600 K
/W/(m2·sr)20 000 K
/W/(m2·sr)+2Mi 307.31 201.29 176.93 169.05 166.19 169.77 +3Mi 122.49 80.23 70.34 67.33 66.05 67.48 +4Mi 48.64 31.95 28.01 26.79 26.29 26.86 +5Mi 19.34 12.68 11.18 10.67 10.46 10.67 +6Mi 7.71 5.06 4.44 4.25 4.17 4.26 +7Mi 3.07 2.01 1.77 1.69 1.66 1.70 +8.5Mi 0.774 0.506 0.445 0.424 0.416 0.426 Table 2. Radiance at the exit of the integrating sphere
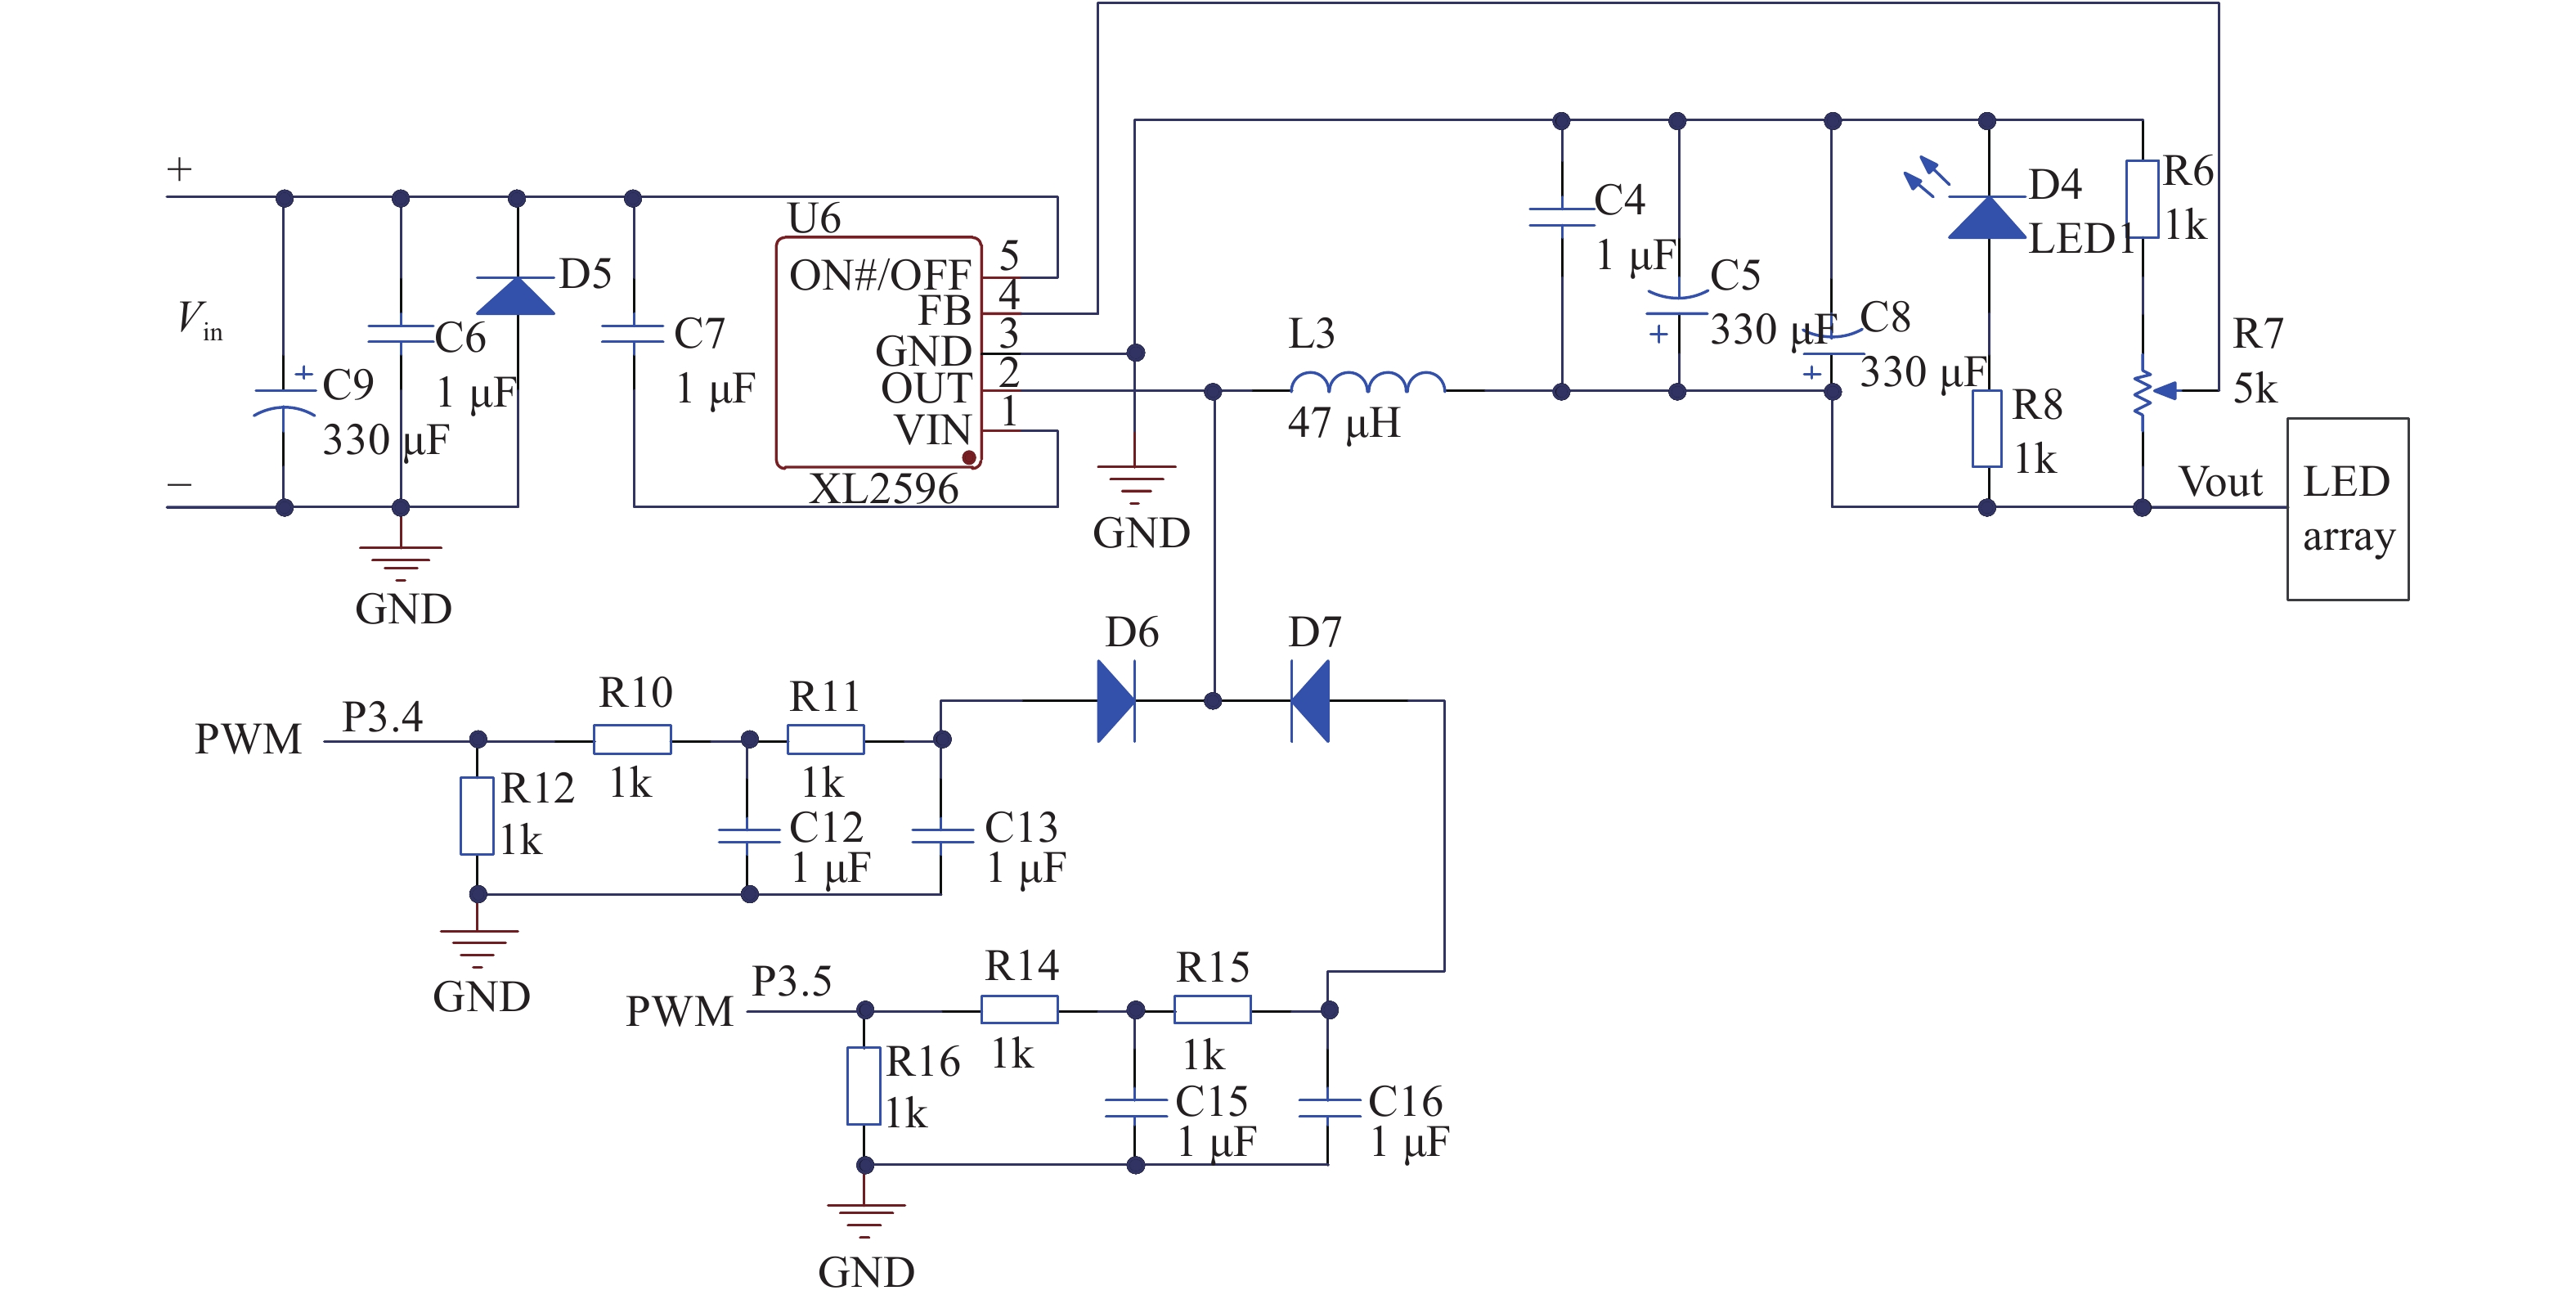
由于LED恒流驱动只会改变LED的发光亮度而不会改变LED的色温,因此通过恒流驱动方式控制LED及溴钨灯光源驱动电流以及开关来调节积分球出口处的光照度从而实现+2~+8.5Mi的模拟。LED恒流驱动电路图如图6所示。
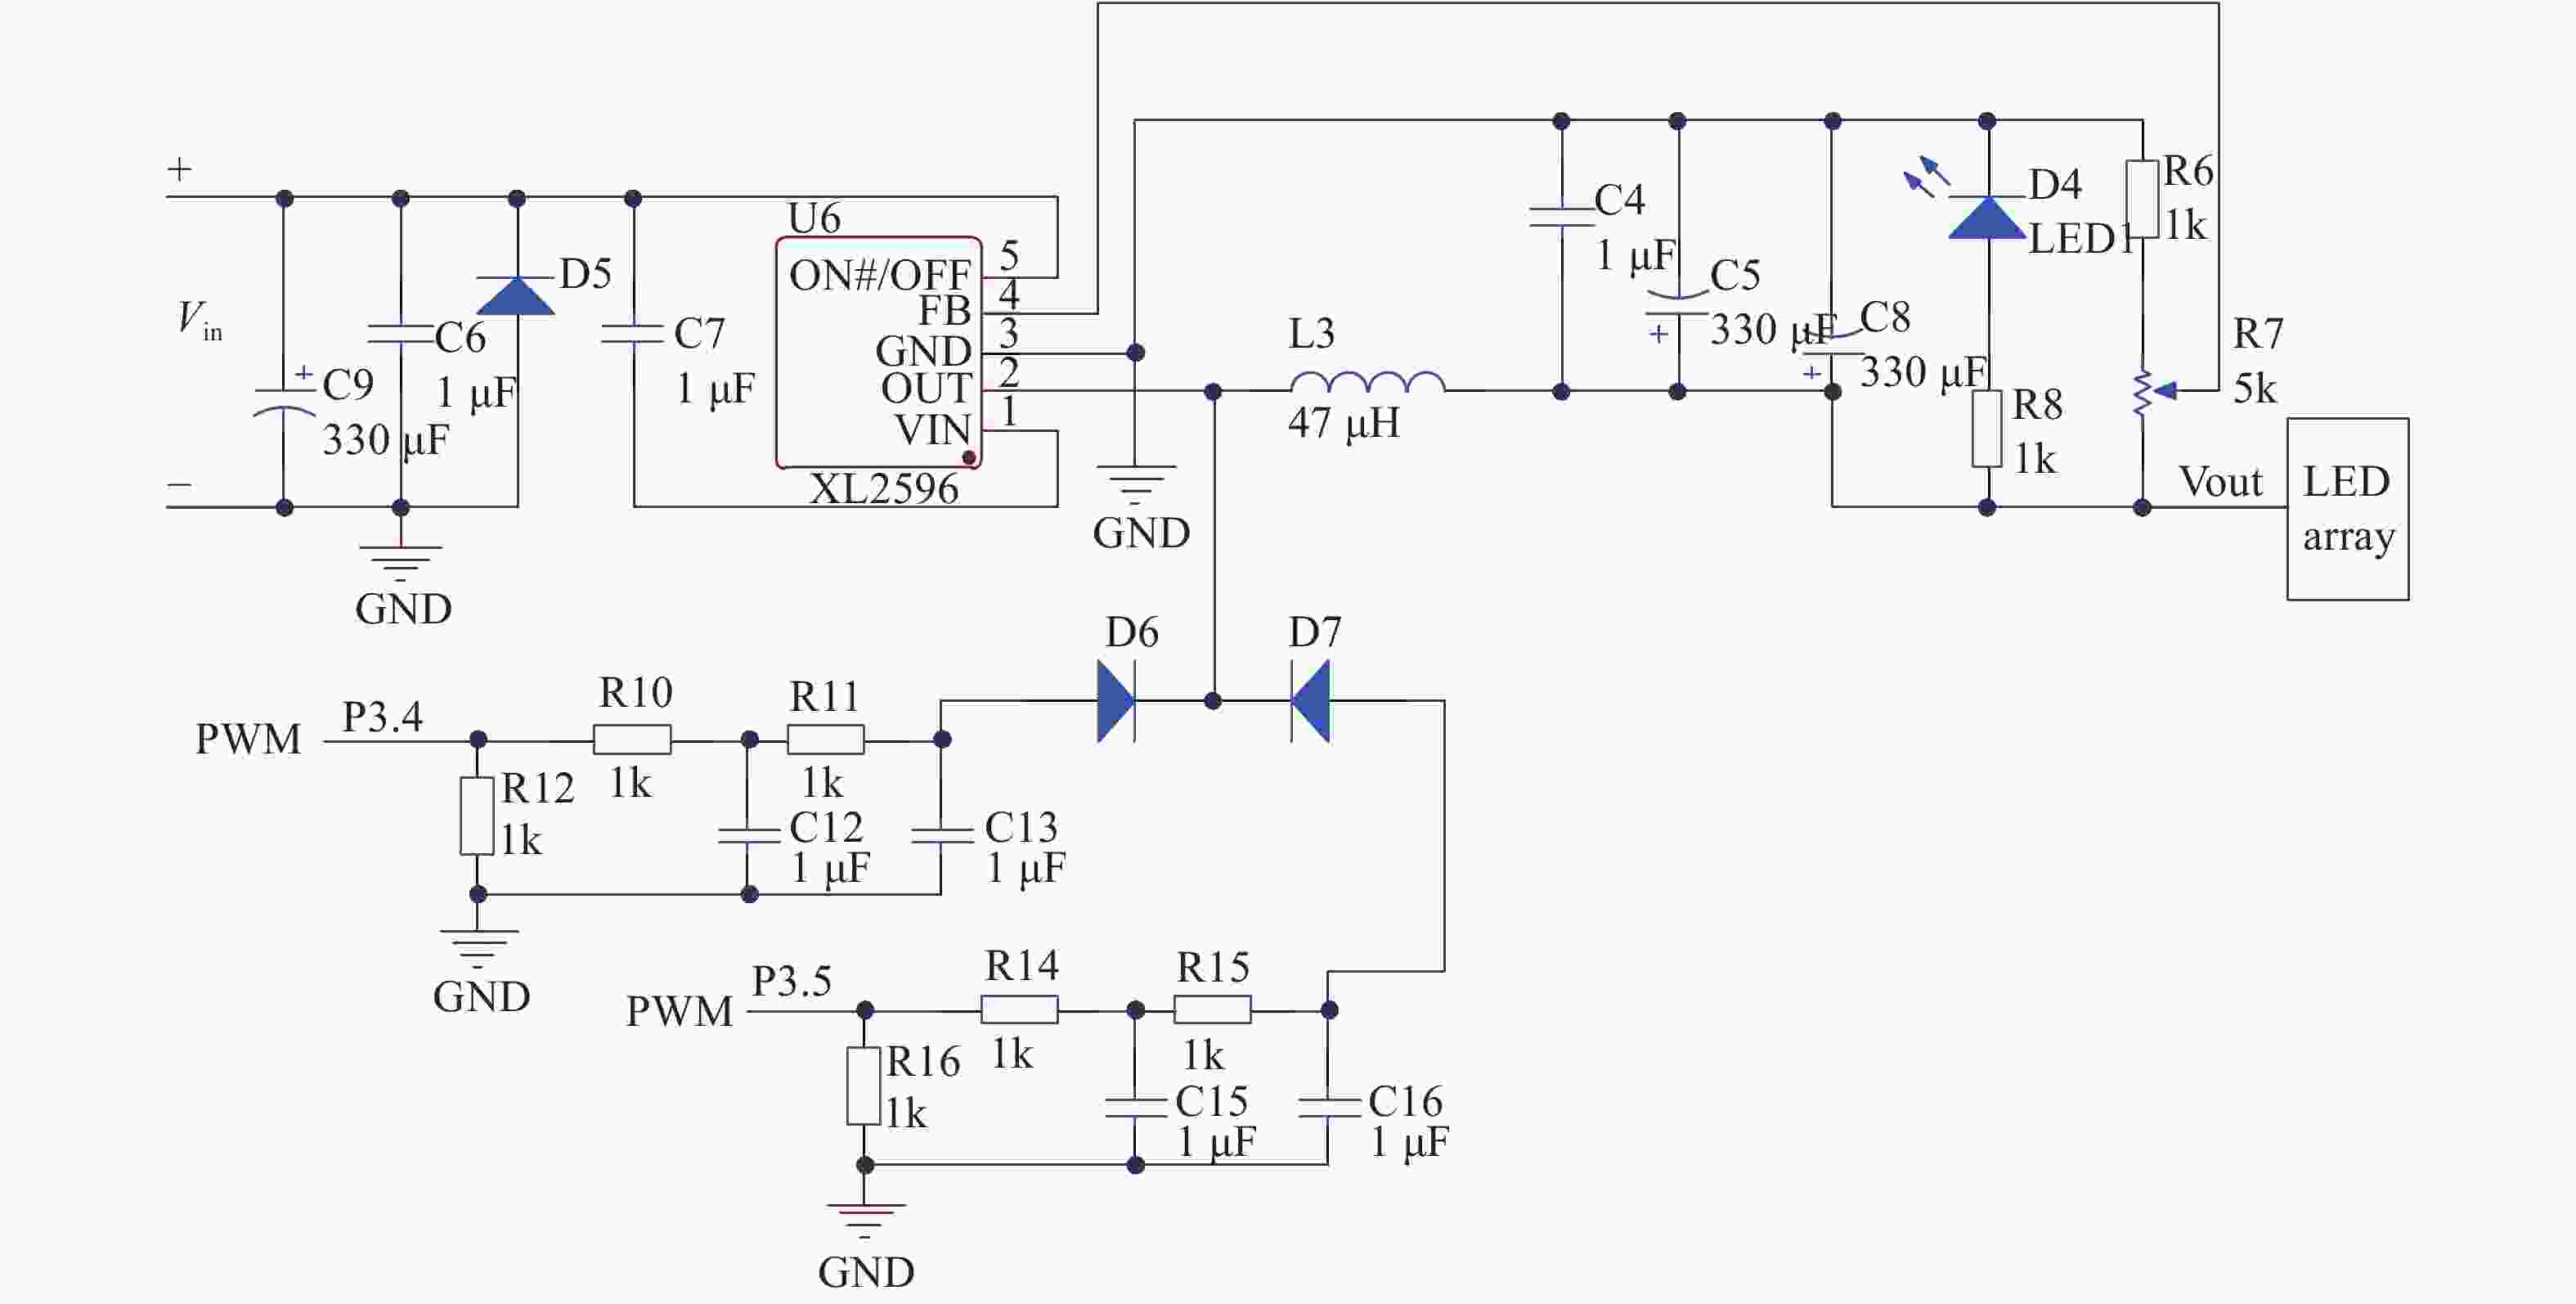
Figure 6. LED constant current drive circuit
-
根据辐射量子的理论,普朗克公式可以表征400~900 nm光谱范围内的黑体光谱辐射分布,其数学表达式如公式(6)所示。根据公式(5)可以得到色温模拟的理论曲线。
式中:U(λ,T)为黑体光谱辐射出射度(单位:W·m−2·nm−1);λ为指定的辐射波长(单位:nm);T为黑体的热力学温度(单位:K);h为普朗克常数,h=6.625 6×10⁻³⁴ W·s2;k为玻尔兹曼常数,k=1.380 54×10−23 W·s/K;c为光在真空中的传播速度,c=2.997 93×108 m/s。
假设有n种峰值波长不同的单色LED分别为LED1、LED2、LED3···LEDn,各LED的光谱分布分别为SLED1、SLED2、SLED3···SLEDn,根据光谱的叠加原理得到光谱合成的数学模型:
式中:a1、a2、a3…an为LED系数;Sbase(λ)为基底光源的光谱分布。
色温模拟技术最终可归结为优化算法的问题,即根据算法求出LED和溴钨灯组合的解,使色温模拟误差最小。
常用的智能优化算法有遗传算法、蚁群算法、量子行为粒子群算法、最小二乘法和模拟退火算法,如表3所示为5种算法的优缺点。
Number Algorithm Advantages Disadvantages 1 Genetic algorithm Main steps of the genetic algorithm include selection, crossover and mutation. It can be seen that the algorithm
has a simple structure, does not rely on complex models,
and has no requirements on the continuity and
differentiability of the objective functionIt has the local search ability, but the global search ability is not strong, and it is easy to fall
into the local optimal2 Ant colony algorithm Results obtained by ant colony algorithm do not depend on
the choice of the initial route, and its parameters are few,
the setting is simple and easy to be combined
with other algorithmsThere is no clear theoretical basis for the parameter setting of ant colony algorithm, most of which is determined by experience and experiment 3 Quantum particle swarm optimization Global convergence is good, the global search ability is strong, the particle position is random, will not fall into the global optimal solution, the algorithm itself execution time is short Difficulty in parameter selection 4 Least square method Calculation is simple and easy to be realized by
simple program of computerLeast square method is a linear estimation with certain limitations and low optimization accuracy. In the process of regression, it is impossible for the correlation formula of regression to pass every regression data point 5 Simulated annealing algorithm Calculation process is simple, universal and has strong sculling ability. It is suitable for parallel processing and can be used to
solve complex nonlinear optimization problemsAlgorithm convergence speed is slow, the running time is long, the algorithm
performance is related to the initial value,
the parameter is sensitiveTable 3. Advantages and disadvantages of the five algorithms
综合以上优化算法的特点,选择以量子行为粒子群算法作为光谱匹配的算法。量子行为粒子群算法的全局收敛性好,全局的搜索能力强,那么光谱匹配的精度就会提高,且算法本身的执行时间短,站在工程角度来说,也会减少整个星光模拟器的工作时间。
为了评价模 拟的色温与目标的色温的差异,引入适应度函数:
其中,
$ \Vert \cdot \Vert $ 为欧几里得范数。优化的目标是求解ai使F达到最小。量子行为粒子群算法(QPSO)是模仿智能动物的智能集体行为的一种群体智能方法[19-20]。将量子力学中δ的势阱理论引入到粒子群算法中,认为最优解就是势阱中势能最小的点,用波函数公式(9)来描述具有量子行为的粒子的状态,其解代表粒子在搜索空间某一点出现的概率。
式中:
$L{\rm{ = }}\dfrac{{{h^2}}}{{{m_0}\gamma }}$ ,${m_0}$ 为粒子质量。采用蒙特卡罗抽样初始化粒子的位置:
全部粒子的平均最好位置:
粒子位置更新方程为:
式中:
${M_{{{best}}}}$ 是全部粒子的平均最好位置;${p_{im}}$ 是第i个粒子在第m个维度下的最好位置;n为粒子数;Gj是粒子群全体最优位置;$\varphi \sim \left( {0,1} \right)$ ;${u_{ij}}\left( t \right) \sim U\left( {0,1} \right)$ ;$\alpha $ 为收缩扩张系数,一般随迭代而更新,初始一般取0.8,更新公式为:式中:
${\alpha _1}$ 、${\alpha _2}$ 分别为$\alpha $ 的初始值和最终值;$t$ 为迭代次数;${T_{\max }}$ 为预设的最大迭代次数。QPSO算法的步骤如下:
(1)随机初始化粒子群中粒子的位置;
(2)用公式(11)计算迭代中所有粒子的平均最优位置
${M_{{{best}}}}$ ;(3)从第二次迭代开始计算更新后的适应值,通过对比粒子的适应值,决定粒子位置是否更新;
(4)计算粒子群的全局最优位置
${G_j}$ ;通过对比粒子的全局最优位置,决定是否更新全局最优位置;(5)根据公式(12)计算粒子新的位置;
(6)重复步骤(2)~(5),直至迭代次数达到1 000次,循环结束。
图7是模拟色温5 500 K的收敛图,由图可以看出,随着迭代次数的增多,
$F\left( \lambda \right)$ 越来越小。图8是色温5500 K的模拟结果。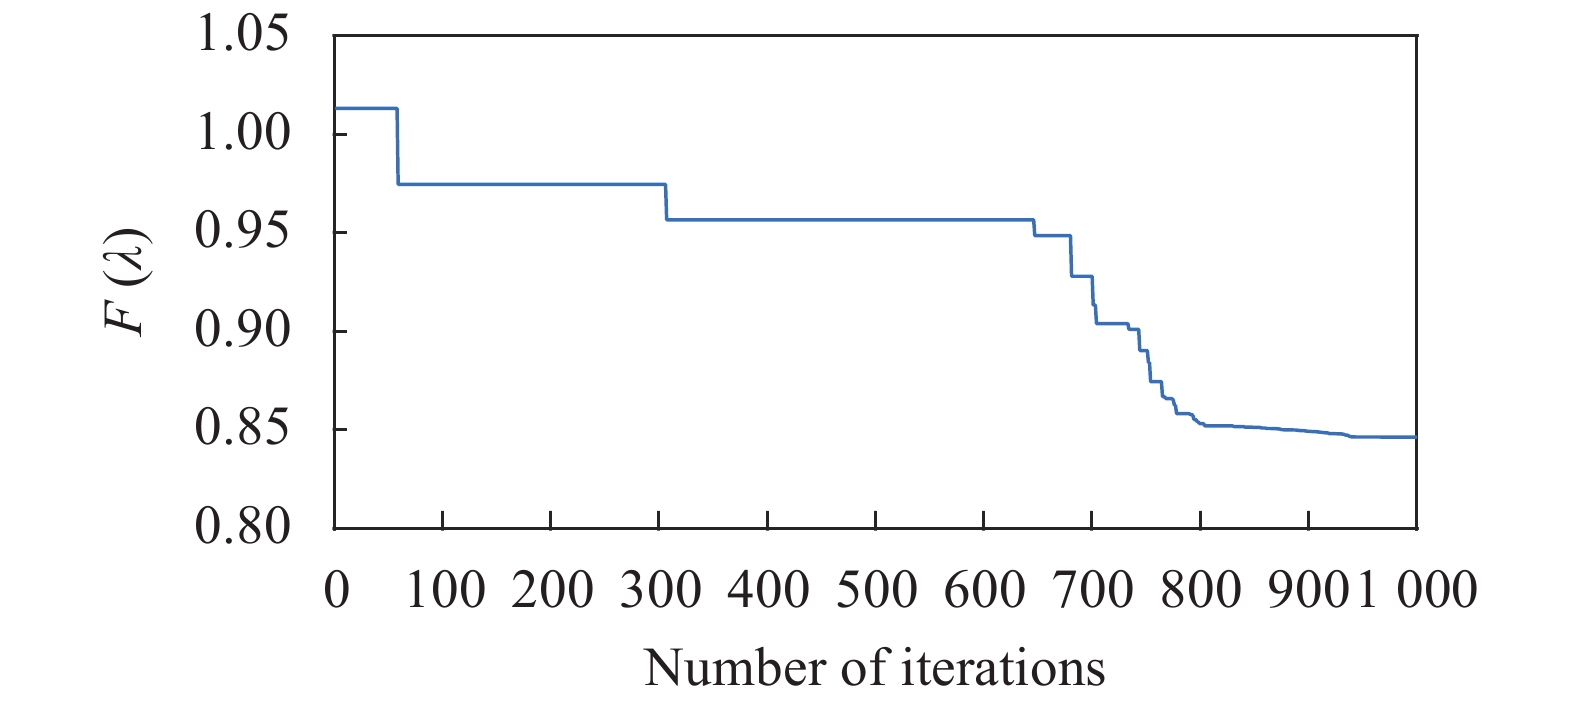
Figure 7. Convergence graph of simulated color temperature 5 500 K
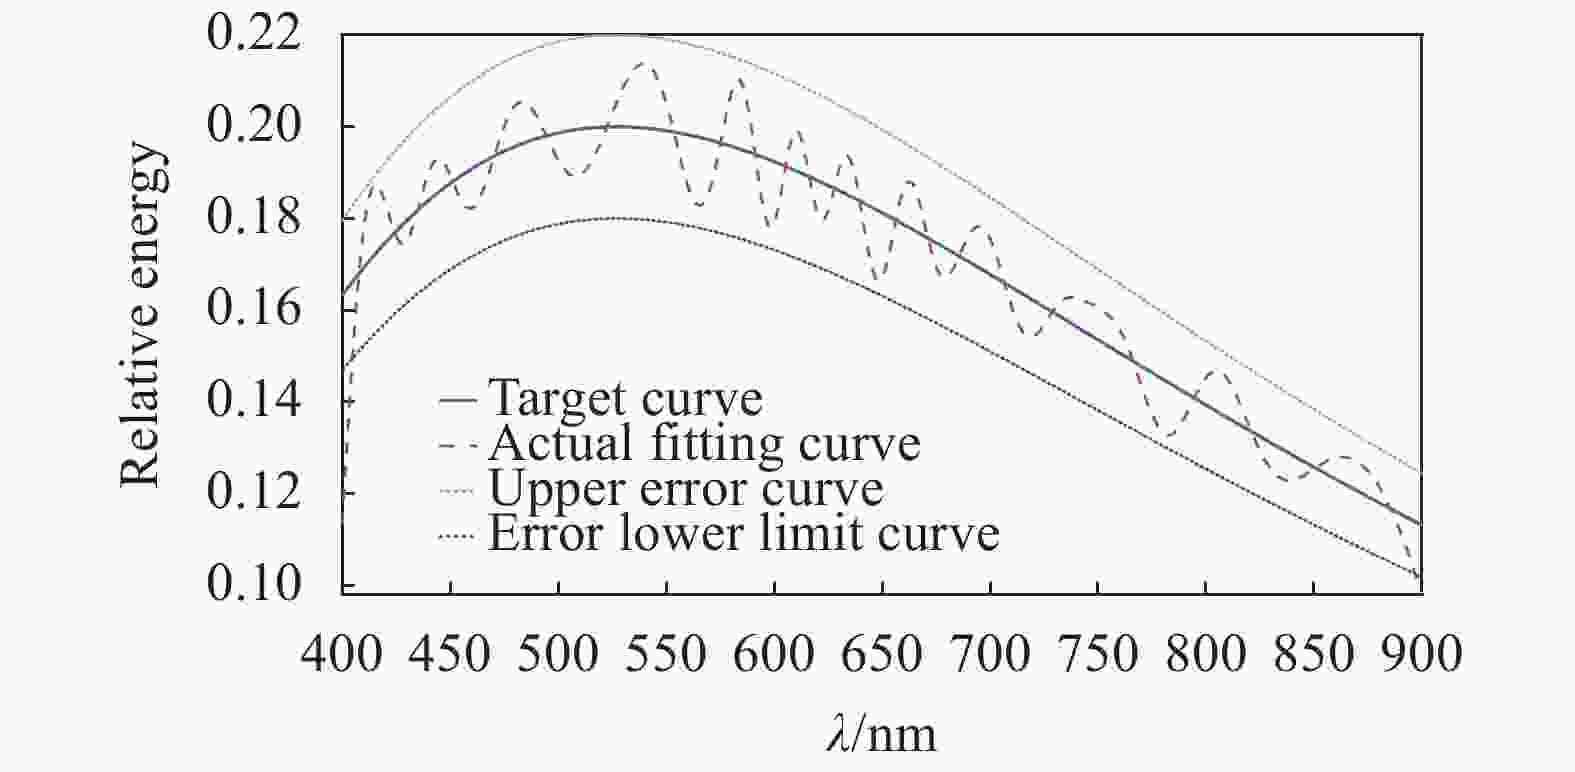
Figure 8. Simulation results of 5 500 K color temperature
同时,根据MATLAB计算出要模拟的+2~+8.5等星,3 000 ~20 000 K色温的光谱曲线需用的181个不同峰值波长的LED和3个溴钨灯。
-
在实验室光学平台上搭建星光光源模拟系统的测试平台,以+2Mi为测试星等,如图9所示,在暗室环境下利用海洋光学USB2000+光纤光谱仪分别测试 3 000、4 300、5 500、6 500、7 600、20 000 K不同色温下积分球出光口处的光谱分布曲线。利用光纤光谱仪实时监测色温的模拟结果,实验中光谱仪所测与标准黑体辐射光谱误差如公式(14)所示。表4列出了不同色温不同星等的光谱匹配误差。系统的软件控制界面如图10所示。图11为2等星5 500 K色温的光谱拟合曲线。
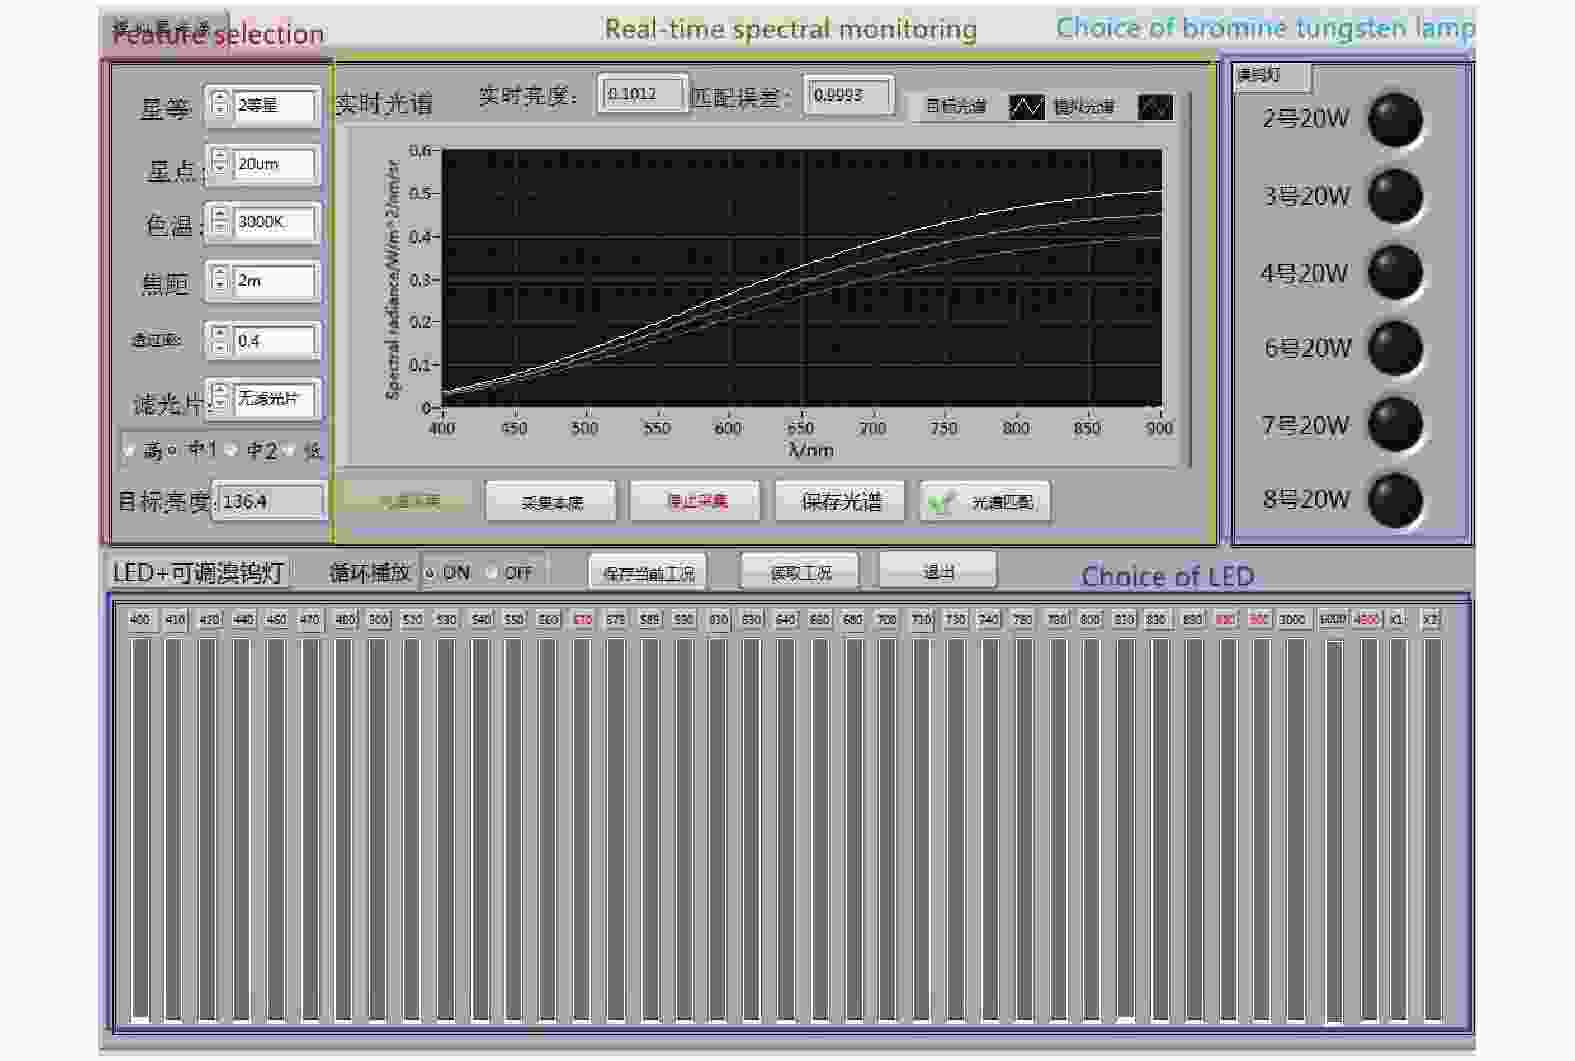
Figure 10. Software control interface

Figure 11. Spectral fitting curve of 5 500 K color temperature for 2nd magnitude sta
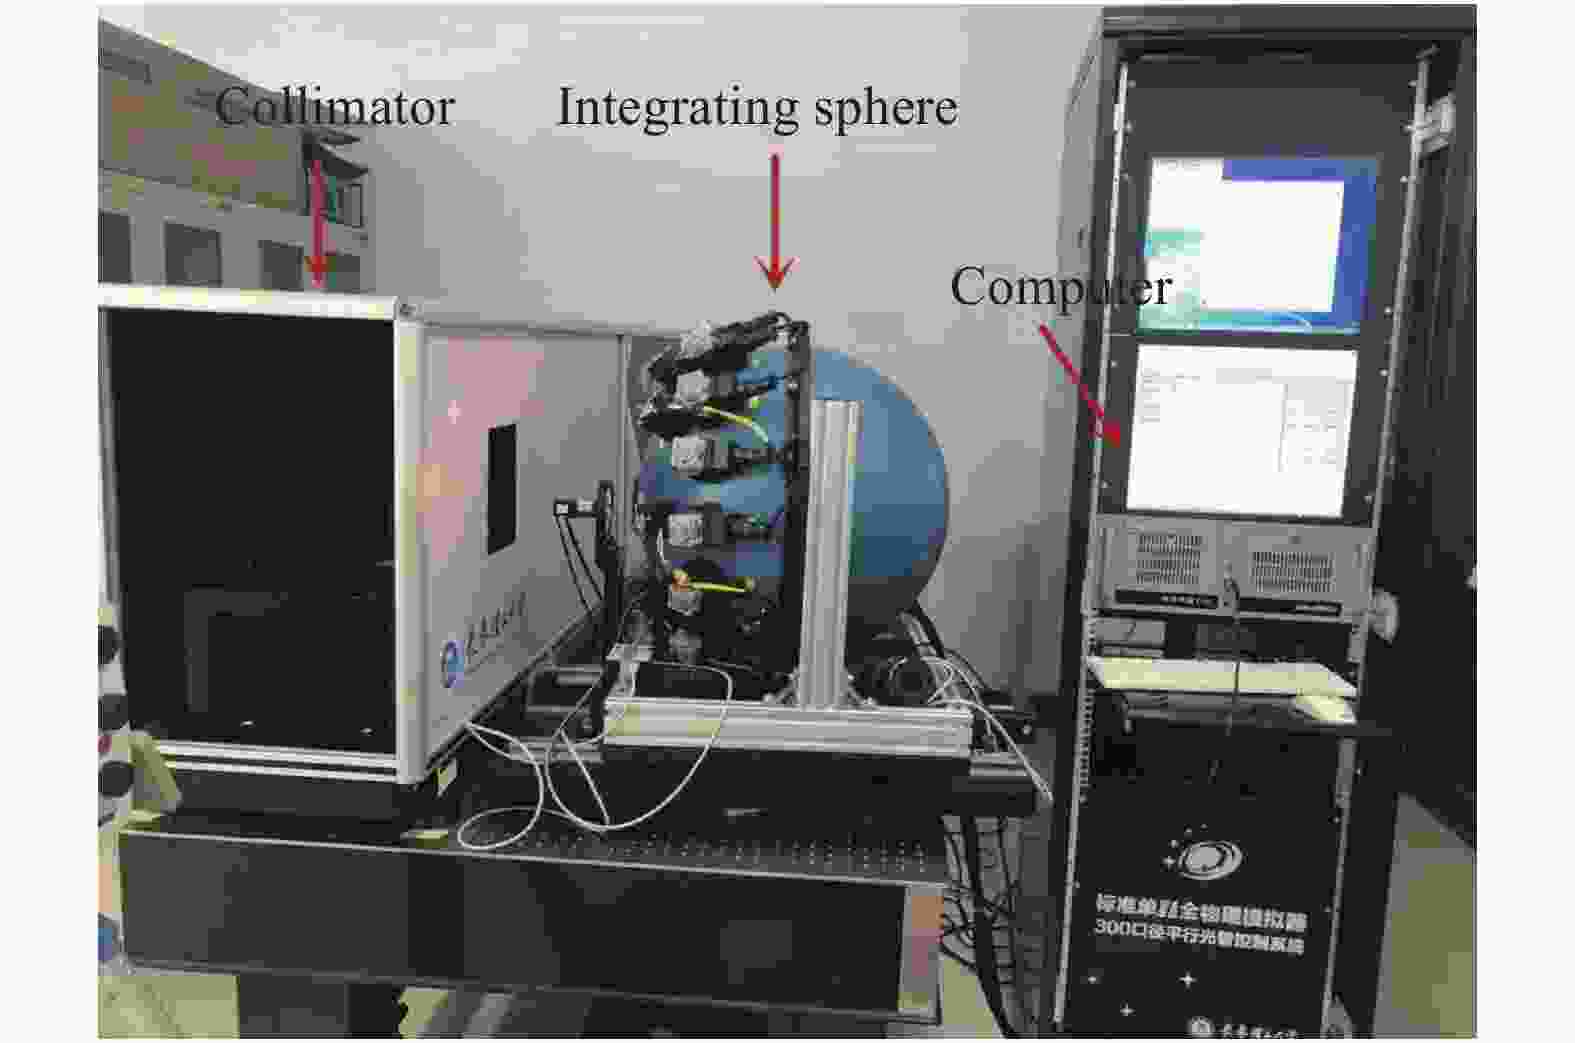
Figure 9. Experiment site of star simulator light source simulation
通过以上测试数据分析光谱匹配误差存在的原因主要有:
(1)光源系统的控制电路不稳定导致LED的色温改变,理论曲线和实际曲线存在偏差;
(2)由于LED和溴钨灯的制作材料、加工工艺的限制,导致光源的光谱曲线与理论曲线不一致。
Magnitude
color temperature+2Mi +3Mi +4Mi +5Mi +6Mi +7Mi +8.5Mi 3 000 K 2.40% 2.25% 2.53% 2.08% 2.17% 2.82% 3.87% 4 300 K 2.67% 2.95% 3.23% 3.56% 3.40% 3.98% 4.58% 5 500 K 3.51% 3.96% 4.54% 4.82% 5.40% 5.93% 6.14% 6 500 K 3.75% 4.11% 4.96% 4.87% 5.92% 6.23% 6.74% 7 600 K 3.65% 4.56% 5.03% 5.45% 6.33% 6.87% 7.10% 20 000 K 5.10% 5.90% 6.70% 8.10% 8.80% 9.60% 9.80% Table 4. Spectral matching error
-
星光光源模拟系统的星等模拟精度实验在暗室环境下,利用PR745光谱辐射亮度计测出不同色温不同星等的积分球出光口处的辐射亮度L实际,实际测得的数据如表5所示。实际的辐亮度与表2中的理论辐亮度进行对比,利用公式(15)计算出不同色温下相对星等模拟误差,如表6所示。
Color temperature
magnitude3 000 K/
W/(m2·sr)4 300 K/
W/(m2·sr)5 500 K/
W/(m2·sr)6 500 K/
W/(m2·sr)7 600 K/
W/(m2·sr)20 000 K/
W/(m2·sr)+2Mi 307.26 200.05 179.31 167.12 163.54 167.49 +3Mi 123.23 81.98 69.01 69.03 64.68 65.21 +4Mi 48.02 30.56 27.01 26.06 26.92 27.77 +5Mi 19.86 13.22 11.67 11.10 10.09 10.28 +6Mi 7.46 5.21 4.26 4.00 3.99 4.54 +7Mi 3.17 1.94 1.68 1.78 1.75 1.79 +8.5Mi 1.27 0.844 0.666 0.711 0.698 0.714 Table 5. Measured radiance
Color temperature
magnitude3 000 K/
W·(m2·sr)4 300 K/
W/(m2·sr)5 500 K/
W/(m2·sr)6 500 K/
W/(m2·sr)7 600 K/
W/(m2·sr)20 000 K/
W/(m2·sr)+2Mi 0.84% −0.97% 1.31% −1.11% −1.48% −1.47% +3Mi 1.00% 2.22% −1.97% 2.42% −2.15% −3.39% +4Mi −1.40% −4.2% −3.53% −2.76% 2.35% 3.23% +5Mi 2.37% 4.09% 4.20% 3.74% −3.90% −3.93% +6Mi −3.24% 2.96% −4.05% 4.25% 4.17% 4.26% +7Mi 3.26% −3.48% −5.08% 5.33% 5.42% 5.29% +8.5Mi 4.10% 5.24% −5.40% 5.49% 5.76% 5.78% Table 6. Magnitude simulation accuracy
星等模拟误差存在的原因主要有:
(1)弱星等的亮度低,探测器对微弱的光响应低,则星等的模拟精度低;
(2)由于工艺的原因导致积分球的内径存在加工误差,使得积分球实际的内球径小于250 mm,则实际测得的积分球出口处的辐射亮度高于理论值;
(3)随着LED的使用时间增加,导致LED结温增加,电光转换效率降低,输出的光辐射亮度小于理论值。
-
在暗室环境下星光光源连续工作6 h (9:00~15:00),将光源调至+5等星20 000 K的模式下,利用光谱辐射亮度计每隔1 h对出积分球出光口处辐射亮度进行一次记录,其测试结果如表7所示。稳定性计算方式为:
通过公式(16)星光光源连续工作6 h后,Lmax=11.01,Laverg=
$\displaystyle\sum $ Li/6=10.85,则稳定性Ʌ=1.47%,满足系统的设计要求。表7 为连续工作6 h的辐射亮度。Time Radiation brightness /W/(m2·sr) 9:00 10.73 10:00 10.88 11:00 11.01 12:00 10.91 13:00 10.75 14:00 10.84 Table 7. Radiance after 6 hours of continuous work
-
该星光模拟技术以溴钨灯作为基底光源,多种单色LED作为补偿光源,利用积分球的匀光特性,实现了一种多色温多星等的星光光源模拟。将量子行为粒子群算法作为光谱匹配算法,实现了400~900 nm波长范围内,色温3 000、4 300、5 500、6 500、7 600、20 000 K的模拟,星等+2~+8.5Mi可调,色温匹配误差优于±10%,星等匹配误差优于±6%,系统稳定性优于1.5%。
Study on simulation technology of multi-color temperature and multi-magnitude starlight source
doi: 10.3788/IRLA20210053
- Received Date: 2021-04-10
- Rev Recd Date: 2021-05-11
- Publish Date: 2021-08-25
-
Key words:
- star simulator /
- color temperature /
- magnitude /
- integrating sphere /
- quantum behavior particle swarm algorithm
Abstract: The star simulator was designed to simulate the physical characteristics of real stars. Due to the different color temperatures and magnitudes of different stars, in order to simulate stars more realistically, a starlight source simulation system was required to achieve large-scale high-precision adjustment of color temperature and magnitude. The system consisted of an integrating sphere, light source module, control module and fiber spectrometer to form a closed-loop light source simulation system. In order to ensure the uniformity of the emitted light, a bromotungsten lamp and a variety of monochromatic LED mixed light were used as the light source, and the output brightness of the LED was controlled by constant current driving. The quantum behavior particle swarm algorithm was introduced as the spectrum matching algorithm to solve the LED coefficient ai. As the number of iterations increases, and the value of the fitness function reached the minimum, the simulation error of color temperature and magnitude became smaller. Experimental verification: The range of color temperature was 3 000, 4 300, 5 500, 6 500, 7 600, 20 000 K, the color temperature matching error was better than ±10%; the range of simulated magnitude was +2-+8.5 Mi, and the magnitude matching error was better than ±6%.


 DownLoad: