


HTML
-
位移测量是现代工业诸多领域不可缺少的关键技术,在机器人、数控加工、光刻机等高端制造领域中,位移测量结果作为控制系统的输入信息,其精确度会影响控制系统的整体精度。常用的位移测量传感器有霍尔传感器、电容传感器、电涡流传感器等。计算机视觉技术的不断发展,使得基于图像传感器进行位移测量这种非接触测量方法[1–4]被越来越多的国内外学者关注。
目前,常见的利用图像实现位移测量的方法可以归纳为基于模式的方法。该类方法首先识别待测目标上带有的明显的图形特征,常见的有长方形、圆形等几何特征[5]、图像特征点[6]。或者识别图形参数,常见的图形参数有一个图像区域的灰度值[7],图像熵等[8]。通过图形参数特征在空间随位移变化的规律,使用数字相关法[9]、对极几何法[10]等典型方法求解位移。这种方法首先需要模式识别,然后提取特征参数并对参数随位移变化建模,最后求解位移,这些步骤的串行叠加造成误差累积以及测量精度损失。其他方法如连续拍摄光干涉生成的条纹图像,使用相移法[11]等方法求解相位场,进而求解位移,同样无法避免图像采集系统的成像畸变和较高的噪声水平对后续步骤的巨大影响。
利用图像传感器单元阵列进行直线位移测量的方法[12]充分使用了丰富的图像传感器信息,建立了图像传感器单元阵列检测信号(成像灰度值向量)和位移值之间的映射关系,即测量模型。通过顺序求解法[13-14]从阵列检测信号中求解位移值。由于利用连续性原理带来迭代次数少的特点,该方法计算量小,且没有累积误差,可以达到很高的数值精度,一定程度上实现了实时性、大行程和测量精度之间的平衡。该方法的最终测量精度取决于模型精度以及图像传感器的噪声水平,因此建模精度至关重要。
基于图像的位移测量普遍都会面临光照不均匀,相机成像系统畸变[15]等因素干扰导致图像畸变的问题。文中针对参考文献[12]开展模型改进研究,结合靶标标称设计的周期性以及制造与灰度成像过程的畸变,采用Fourier级数与多项式逼近的方式建立模型类,从而实现模型精度的显著提高,进而提高实时测量精度。
-
基于成像灰度的位移测量原理系统如图1所示。经过精心设计的固定不动长方形直线靶标图像仅沿
${x_{\rm{w}}}$ 方向的灰度分布规律$F({x_{\rm{w}}})$ 设计为:
Figure 1. Schematic diagram of measurement principle
式中:
${x_{\rm{w}}}$ 为靶标上的世界坐标;${Y_{\rm{w}}}$ 为${x_{\rm{w}}}$ 位置靶标原始灰度值;${A_{\rm{w}}}$ 、${D_{\rm{w}}}$ 、${\tau _{\rm{w}}}$ 、$\varphi $ 分别为靶标的灰度振幅、灰度偏置、靶标标称周期以及初始相位。工业相机安装在运动对象上,沿${x_{\rm{w}}}$ 方向运动,相机中一列平行于${x_{\rm{w}}}$ 轴方向排列的图像传感器单元对靶标进行成像,并输出灰度值向量。在这列图像传感器单元上建立像素坐标系,用符号$u$ 表示,一个像素即指一个图像传感器单元。不失一般性,设k时刻,像素坐标$u = 0$ 的图像传感器单元所敏感的靶标对应位置为待测对象的位移${x_k}$ ;另记相邻两个图像传感器单元中心间距为d,则相邻两个图像传感器单元所敏感的靶标对应位置的间距为$\alpha \cdot d$ ,其中$\alpha $ 为相机成像系统的放大倍数。各图像传感器单元所敏感的靶标对应位置符合公式(2):成像灰度值与靶标原始灰度值之间相差一个未知的比例常数K。结合公式(2),在上述坐标系下,像素坐标为u的图像传感器单元在k时刻的成像灰度值
${Y_{k,u}}$ 表示为:式中:
$A$ 、$D$ 分别为成像灰度值分布规律的灰度振幅和灰度偏置;${F^{(u)}}\left( {{x_k}} \right)$ 为像素坐标为$u$ 的图像传感器单元随位移${x_k}$ 的成像灰度值分布规律;${\varepsilon _{k,u}}$ 为相应测量噪声。成像灰度模型${{F}}\left( {{{c}},{x_k}} \right)$ 表示为矩阵函数:式中:
${{{Y}}_{{k}}}$ 为图像传感器单元阵列的成像灰度值向量,它是一个n维列向量,n等于图像传感器单元数目;${{c}}$ 为模型中待标定的常系数组成的向量${{c}} = {\left[ {A,{\tau _{\rm{w}}},\alpha ,\varphi ,D} \right]^{\rm{T}}}$ ,其标定方法在下文中介绍;${{\boldsymbol{\varepsilon }}_k}$ 为图像传感器单元阵列的测量噪声。根据${{{Y}}_k}$ ,以及标定后的公式(4),通过顺序求解法[13-14]可连续求解位移${x_k}$ ,实验验证了该方法的可行性[12]。公式(4)考虑的是理想情况,但实际测量过程中,靶标制作、设备安装、光照等过程均会不可避免地引入非线性变化,造成成像灰度值分布偏离期望的理想正弦规律分布,文中称之为灰度畸变。此时,再采用理想模型解算位移,将带来解算误差,参考文献[12]中的研究表明了这种由于畸变带来的位移测量误差可达数十微米。针对这样的问题,文中构建合理模型类对该畸变进行逼近改进建模,进而达到利用改进模型提高位移测量精度之目的。
-
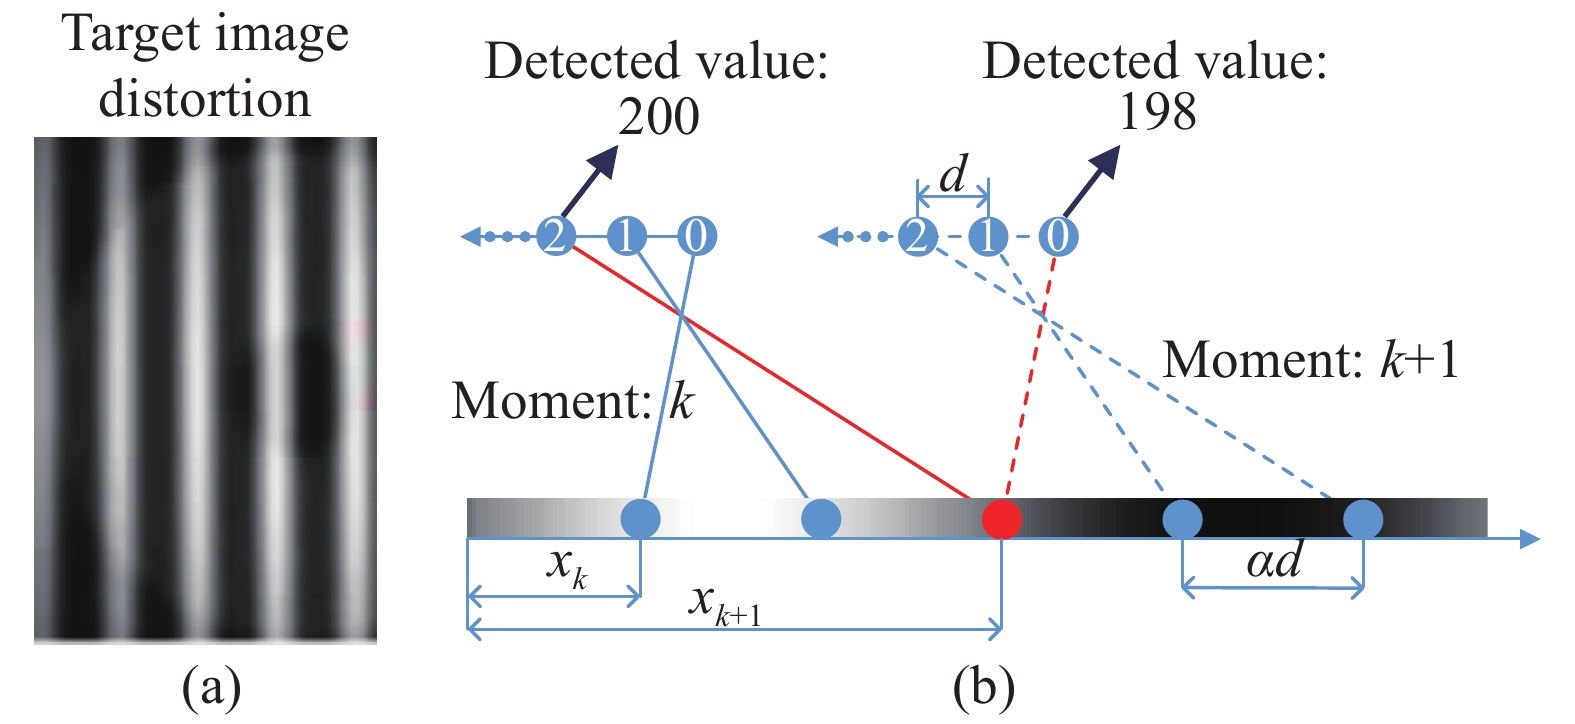
考虑到靶标制作过程的误差导致靶标图像原始灰度值发生变化,成像过程中的光照不均匀、相机成像系统畸变、相机运动方向与靶标灰度分布方向不平行等等因素最终导致各个图像传感器单元成像灰度分布规律偏离期望的正弦规律
$\mathop {{F^{(u)}}}\limits^ \sim ({x_k})$ ,文中称为靶标图像畸变,如图2(a)所示,相机成像后,图像出现很明显的不均匀现象。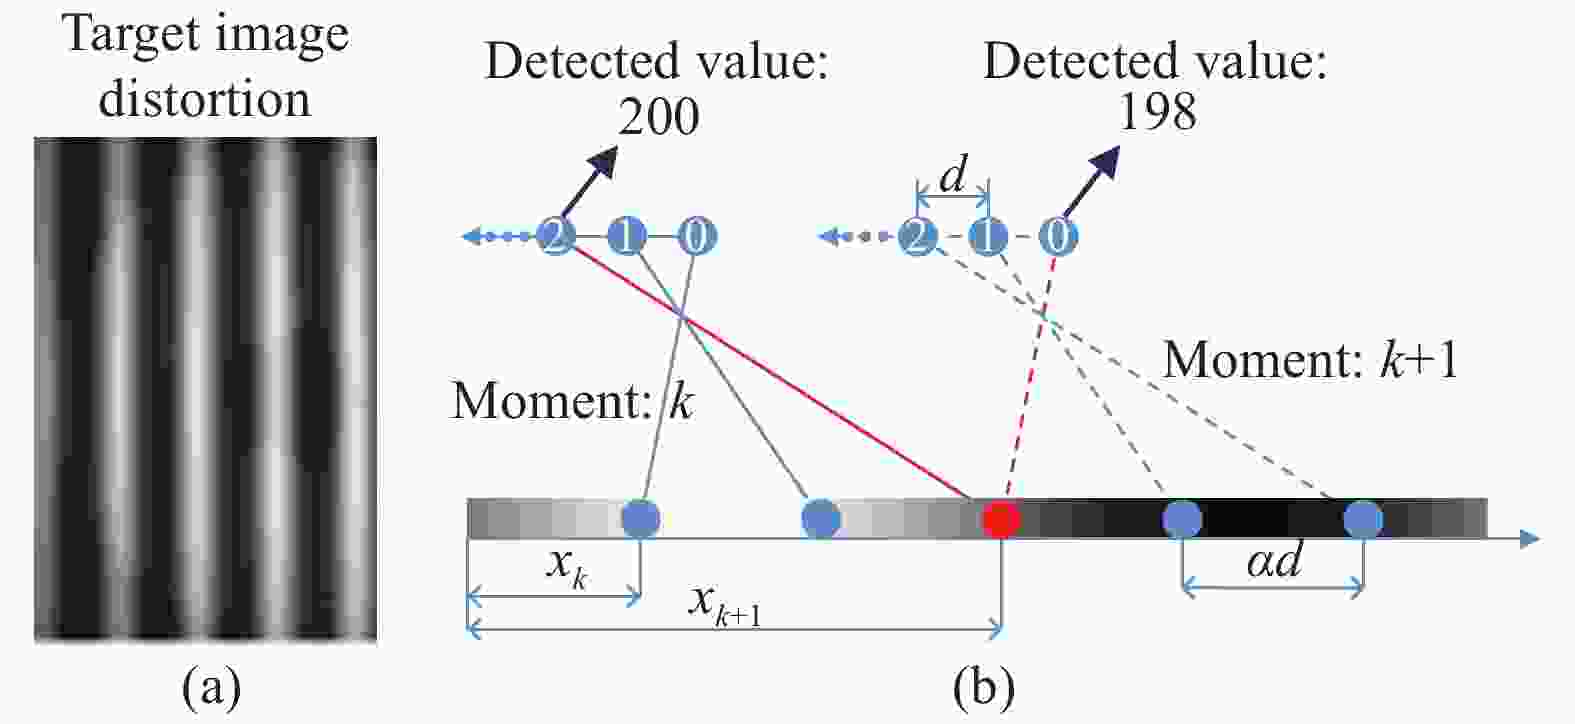
Figure 2. Two main factors affecting the measurement model. (a) Target image distortion; (b) Inconsistencies between image sensors unit
这类影响可以理解为理想成像灰度分布被一个未知的畸变函数干扰,数学描述表示为:
式中:
$\mathop {{F^{(u)}}}\limits^ \sim ({x_k})$ 为成像灰度值的实际分布规律;$c\left( {{x_k}} \right)$ 为一未知的畸变函数,$\left[ {c\left( {{x_k}} \right) - 1} \right]{F^{(u)}}\left( {{x_k}} \right)$ 为模型误差项,所以实际分布是理想分布$\mathop {{F^{(u)}}}\limits^ \sim ({x_k})$ 叠加一个与正弦函数性质有关的模型误差项。因此考虑引入Fourier级数补偿这部分模型误差,如公式(6)所示:若仅使用单个图像传感器单元进行测量,仅需考虑上述靶标图像畸变的影响,而使用多个图像传感器单元组成的阵列进行测量时,则需要考虑图像传感器单元之间的不一致性。如图2(b)所示,k时刻像素坐标
$u = 2$ 的图像传感器单元的成像灰度值$\mathop {{F^{(2)}}}\limits^\sim \left( {{x_k}} \right){\rm{ = }}200$ ,k+1时刻像素坐标$u = 0$ 的图像传感器单元在靶标相同位置的成像灰度值$\mathop {{F^{(0)}}}\limits^\sim \left( {{x_{k{\rm{ + }}1}}} \right){\rm{ = 198}}$ ,可见对靶标上相同的世界坐标${x_{\rm{w}}}$ 位置,不同的图像传感器单元的成像灰度值因自身光电转换等因素的细微区别而有些许差异。由公式(2)将公式(6)等价表示为:可见式中
${x_{\rm{w}}}$ 相同时,成像灰度值便确定,不因像素坐标$u$ 的变化而变化,因此公式(6)不能描述上述的图像传感器单元之间的不一致现象。图像传感器单元之间的不一致与前述的靶标图像畸变因素不同,它来自各图像传感器单元,因而与像素坐标
$u$ 直接相关,与图像传感器单元所敏感的靶标位置无关。因此$\mathop {{F^{(u)}}}\limits^ \sim ({x_{\rm{w}}})$ 的规律不仅取决于${x_{\rm{w}}}$ ,也取决于像素坐标值u。公式(7)中的系数${a_i},{b_i},B$ 应随着像素坐标u变化,它们是关于u的函数,使用一组高阶多项式对其进行逼近,如公式(8)~(10)所示:结合公式(2)和公式(7)~(10)得校正后各图像传感器单元在k时刻的成像灰度值为:
结合公式(4)便可得校正后的测量模型。
-
实际测量时的工况会影响设计的靶标图像参数,为了获得准确的模型参数,测量前在测量行程内采集若干组
$({x_k},u,{Y_{k,u}})$ 数据,${Y_{k,u}}$ 为各图像传感器单元在不同时刻下的成像灰度值,采用LM算法求解其中的模型参数${{c}}$ 。由于图像传感器单元阵列存在随机噪声${{{\varepsilon }}_k}$ ,为了更好地观察模型校正的效果,使用滤波核大小为$1 \times 3$ 的高斯低通滤波以排除随机噪声的影响,公式(11)中模型的Fourier级数阶次M=5,使用100个图像传感器单元构成的直线阵列进行测量。参数标定过程可表示为:式中:j为迭代次数; $ \alpha$ 、$\lambda $ 为迭代初值;${{{Y}}_k} = [ {Y_{k,0}},{Y_{k,1}}, \cdots , $ $ {Y_{k,99}} ]^{\rm{T}}$ ,${{J}}\left( {{{{c}}_j}} \right) = {\left. {\dfrac{{\partial {{F}}({{c}},{x_k})}}{{\partial {{c}}}}} \right|_{{{c}} = {{{c}}_j}}}$ 。多次迭代后模型参数收敛至最优值。 -
连续运动过程中,阵列检测信号连续,使用公式(13)所示的顺序求解法[13-14]可以根据当前时刻的阵列检测信号
${{{Y}}_{{k}}}$ 以及上一时刻的位移${x_{k - 1}}$ ,迭代求解出当前时刻的位移${x_k}$ 。前人的工作已经充分证明该求解方法具有很高的求解精度和实时性。式中:
${{J}}\left( {{x_k}} \right)$ 为模型在${x_k}$ 处的雅可比矩阵,直线位移测量中使用一列图像传感器单元,因此雅可比矩阵退化为列向量;${{c}}$ 为模型中待标定的模型参数;j为迭代次数,通常迭代3~5次收敛。 -
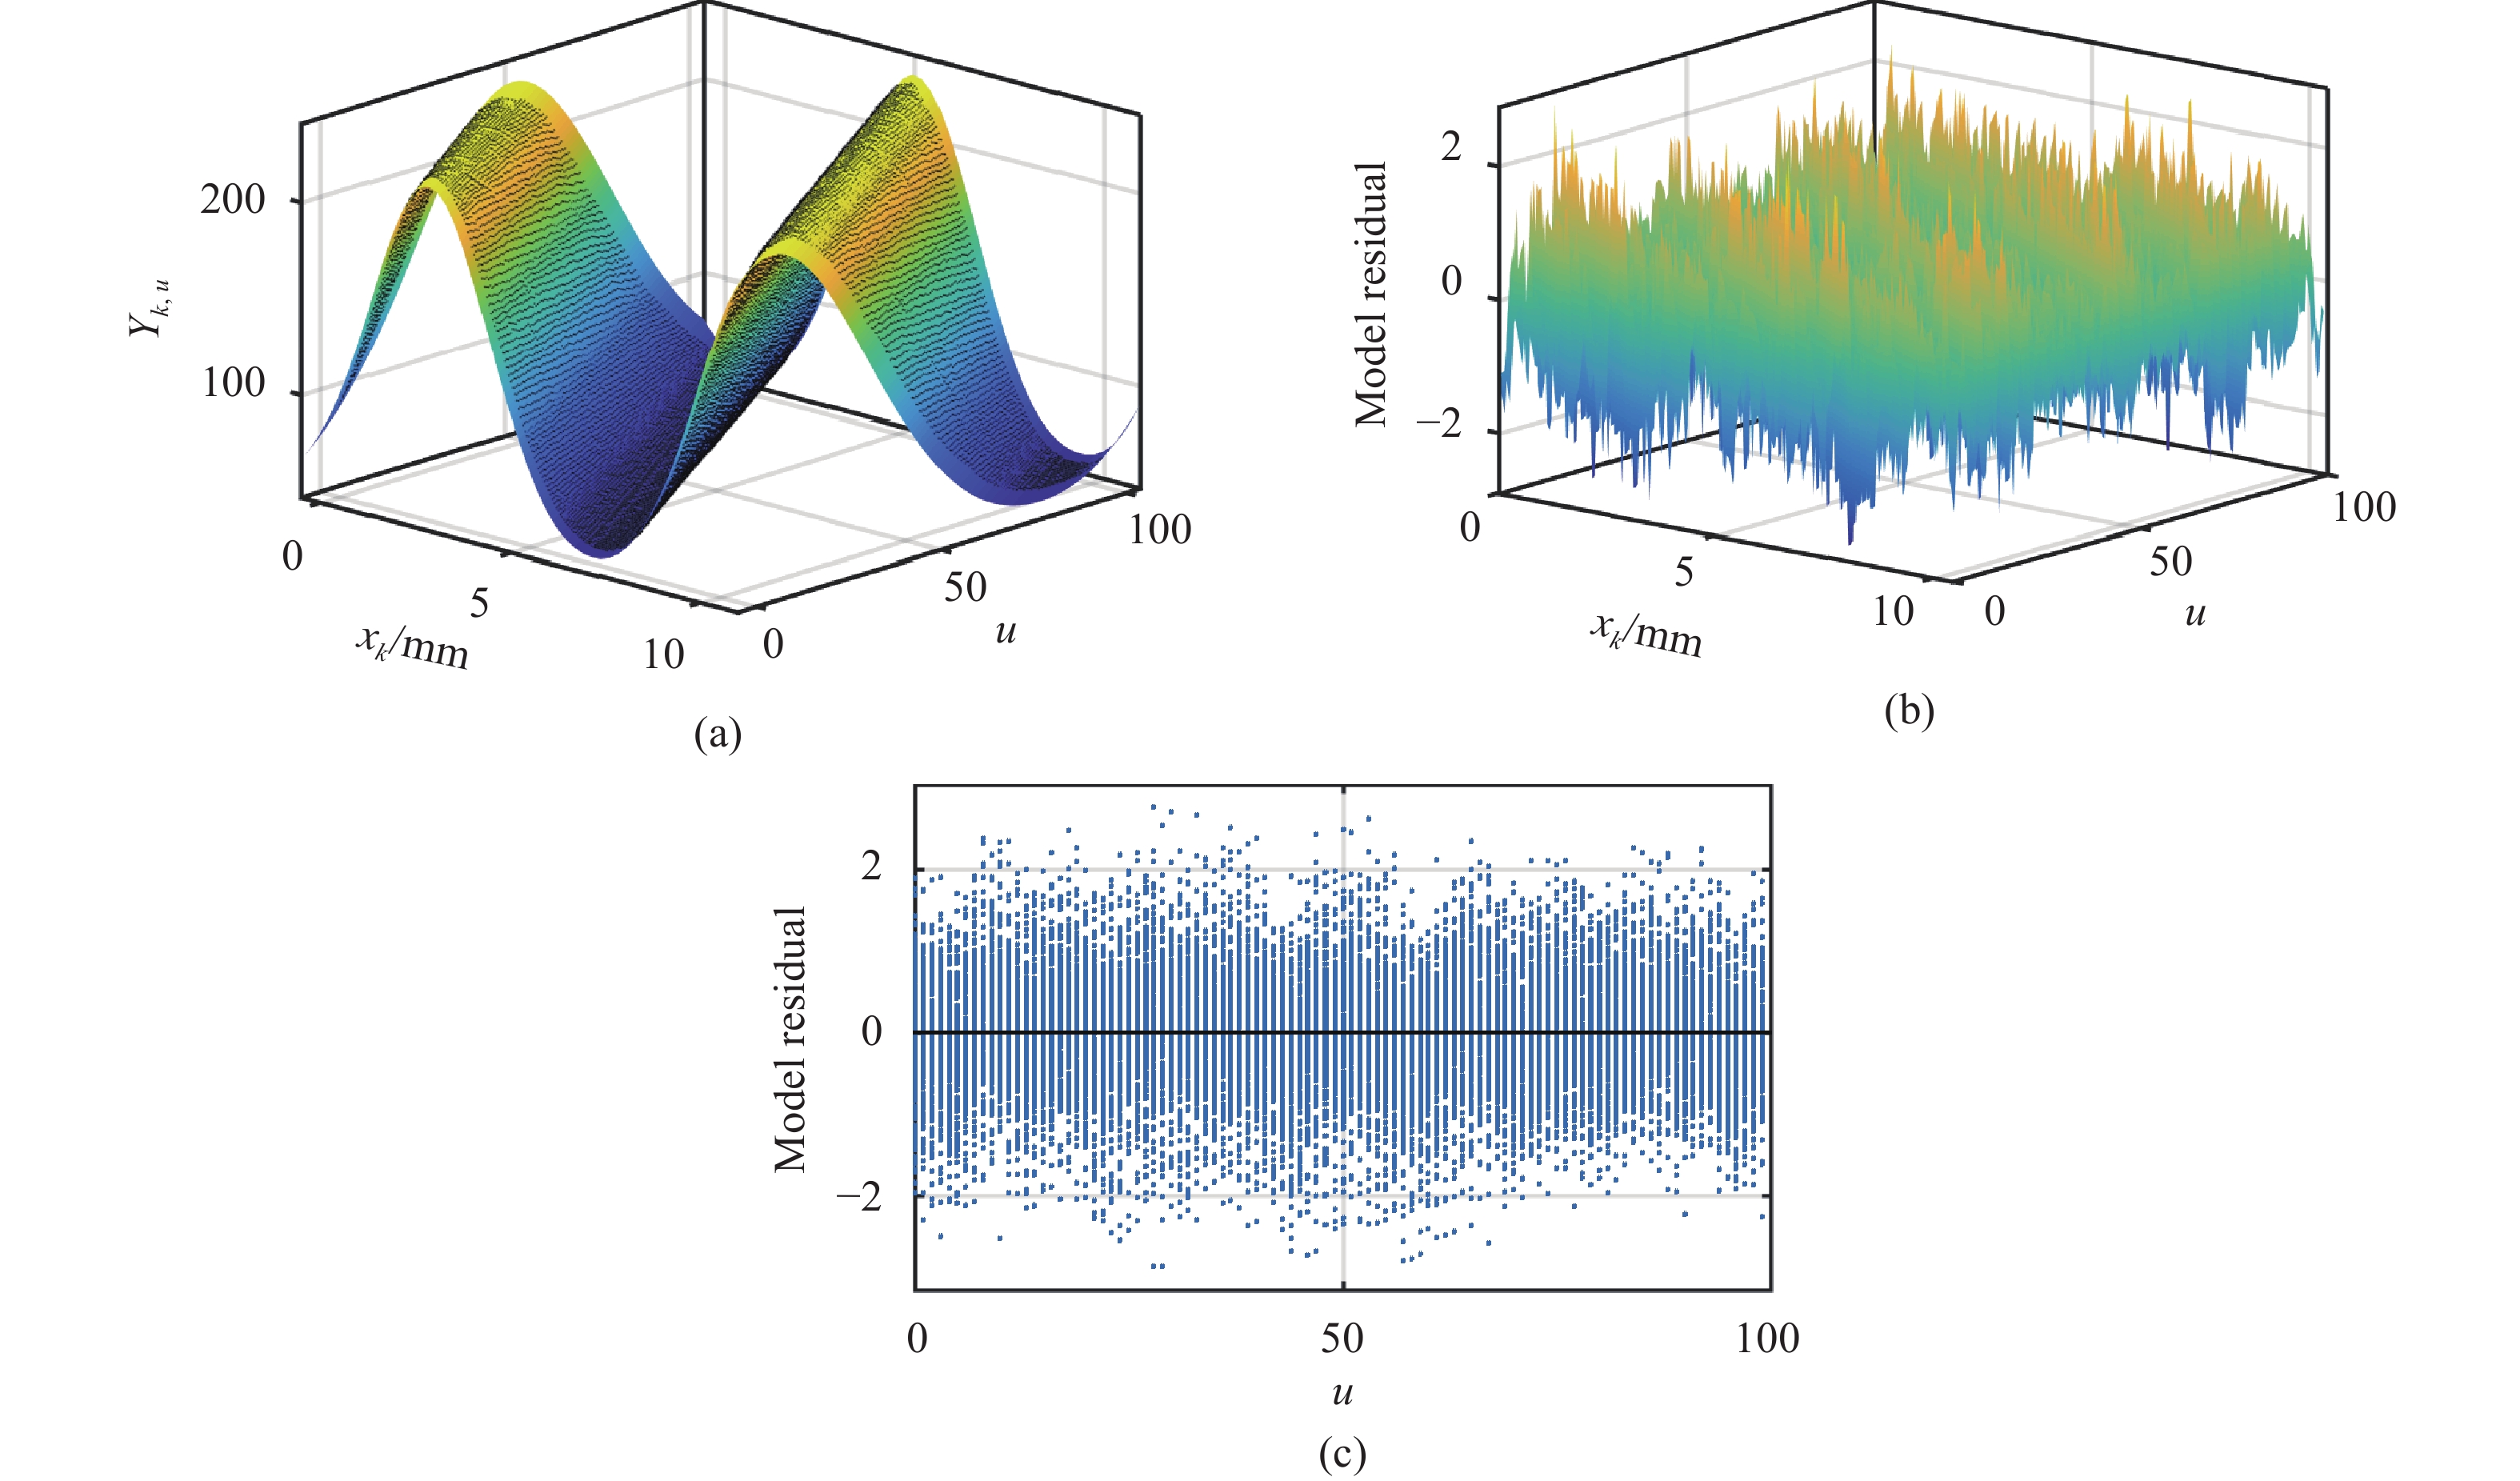
使用校正前的理想正弦模型的参数标定结果如表1所示,使用校正后的模型的参数辨识结果如表2所示。图3为使用校正前的理想正弦模型的标定结果,其中的点为采集的若干不同位移、不同图像传感器单元的成像灰度值
${Y_{k,u}}$ ,曲面为模型参数标定后得到的模型分布,如图3(a)所示。${Y_{k,u}}$ 与标定到的模型在对应$({x_k},u)$ 坐标位置的差值称为该位置的模型残差${r_{k,u}} = {Y_{k,u}} - {F^{(u)}}({x_k})$ ,各坐标位置的模型残差分布如图3(b)所示,可见在模型的波峰与波谷位置存在很大的模型残差,使用均方根误差(Root Mean Square Error,RMSE)来评价建模的精确程度,其值越小,建模越精确,所有位置的模型残差数据的均方根误差RMSE=7.824 8。将模型残差分布图旋转至图3(c)所示的右视图可以看到各图像传感器单元在整个测量行程内的残差值分布区间范围很不一致,这说明图像传感器单元之间有明显的不一致。Parameter Value Parameter Value A 79.59 ${\tau _{\rm{w}}}$ 8.667 B 123.8 $\varphi $ 0.6262 Table 1. Results of model parameter identification before model correction
Parameter Value Parameter Value Parameter Value ${a_{10}}$ 81 ${a_{43}}$ 1.323e-06 ${b_{32}}$ −0.0002089 ${a_{11}}$ 0.04654 ${a_{50}}$ −0.2038 ${b_{33}}$ 1.421e-06 ${a_{12}}$ −0.0002637 ${a_{51}}$ −7.2e-05 ${b_{40}}$ 0.08277 ${a_{13}}$ 9.085e-07 ${a_{52}}$ 0.0001074 ${b_{41}}$ 0.004726 ${a_{20}}$ −6.692 ${a_{53}}$ −8.738e-07 ${b_{42}}$ −3.146e-05 ${a_{21}}$ 0.01142 ${b_{10}}$ −24.01 ${b_{43}}$ 1.808e-07 ${a_{22}}$ 1.84e-06 ${b_{11}}$ 0.04984 ${b_{50}}$ 0.301 ${a_{23}}$ −2.256e-07 ${b_{12}}$ −0.0002796 ${b_{51}}$ 0.003075 ${a_{30}}$ −0.6056 ${b_{13}}$ 1.659e-06 ${b_{52}}$ −0.0001482 ${a_{31}}$ −0.001703 ${b_{20}}$ −9.865 ${b_{53}}$ 1.122e-06 ${a_{32}}$ −1.555e-05 ${b_{21}}$ −0.01589 ${B_0}$ 129.2 ${a_{33}}$ 2.462e-07 ${b_{22}}$ 0.000121 ${B_1}$ 0.04099 ${a_{40}}$ −0.1802 ${b_{23}}$ −4.206e-07 ${B_2}$ −0.0004571 ${a_{41}}$ 0.006175 ${b_{30}}$ 0.5337 ${B_3}$ 2.644e-06 ${a_{42}}$ −0.0001946 ${b_{31}}$ 0.004793 ${\tau _{\rm{w}}}$/mm 8.62 Table 2. Results of model parameter identification after model correction

Figure 3. Model identification results before calibration. (a) The result of least square fitting; (b) Residual distribution of model; (c) Right view of the model residual distribution
模型校正后的标定结果如图4(a)所示,可见标定的模型很好地拟合了采集的数据。模型残差分布图4(b)所示各位置的模型残差基本在两个灰阶范围以内。模型残差数据的均方根误差
${\rm{RMSE}} = 0.713\;0$ ,建模精度相比校正前有显著提升。图4(c)所示各图像传感器单元在测量行程内的模型残差值分布范围之间差别很小,因此该校正方法对图像传感器单元之间的不一致性有明显的校正效果。
Figure 4. Model identification results after calibration. (a) The result of least square fitting; (b) Residual distribution of model; (c) Right view of the model residual distribution
实验中初始位移
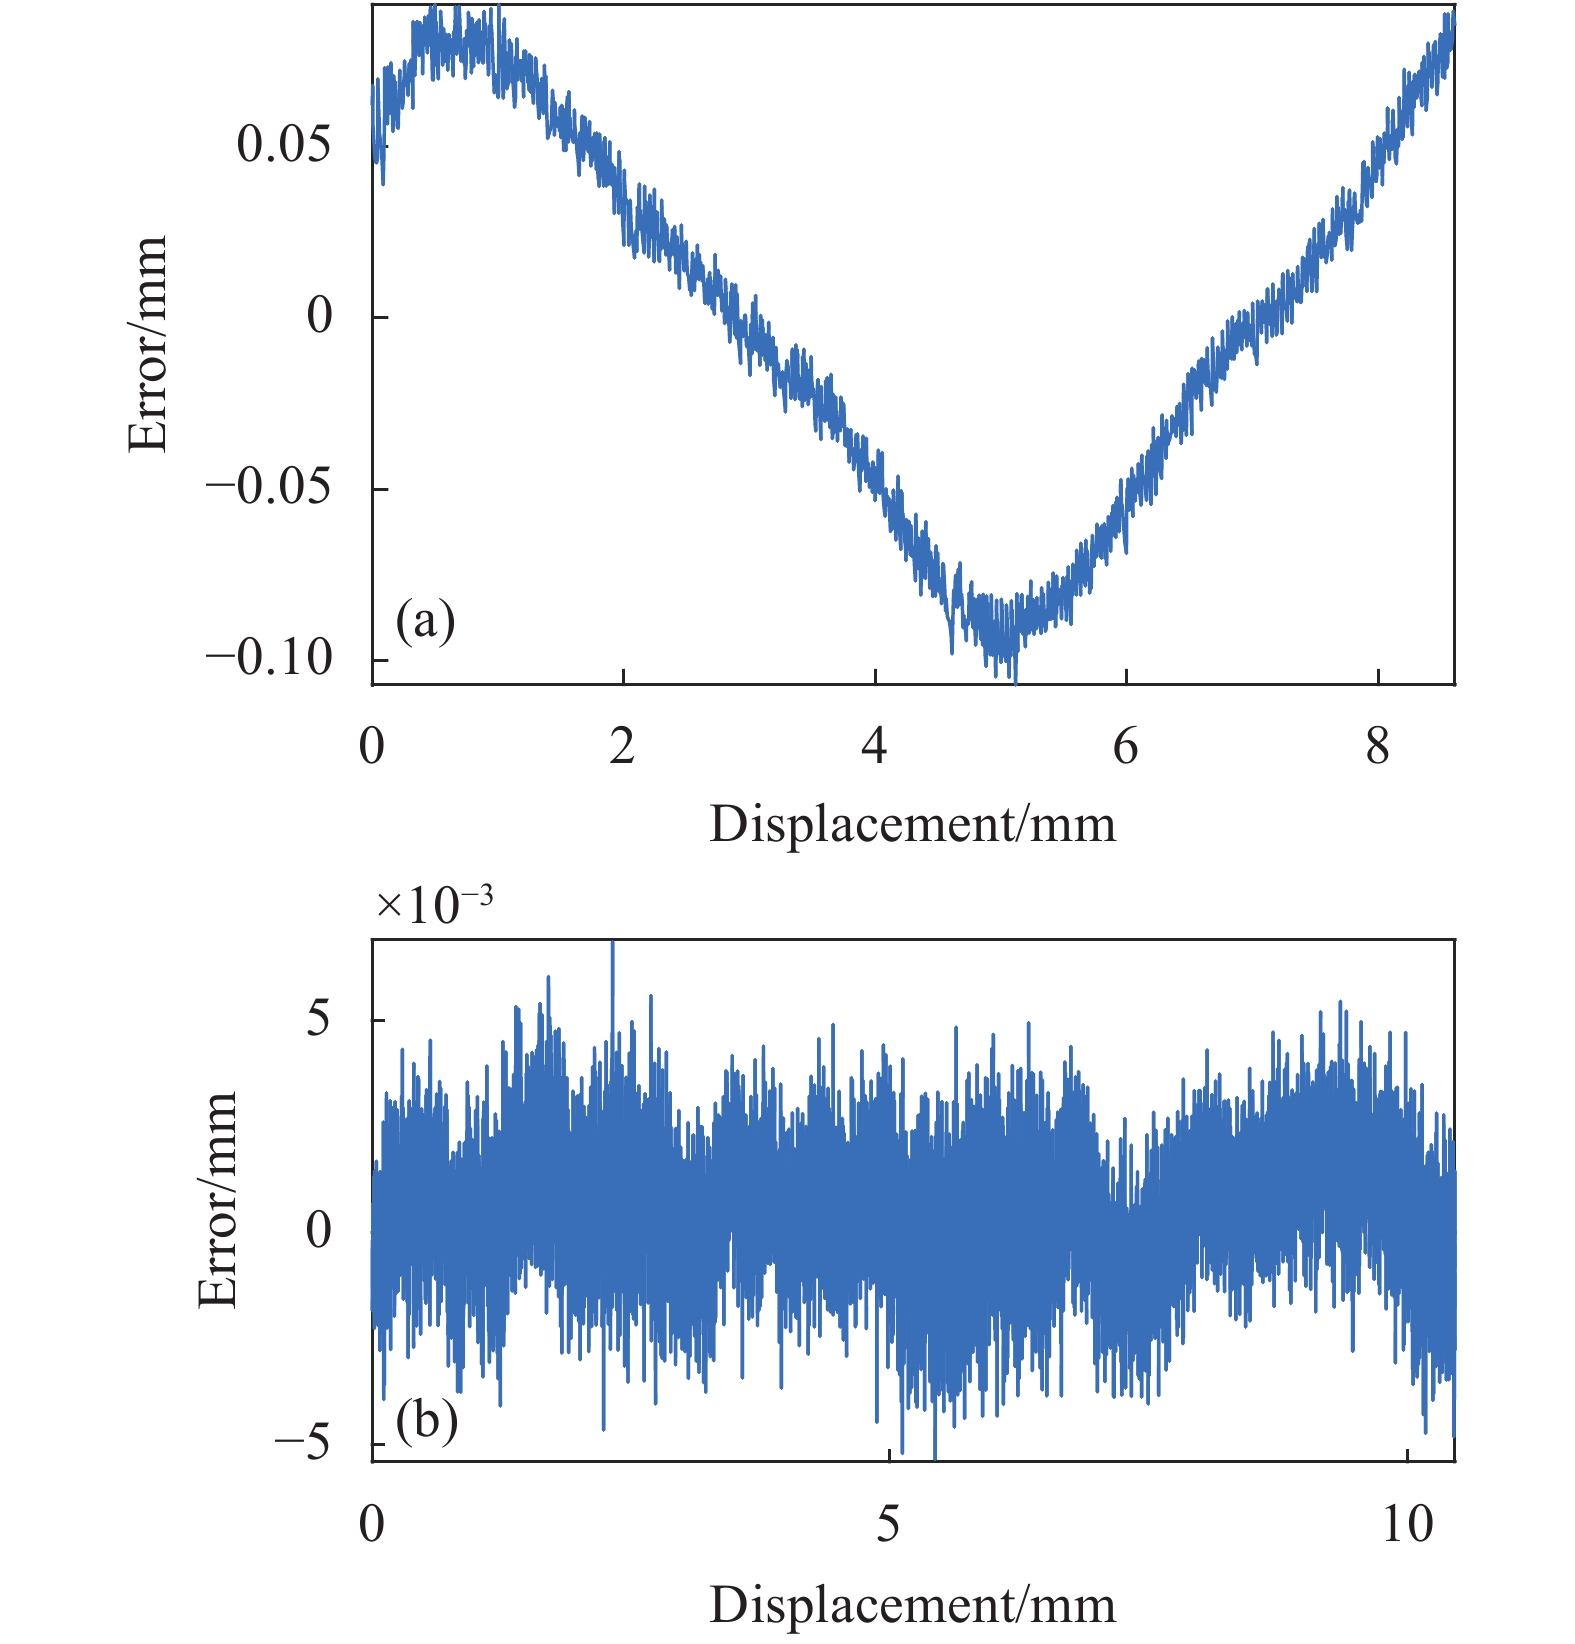
${x_0} = 0$ ,测量误差与位移的关系如图5所示,其中横坐标位移值由光栅尺实时测得,纵坐标为文中测量方法测得的位移值与光栅尺测量值之间的差值。图5(a)所示为使用理想正弦模型进行位移测量时,在模型的波峰与波谷,测量误差周期性的出现峰值,测量误差均值为−0.0011 mm,标准差为0.0564 mm。图5(b)所示为模型校正后的测量误差均值为${\rm{4}}{\rm{.9433e - 04\;mm}}$ ,标准差为0.0015 mm,位移测量精度得到显著提高。
Figure 5. Measurement results. (a) Measurement results before model correction; (b) Measurement results after model correction
-
图像传感器单元的数目增加会使测量信息更充分,降低测量误差。图6所示为前期仿真使用维度不同的传感器单元阵列进行测量的测量误差标准差,可见当图像传感器单元的数目增加到一定程度时,多出的图像传感器单元能给测量精度带来的增益很小,而大量的测量信息会增加计算量,不利于测量的实时性。因此实验中采用了100个图像传感器单元的信息。
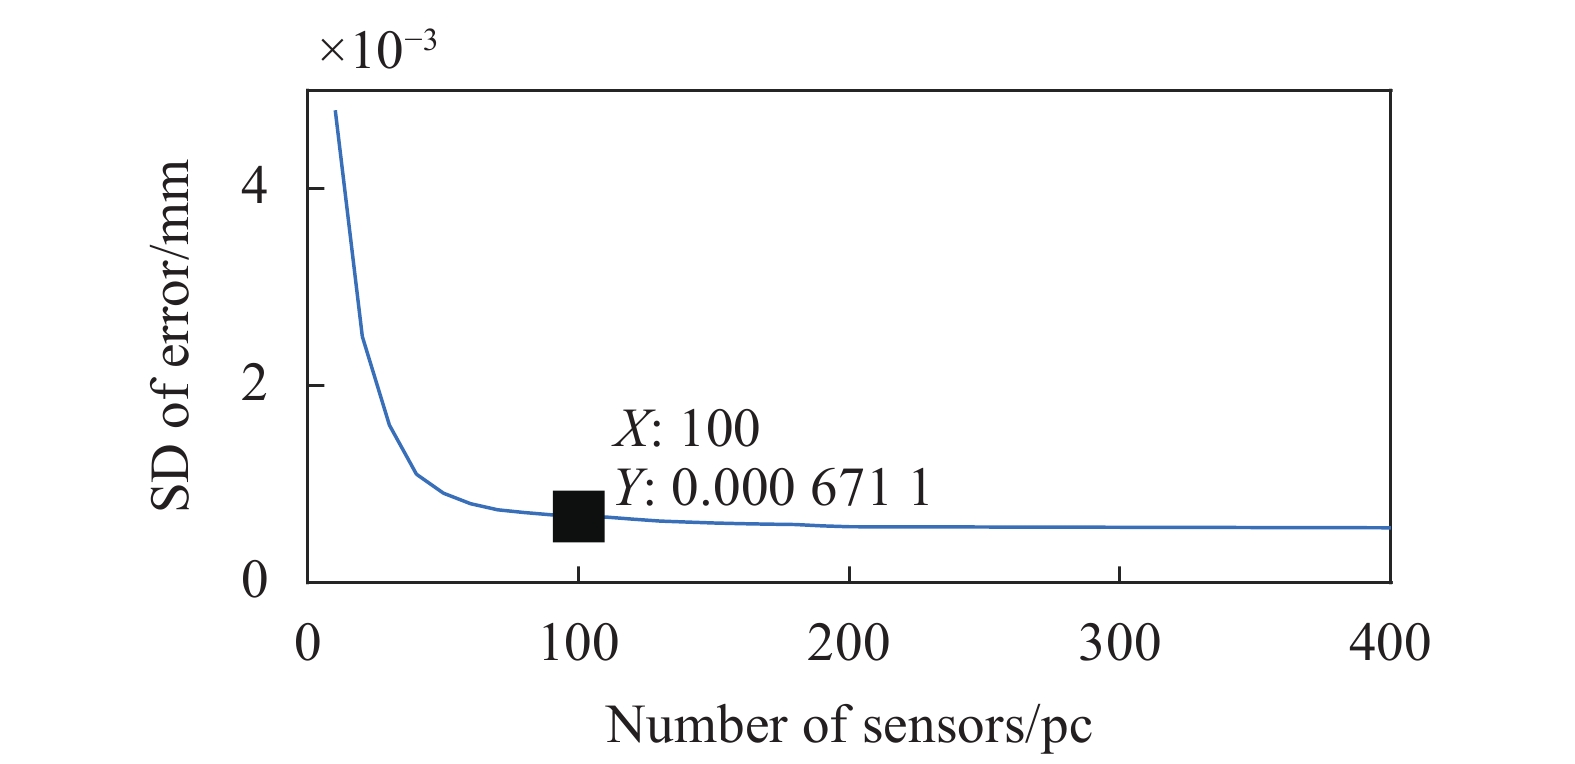
Figure 6. Relationship between the number of sensor unit and the standard deviation of measurement error
除了建模误差之外,图像的灰度噪声水平同样会影响模型的准确性和测量精度,如何针对实际测量情况下的成像灰度值进行针对性的滤波并与现有模型结合,有待进一步的研究。
-
针对使用图像传感器单元阵列进行位移测量时,靶标图像畸变、图像传感器单元之间的不一致等因素导致的灰度畸变问题,设计了一种Fourier级数和多项式结合的模型类对测量模型进行改进。它的主要优点是设计的模型类对实际测量模型逼近精度高,对各图像传感器单元不一致的校正效果好,且避开了实验中的繁琐的传感器标定过程,为校正实际测量过程中引入的模型误差提供了一种有效的方法。与0.5 µm分辨率的光栅尺测量结果相比,模型校正前的测量误差标准差为56.4 μm,模型校正后,在10.46 mm测量行程下的实时测量误差标准差仅为1.5 μm。
该方法硬件上仅使用一个常规量测相机和普通冲印的靶标图像,测量成本低,具有较好的工业应用前景。通过对测量模型的校正来实现测量精度的大量提高,减小了硬件因素对测量精度的限制,为使用多个传感器单元进行测量的场景下的模型优化提供了一种可行的思路。此外,求解位移采用的顺序求解法计算量小,保证了测量的实时性。


 DownLoad: