


-
在大型设备的运转中,关键构件中经常出现形式多样的裂纹,如钢轨的滚动接触疲劳裂纹[1]、压力管道的应力腐蚀裂纹[2]等。构件内裂纹在设备的使用过程中会不断扩展,当裂纹扩展到快速发展阶段极易引发设备构件的脆性断裂,危害人员生命和造成经济损失[3]。因此,采取有效的方法对设备裂纹的检测与识别是非常必要的。
超声红外热成像(振动热成像)检测技术作为新型裂纹检测方法被广泛关注。其理论研究、数学模型的推导以及检测可行性的验证已相对成熟。超声红外热图像处理方法的研究也成为近年来的热点。参考文献[4]提出的方法有效地滤除了图像噪声,实现了分割目标缺陷区域;参考文献[5]提出了基于小波变换的超声红外热图像处理方法,有效提高了红外图像的对比度与信噪比;参考文献[6]指出超声红外热成像作为一种用于非自热物体质量评价和安全保证的无损检测方法,其未来发展趋势必定是通过引入人工智能方法来快速、可靠和智能地进行检测。深度学习的飞速发展会使得基于红外热成像的机器视觉越来越智能化和高度自动化,从而大大增加其应用范围。
卷积神经网络(Convolutional Neural Network,CNN)在图像自动识别中获得巨大成功,同时也在缺陷识别中发挥着重要作用。图像经过卷积变换及降采样后被映射到一个较低维的空间中,并自动地提取图像的特征。参考文献[7]设计了基于改进型CNN的深度学习算法,成功地解决了现有焊接异常图像识别算法误检率与漏检率偏高的问题,且该算法对多种焊点缺陷类型识别优势巨大;参考文献[8]通过对短时傅里叶变换后振动信号的时频图进行CNN的训练,实现了对滚动轴承的故障状态识别。
文中针对金属疲劳裂纹检测与识别的问题,结合超声红外热成像技术以及CNN在图像特征自动提取与图像分类以及裂纹缺陷识别中的广泛应用,提出了一种结合超声红外热成像与CNN的裂纹检测与识别方法。利用超声红外热成像技术获得多种不同尺寸裂纹的红外热图像,并将预处理后的红外热图像输入到CNN中进行特征自动提取与识别分类。实验结果表明,CNN在超声红外热像的后处理分类中具有一定的可行性,同时设计的CNN具有较高的识别精度和鲁棒性,能有效地对金属疲劳裂纹进行识别分类。为超声红外热图像的后续研究提供了参考方向。
-
超声红外热成像检测技术使用超声脉冲作为激励源,振动能量注入被测试件,能量传播至裂纹、脱粘等接触面类型缺陷区域时,缺陷区域因摩擦、塑性变形等产生热量,产生的热量同时也取决于试件材料和施加的振动应力水平[9]。产生的热量使缺陷处局部升温,通过红外热像仪获得材料表面热图像,进行计算机分析和处理,从而获取有效的裂纹信息。超声在试件内只对缺陷部位加热,检测技术灵敏度较高。典型的超声红外热成像热系统如图1所示,主要包括超声枪、红外热像仪、加载单元、固定夹具等[10]。

Figure 1. Schematic diagram of ultrasonic infrared thermal imaging detection system
-
CNN是一种特殊的多层感知器或前馈神经网络,具有局部连接、权值共享的特点[11],其实质是构造多个用来提取输入数据特征的滤波器,通过滤波器对数据进行卷积和池化操作,不断提取隐藏在数据集中的特征信息,特征信息不仅包含图像色彩,同时也能获取图像上的边缘特征,如裂纹轮廓、大小等。CNN一般包含卷积层、池化层、全连接层以及激活函数层。
卷积层中可包含一个或多个卷积面(特征图)。输入的图像为矩阵形式,卷积层对应的卷积运算是该矩阵与参数矩阵在卷积层中做卷积操作的过程。参数矩阵也被称作卷积核,不同的卷积核能够提取到图像中的不同特征。卷积核的每个元素与图像对应位置相乘,再求和。通过卷积核的不断移动就会产生新的图像,该图像完全由卷积核在各个位置时的乘积求和的结果组成[12]。
池化层可降低数据维度,避免过拟合、增强局部感受野以及提高平移不变性[13]。常用最大池化(Max Pooling)或平均池化(Mean Pooling)。
图像经过数层卷积以及池化操作后会连接至全连接层。全连接层中的每个神经元与其前一层的所有神经元进行全连接,全连接层能将前层学习到具有类别区分性的特征信息进行整理。
激活函数层主要对卷积层的输出进行一个非线性映射,通过激活函数层的激励函数来加入非线性因素,以此增加模型的表达能力。常用的激活函数有sigmoid函数、双曲正切函数tanh和校正线性单元ReLU等,其表达式如公式(1)~(3)所示:
-
文中预制疲劳裂纹试样采用金属平板,尺寸大小为370 mm×100 mm×5 mm,材料为45钢,其抗拉强度和下屈服强度分别为620 MPa和451 MPa,预制裂纹过程中采用柔度法监测和控制裂纹长度,裂纹尺寸范围控制在0.4~9.5 mm之间,并将上述预裂纹试件采用电火花线切割的方式得到被测试件[14],获得如图2所示的被测试件。图2中给出了试件夹持位置(Clamp position)以及超声激励位置(Excitation position)。
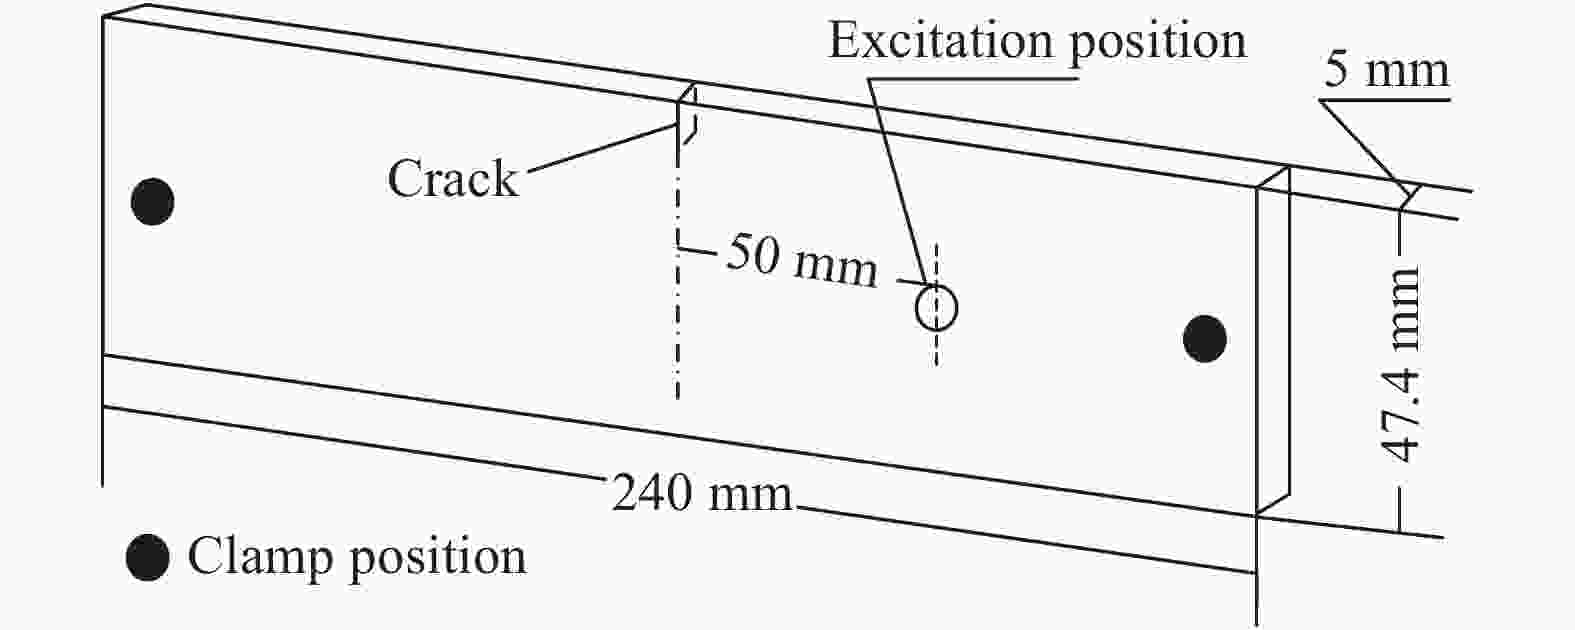
Figure 2. Schematic diagram of test plate
-
超声红外热图像采集实验在陆军装甲兵学院车辆工程系PHM和无损检测实验室进行。
采集实验在一套超声红外热成像无损检测实验台上进行,通过自主编写的一套超声红外无损检测系统,实现了在软件及硬件上的实验要求。采集条件为预紧力25 kg,激励强度35%,激励时间4 s,激励位置偏离中心50 mm。试件共15类,每类含不同长度裂纹或没有裂纹,裂纹光学测量长度如表1所示,其中第15类为无裂纹试件。参考文献[14]给出了装置的具体组成。红外热像仪采用美国FLIR公司生产的T640,用于实现采集对象表面的温度场信息。该热像仪可以提供红外图像分辨率为640×480 pixel,热灵敏度小于等于0.035 ℃,图像采集帧频为30 Hz,镜头可实现120°上下翻转。激励结束后实验采集系统会自动生成对应文件,然后通过FLIR-ResearchIR软件生成CSV文件。
Number of test piece Crack length/μm 01 5374.71 02 5477.40 03 5624.33 04 6570.00 05 6629.00 06 7275.00 07 7507.79 08 7930.00 09 8537.50 10 9143.00 11 9301.36 12 9453.00 13 3474.50 14 3898.49 15 0 Table 1. Crack and optical measurement length of 15 kinds of metal specimens
-
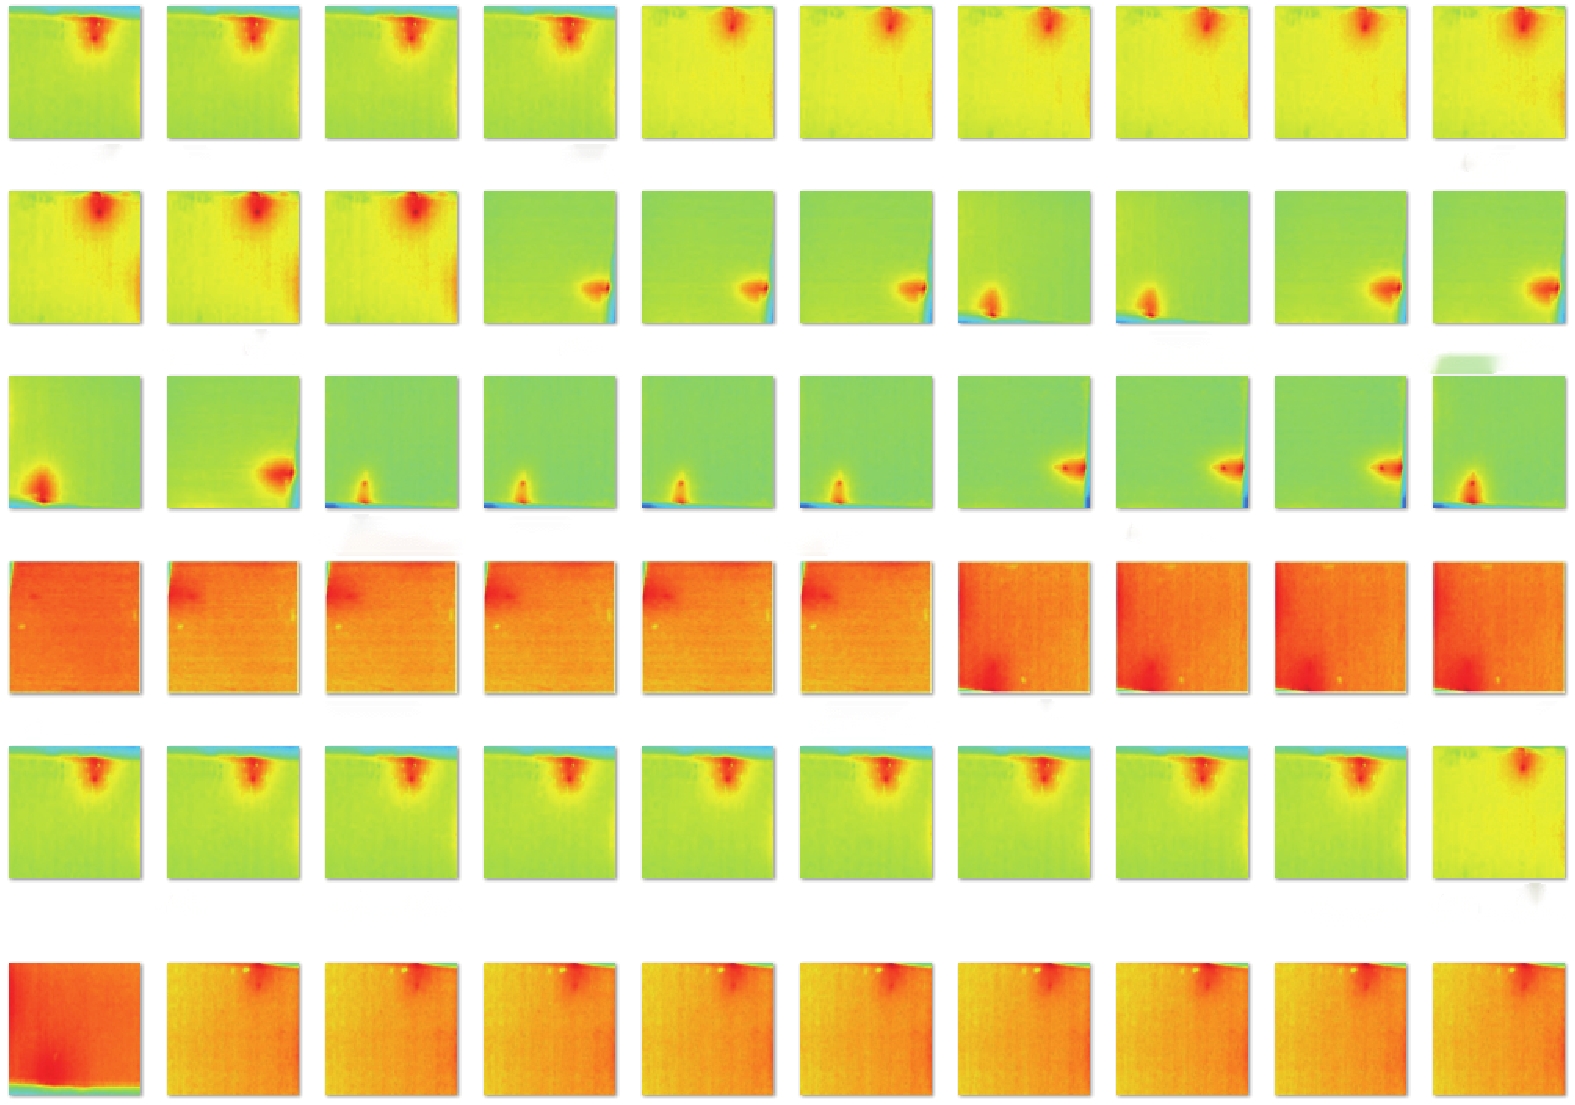
将实验所得的CSV文件输入到MATLAB软件中进行图像处理,裁剪掉非试件区域,选取所需的实验范围,制作实验所需的数据集。最终获得数据集包含15类超声红外实验获得的红外热图像,但采集的数据样本量较少,因此需要对原始数据集进行扩增,常用的数据扩增方法有图像旋转、图像裁剪、缩放、图像亮度变化、图像加入噪声等[15]。为有效保留图像的原有特征信息,文中采用图像旋转的方法对数据进行扩增,如图3所示。最终获得每类300张,共计4500张红外热图像,部分无裂纹图像如图4所示,有裂纹图像如图5所示。
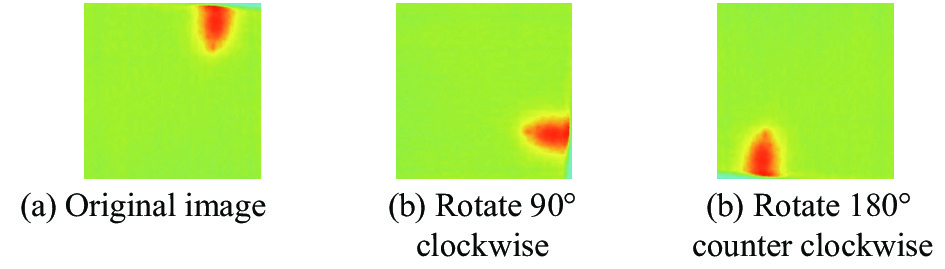
Figure 3. Data amplification

Figure 4. Crack-free infrared thermal images
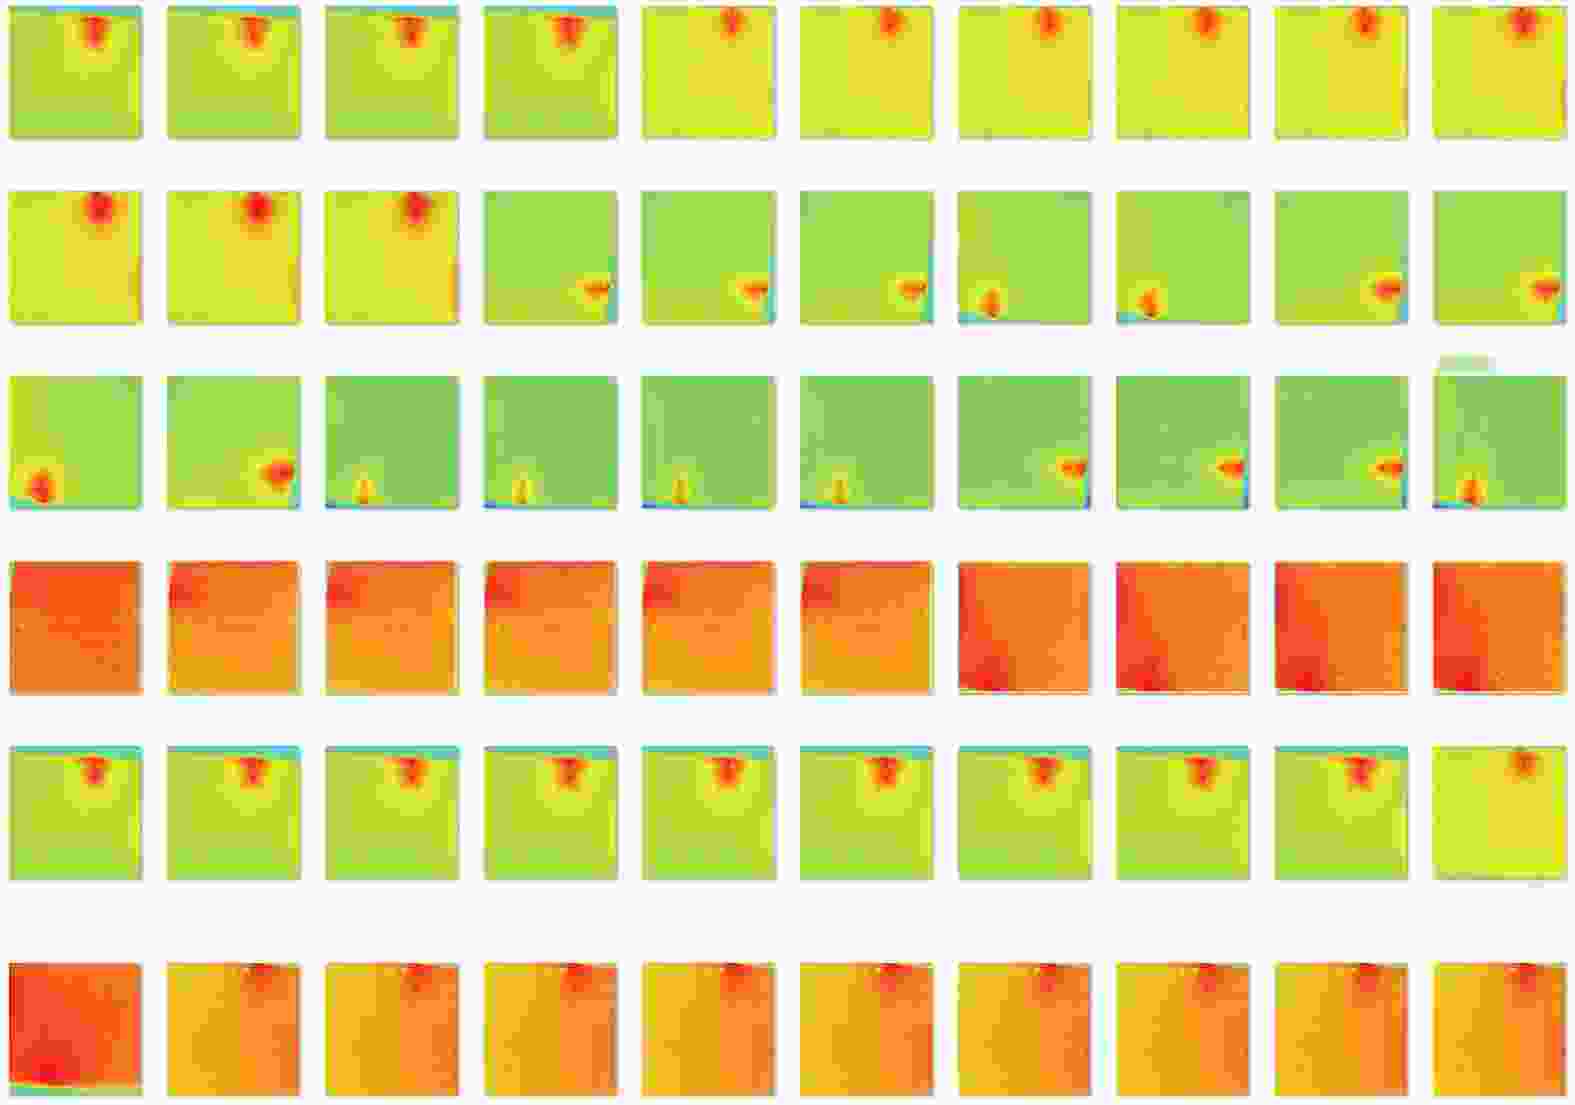
Figure 5. Infrared thermal image with cracks
-
实验环境:Windows 10教育版,64位操作系统,安装内存(RAM)8 G,处理器为AMD Ryzen 52600 Six-Core Processor 3.4 GHz,显卡为GeForce GTX 16606 G。
-
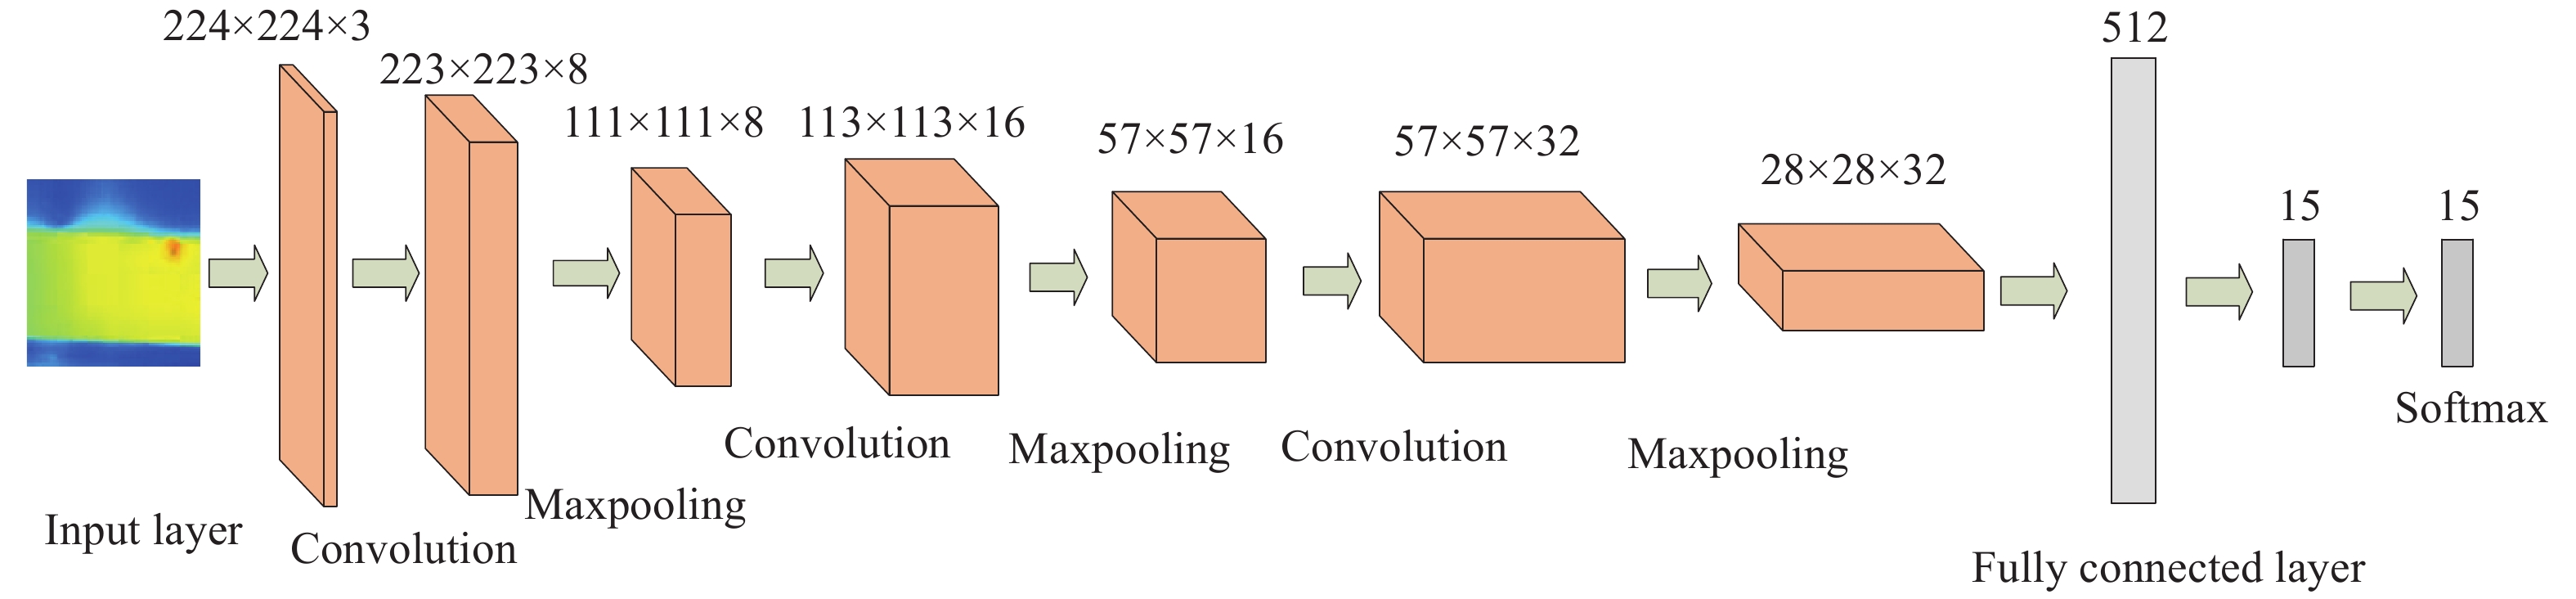
不同的CNN结构对于不同问题、不同数据集,具有不同的效果。并非越庞大的网络就越好,因此,文中针对当前超声红外热图像数据设计了一个CNN结构,包含三层交替出现的卷积层和池化层(最大池化),两个全连接层,激活函数选择校正线性单元ReLU。
-
输入层为网络第一层,图像经过输入层后转化为矩阵作为下一层卷积层的输入,文中输入数据为224×224的彩色超声红外热图像。
-
在CNN的卷积运算中,在达到相同感受野的情况下,卷积核越小,所需要的参数和计算量越小,卷积核尺寸大小必须为大于1的奇数才有提升感受野的作用[16]。因此文中卷积核大小选用5和3。三层卷积层的卷积核大小依次为5-3-3。CNN三层卷积层的卷积核的数量设置为8-16-32。
-
文中设计的CNN结构设置两层全连接层,分别置于第三层池化层后与Softmax层之前。
-
文中设计的CNN结构分类器使用Softmax回归模型,Softmax是logistic回归模型在多分类问题上的推广,在多分类问题中,类标签y可以取两个以上的值[17]。Softmax回归模型对于多分类问题非常有效,它是有监督的回归模型。对于n类的分类问题,Softmax的回归输出可通过公式(4)获得:
式中:
${\boldsymbol{}}W$ 和$b$ 分别为权重矩阵和偏置值;$\theta $ 为CNN的输出。为避免过拟合,在网络中使用丢失输出(Dropout)技术,大小取0.5。Dropout是一种简单有效的正则化技巧,其基本思想是通过阻止特征检测器的共同作用来提高神经网络的泛化能力[13]。网络参数如表2所示,网络结构示意图如图6所示。
Layer Description Layer Description input 224×224×3, images with
"zerocenter" normallizationconv_3 32 3×3×16 convolutions with
stride[1 1] and padding[1 1 1 1]conv_1 8 5×5×3 convolutions with
stride [1 1] and padding[0 0 0 0]relu_3 Relu relu_1 ReLu maxpool_3 2×2 max pooling with
stride [2 2] and padding[0 0 0 0]crossnorm_1 Cross channel normaillization
with 5 channels per elementfc_1 512 fully connected layer maxpool_1 2×2 max pooling with
stride [2 2] and padding [0 0 0 0]relu_4 ReLU conv_2 16 3×3×8 convolutions with
stride [1 1] and padding[2 2 2 2]dropout 50% dropout relu_2 Relu fc_2 15 fully connected layer crossnorm_2 Cross channel normaillization
with 5 channels per elementSoftmax Softmax maxpool_2 2×2 max pooling
with stride [2 2] and padding "same"classoutput crossentropyex Table 2. Description of network model parameters designed in this article
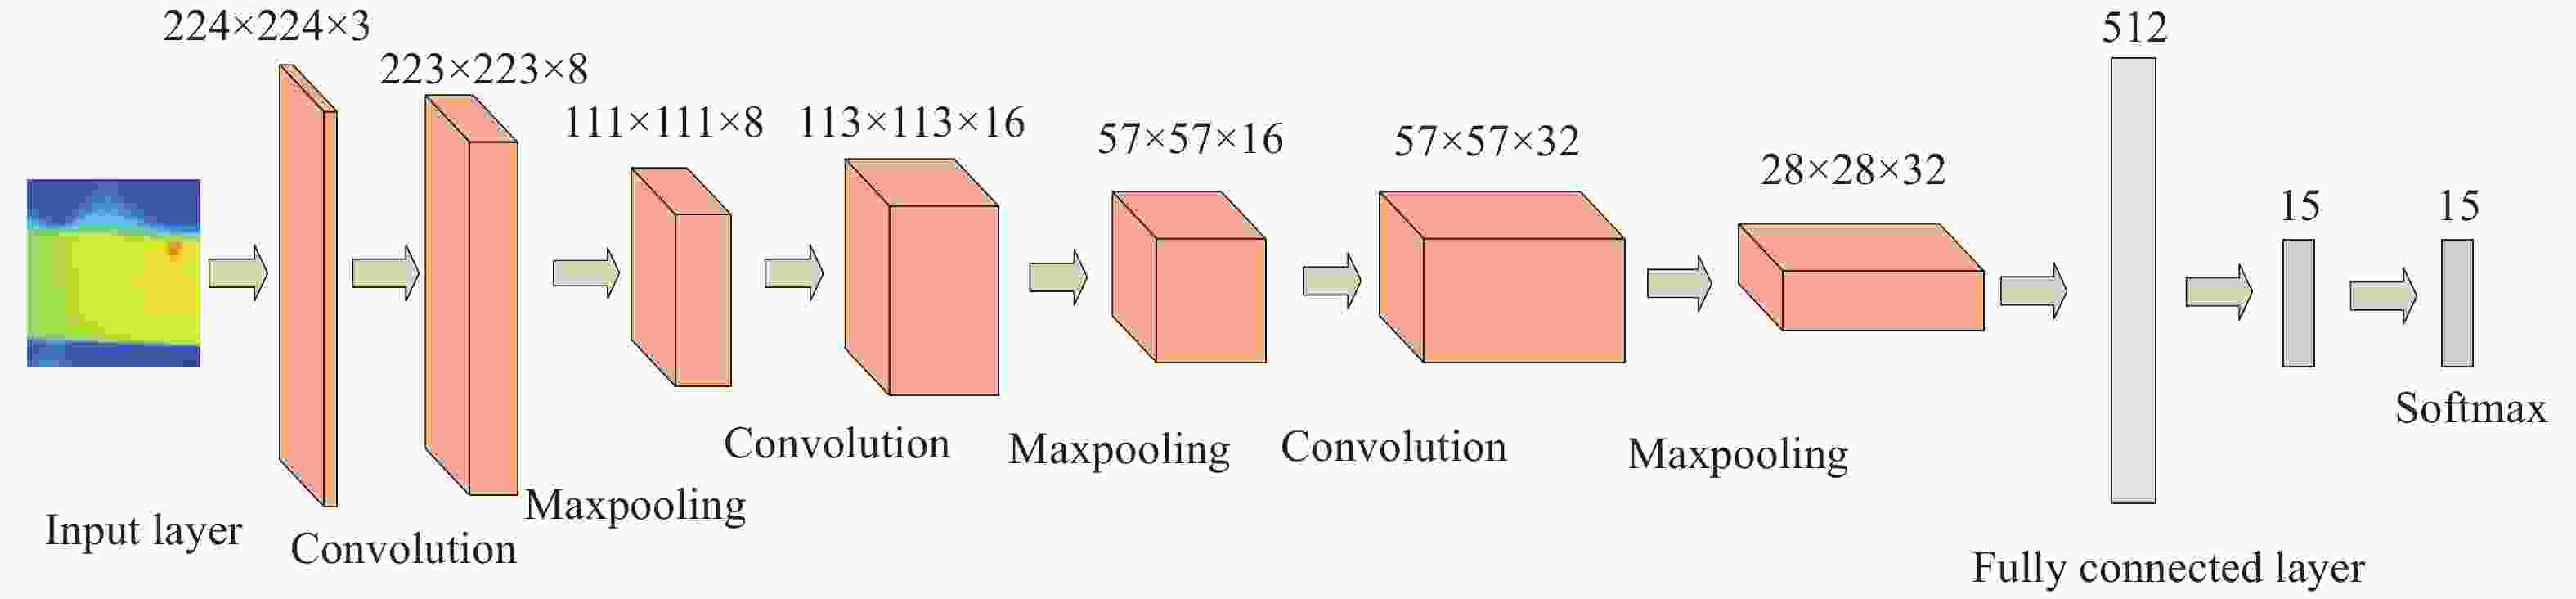
Figure 6. Structure diagram of convolutional neural network designed in this article
-
文中采用深度学习框架Deep Network Designer构建卷积神经网络,Deep Network Designer是一个基于MATLAB的神经网络设计平台。
-
批量尺寸(Batch Size)即每次训练时在训练集中取一定量样本训练,批量尺寸在CNN的训练中,影响网络的训练速度和网络最终的训练效果,当批量尺寸较大时,网络训练收敛速度比较快,但由于权值调整次数减少会影响训练效果,批量尺寸较小时则反之,所以需选择合适的批量尺寸。实验选择批量尺寸依次为32、64、128。重复实验10次,取10次实验最终分类正确率的平均值和训练所用时间的平均值为标准。实验结果如表3所示,结果表明,批量尺寸为64时准确率最高。
Batch size Accuracy Time/s 32 99.3% 296 64 100% 206 128 95.4% 188 Table 3. Results of different batch size recognition rate
-
在CNN的训练中,迭代过程是不断拟合、不断逼近的过程,迭代次数(Epoch)会影响拟合效果。当迭代次数达到一定数量时,拟合误差会接近收敛,不再减小,过高的迭代次数会加大时间成本。所以选择适当的迭代次数能在获得最佳拟合效果的同时拥有最小的时间成本。为测试最佳的迭代次数,将迭代次数以外的其他参数设为固定值,应用文中设计的CNN网络模型,设定最大迭代次数为20,通过网络的训练选取最佳的迭代次数。随着迭代次数增多,识别的准确率不断提升,损失函数不断降低直到达到最优,训练过程如图7所示。当迭代次数达到8次,即训练次数达到400次以上,识别准确率基本稳定,训练模型的准确率达到100%。
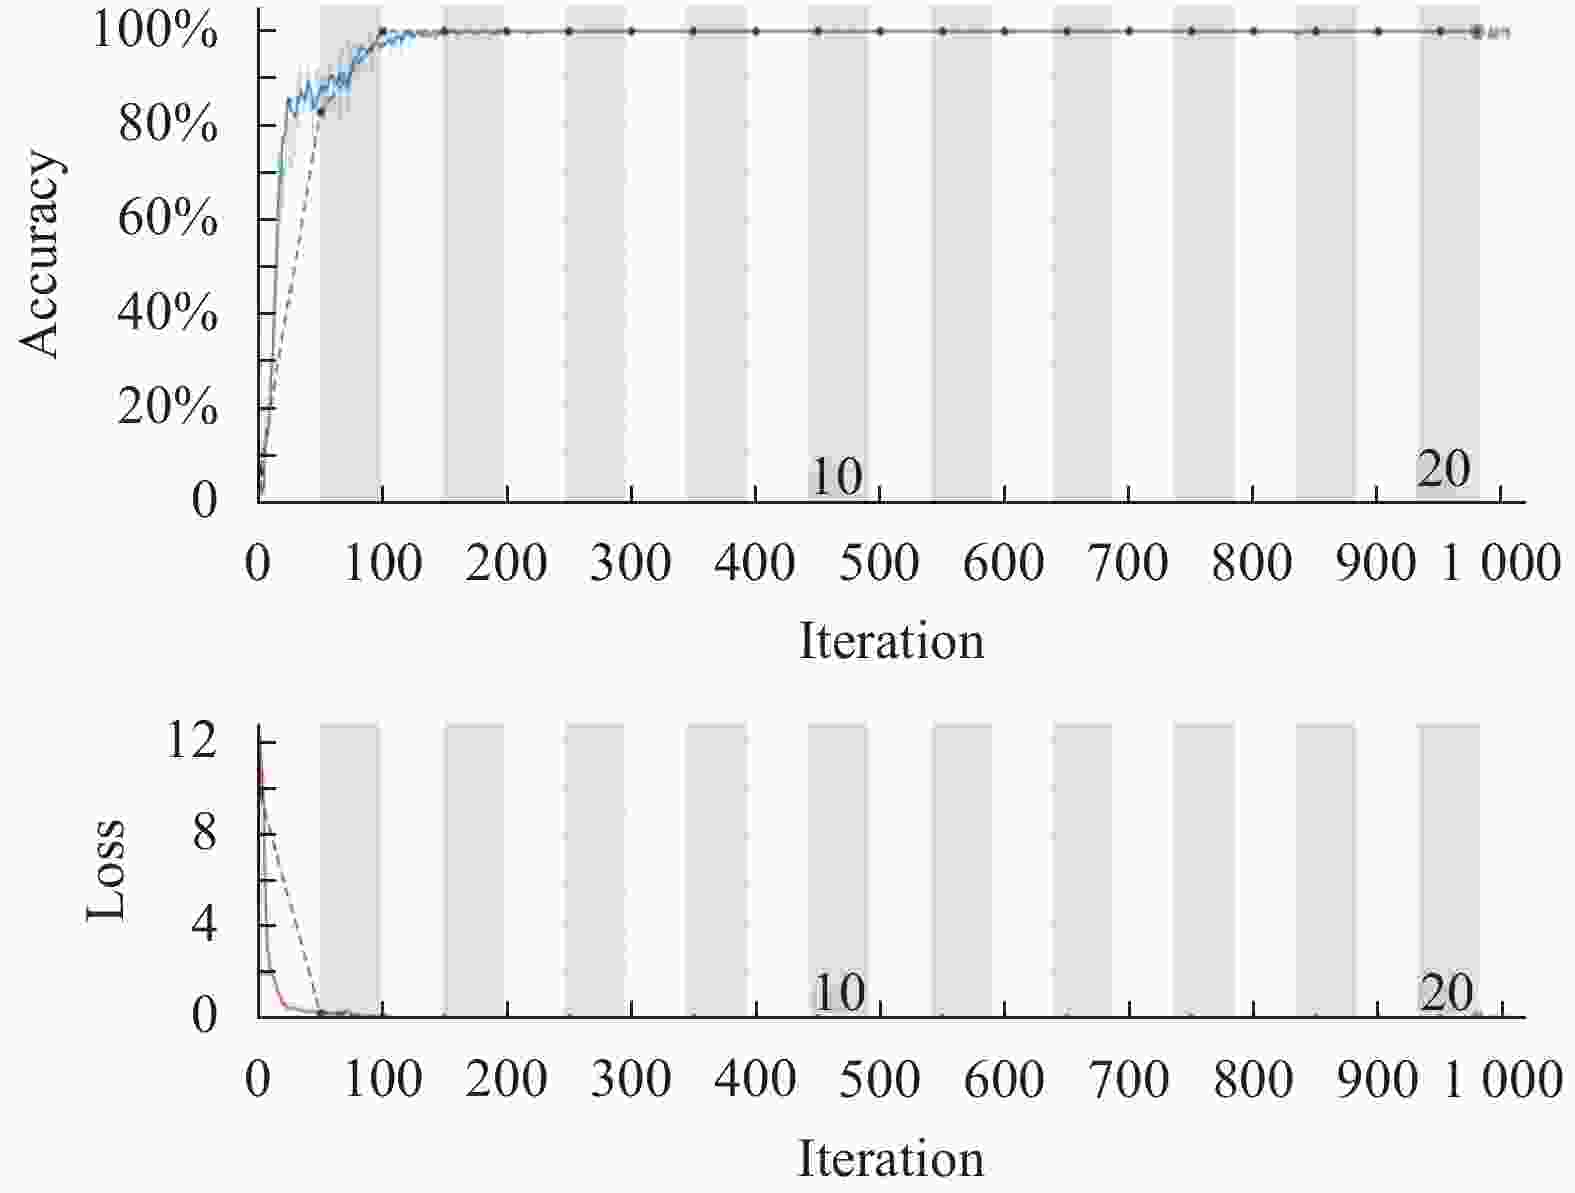
Figure 7. Curves of training results
最终确定选取批量尺寸为64,迭代次数为10次,学习率为0.001,Dropout为0.5。并使用数据集对网络进行测试,在测试的输出环节中引入混淆矩阵(Confusion matrix)[18]。某次测试样本的分类结果如图8所示。其中,纵轴表示预测裂纹,横轴表示真实裂纹。所有测试样本分类以及总的分类正确率和错误率都可从混淆矩阵中读出。
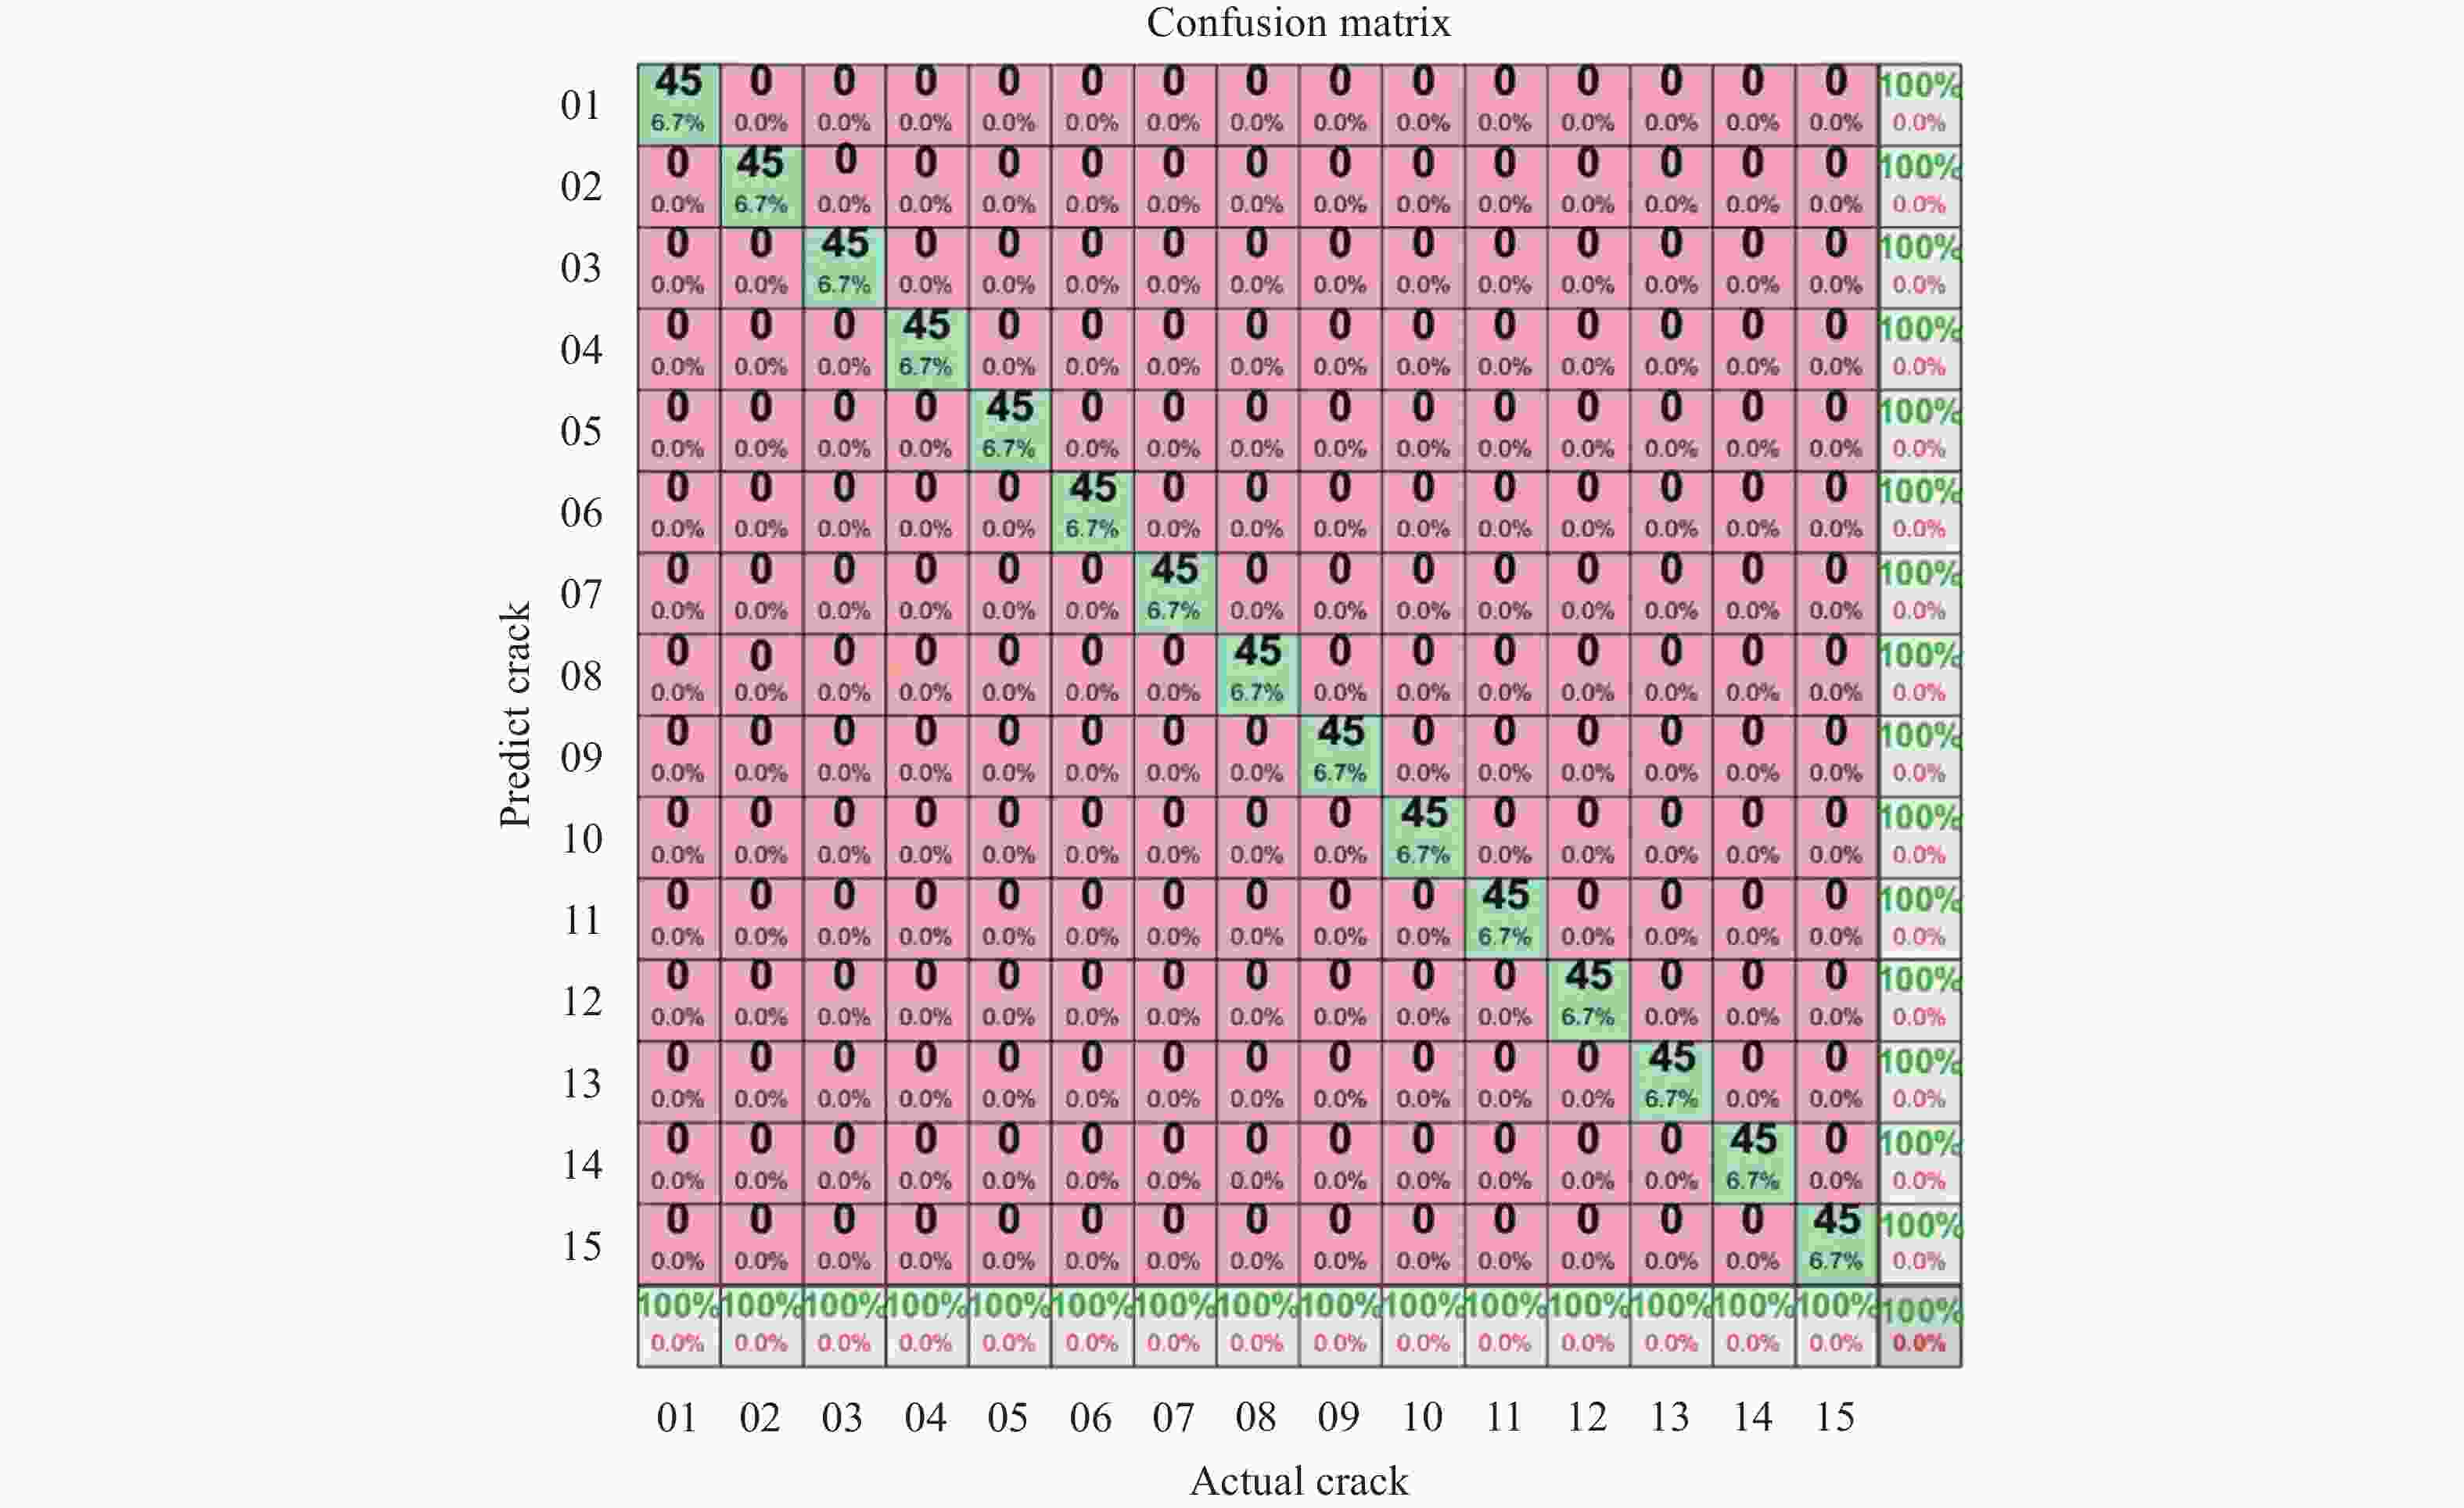
Figure 8. Classification results of testing samples
-
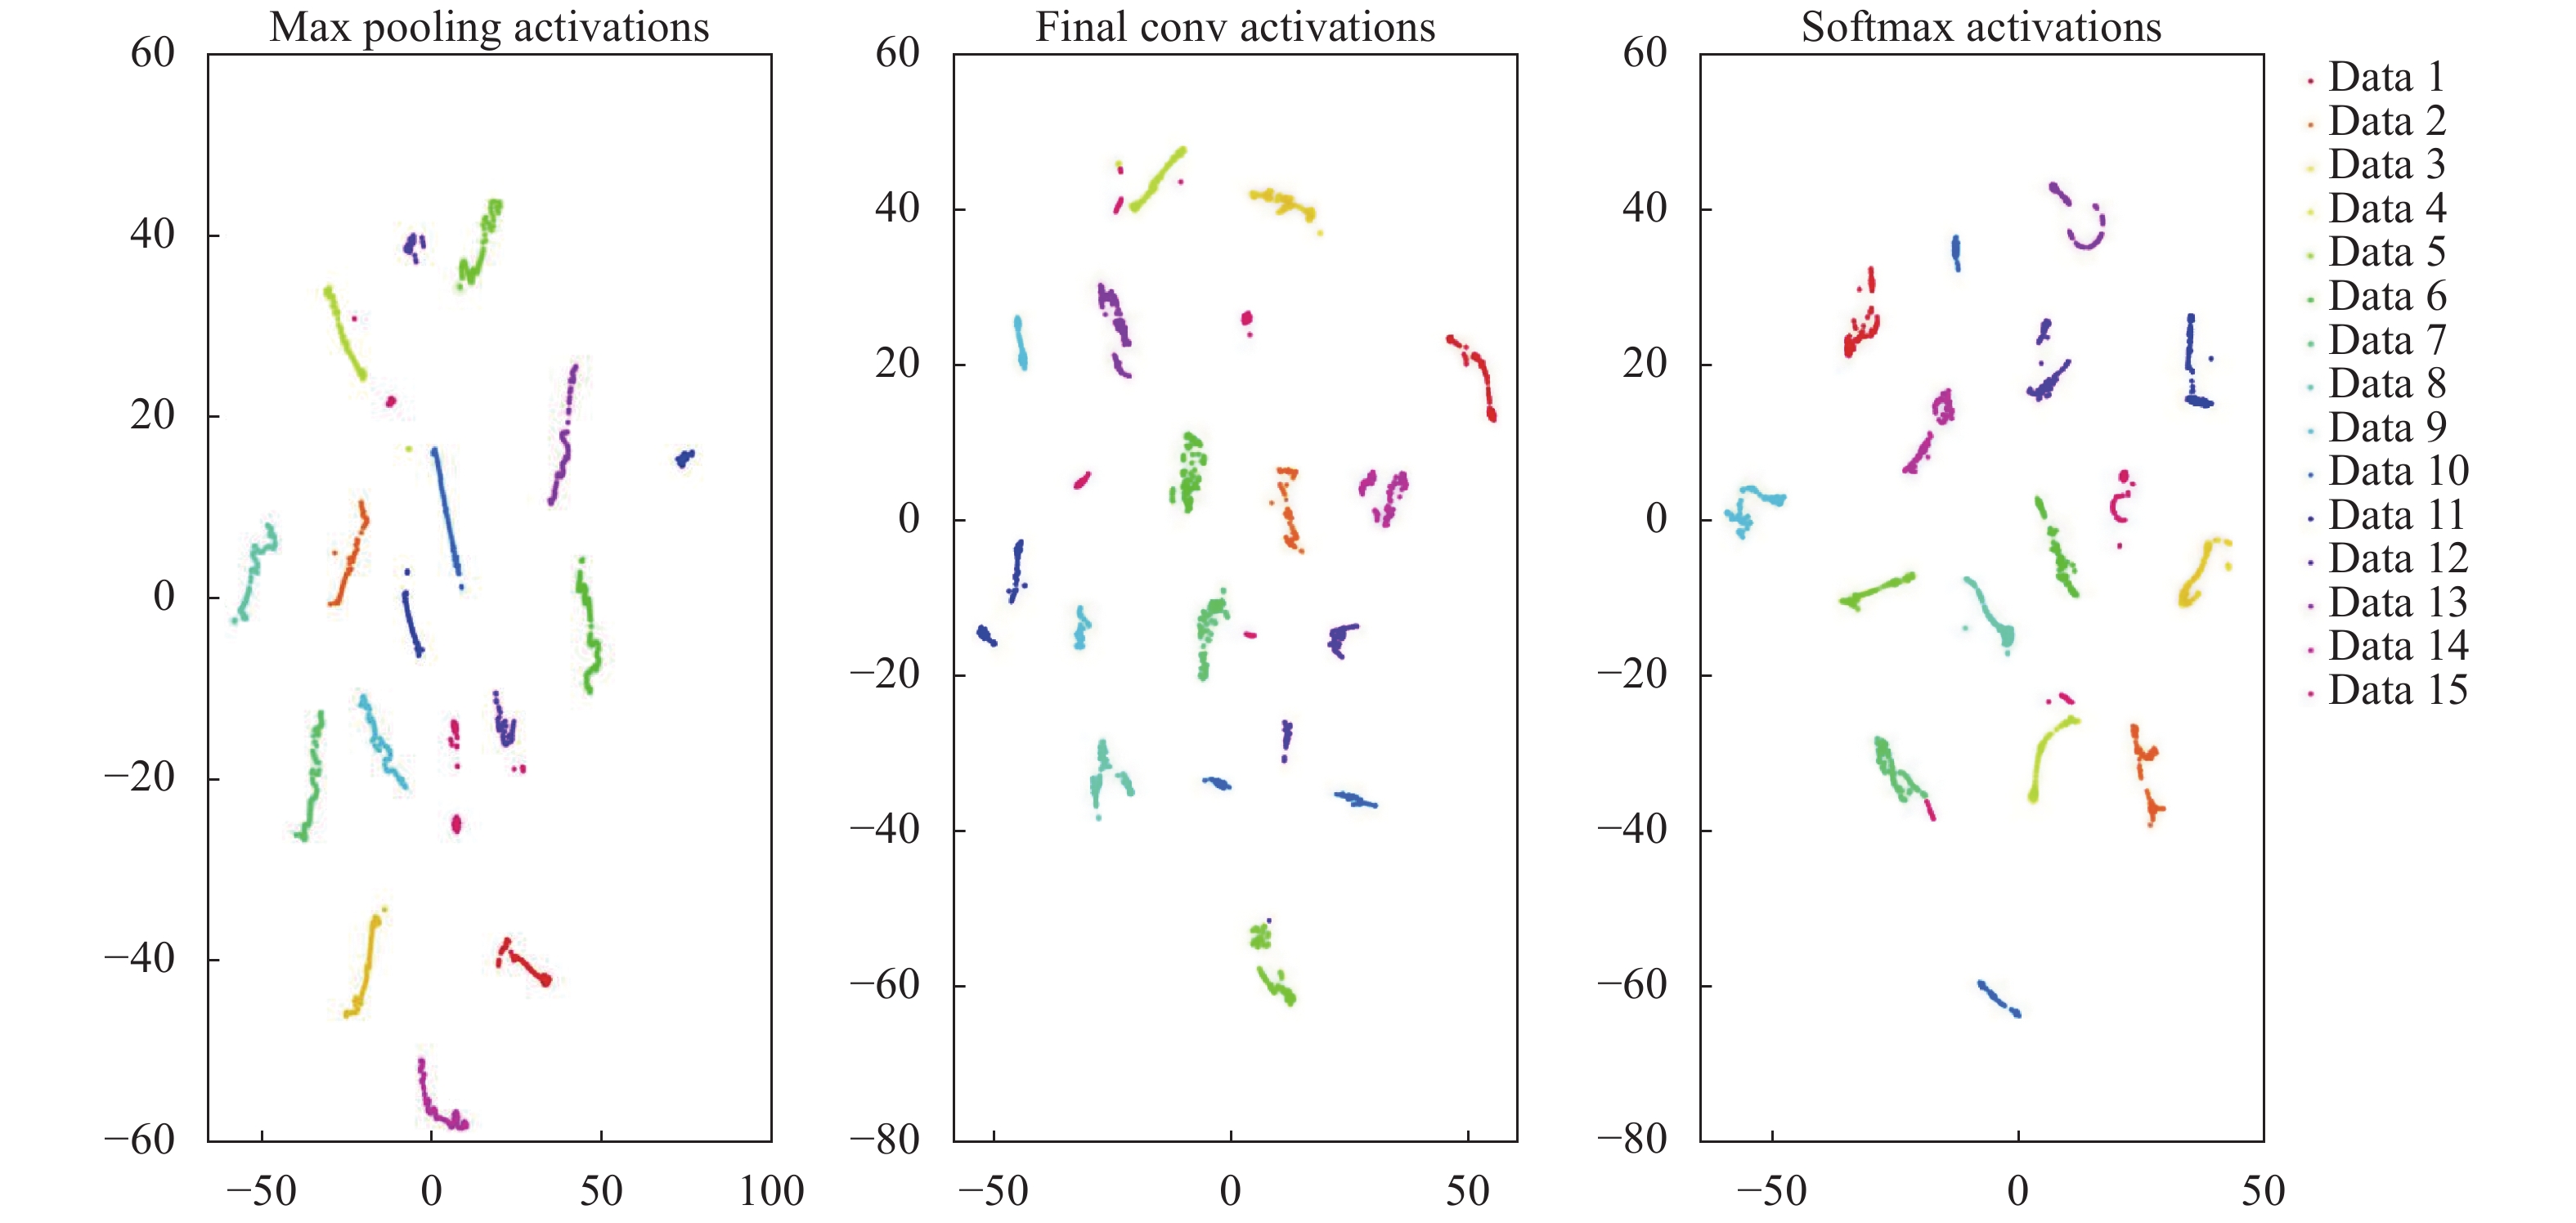
为了更加直观地观察文中设计的CNN的数据聚类效果,使用t分布领域嵌入算法(t-distributed Stochastic Neighbor Embedding, t-SNE)[19]进行可视化分析,分析数据集在CNN下的聚类效果,结果如图9(a)~(c)所示,分别表示网络第一层池化层、最后一层全连接层以及Softmax层的输出数据的聚类效果。t-SNE是一种非常有效的非线性降维方法,它是基于在邻域图上随机游走的概率分布,可以在数据中找到其结构关系。t-SNE关心的是学习维持数据的局部结构,降到二维空间时会保留数据的流形结构,类间的距离远近并不代表真实数据的分类距离,仅为一个聚类示意图。由图9可知,数据集在文中提出的模型中有着很好的聚类效果,分类效果明显。
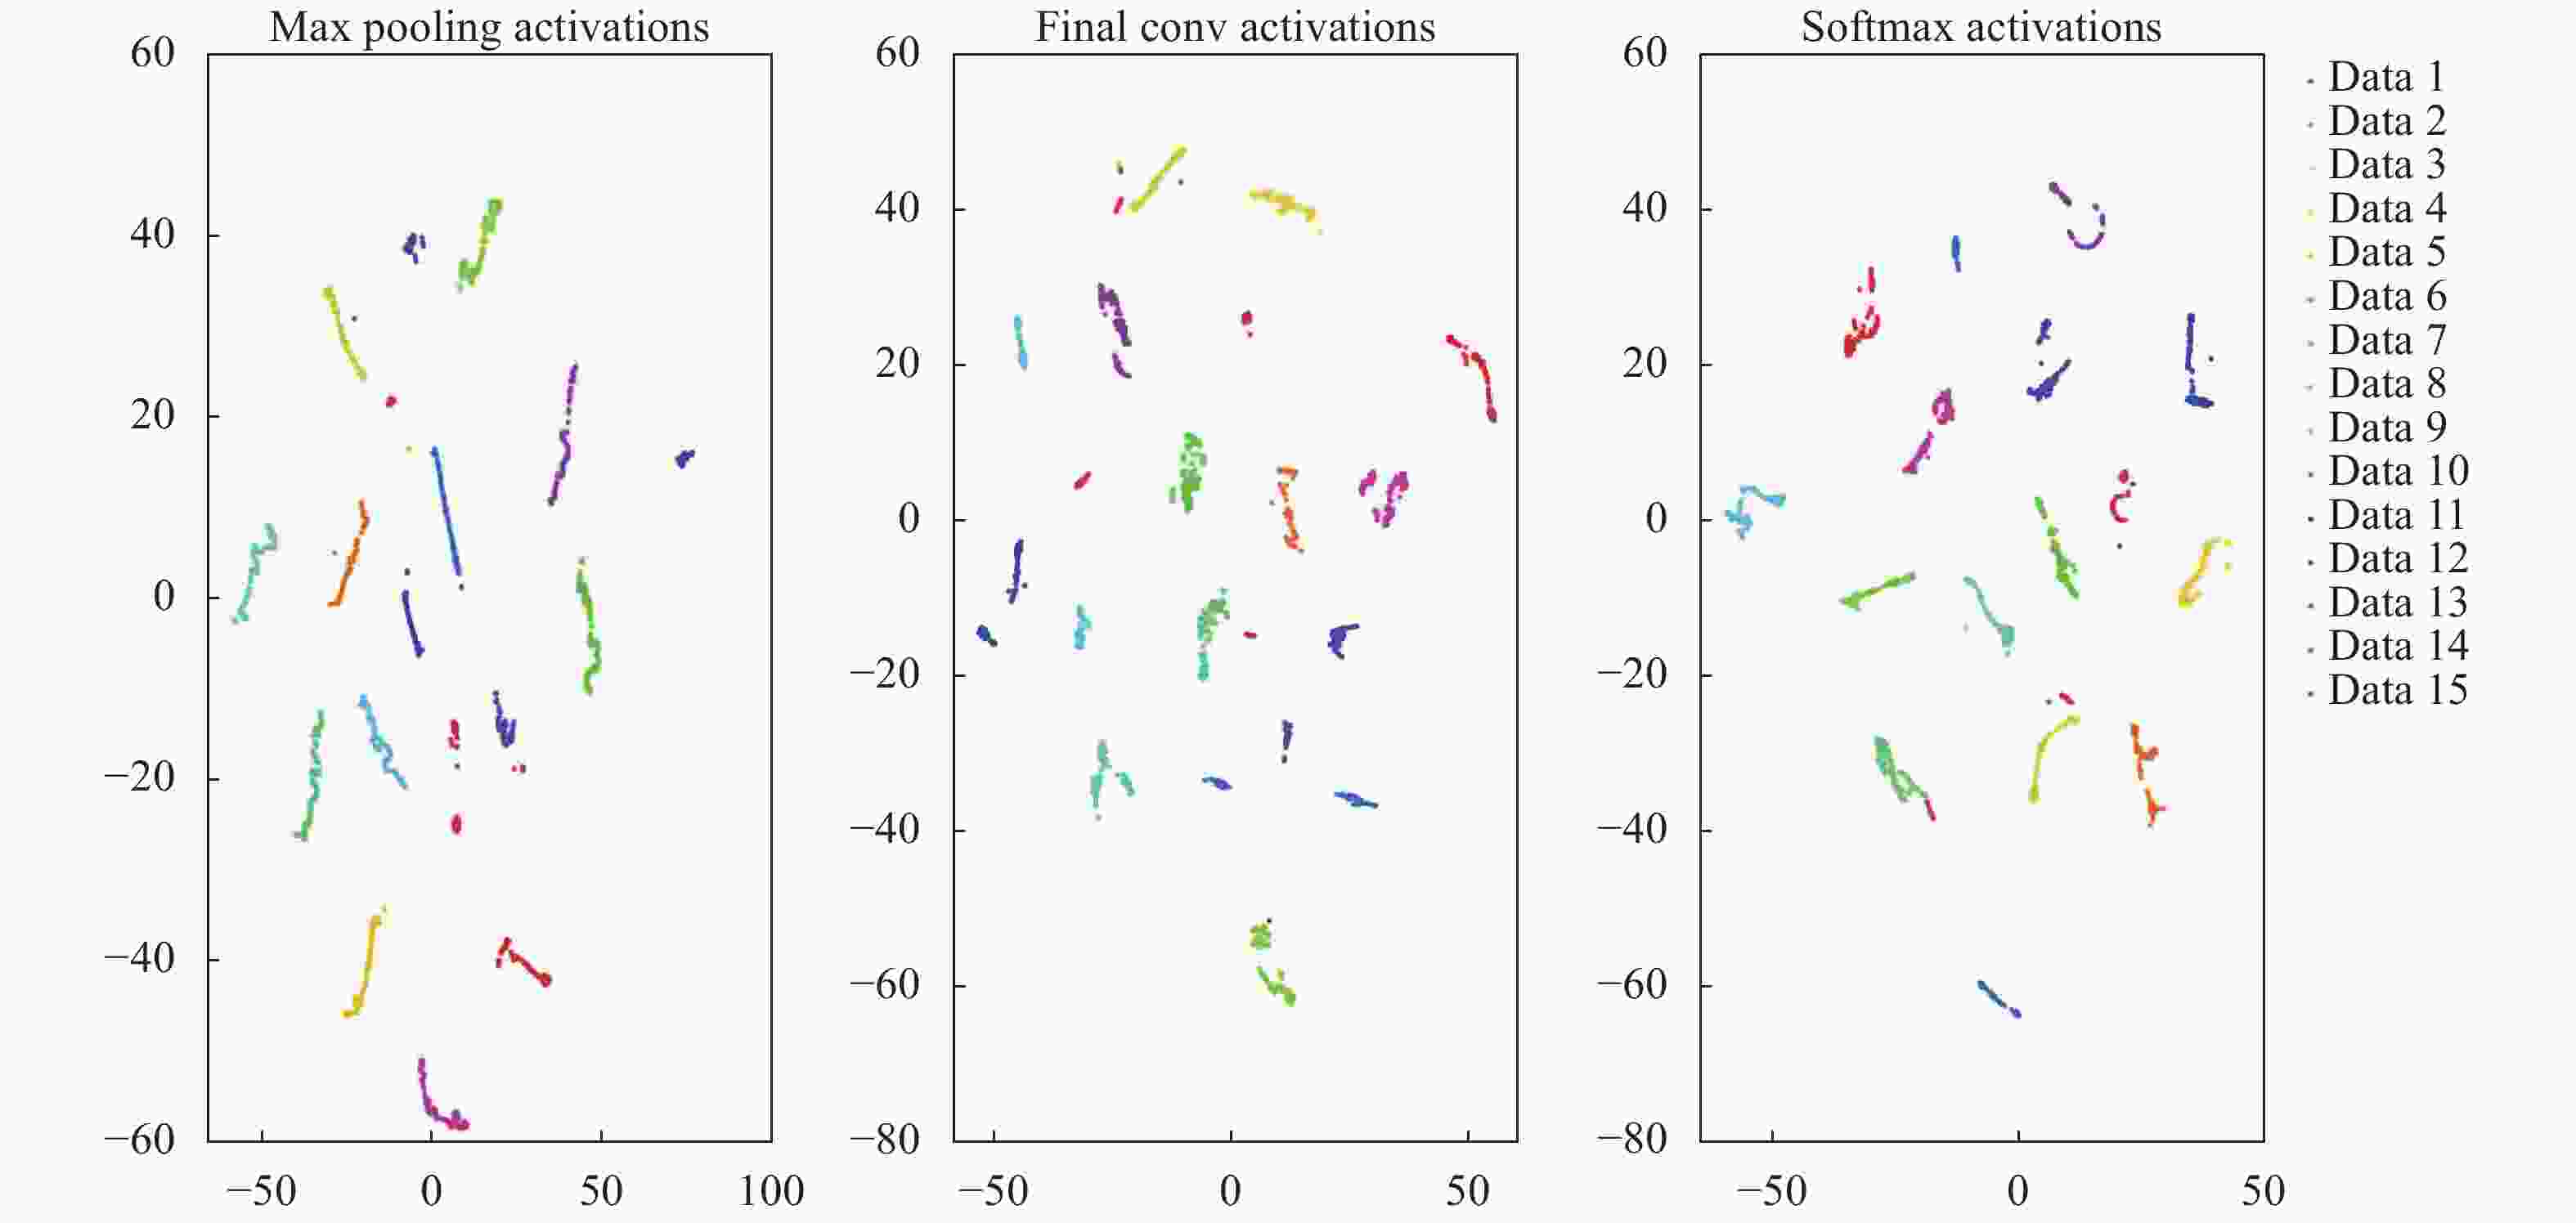
Figure 9. t-SNE visualization of test set based on network model
-
为验证文中设计的CNN的可行性,除在表1数据集上进行测试外,还在与表1数据集不同实验条件下获得的热图像上进行了验证,所用的超声红外实验条件为预紧力15 kg,激励强度40%,激励时间3 s,激励位置不变,获得红外热图像共10类,每类包含300张,共计3000张红外热图像,裂纹大小如表4所示。使用训练好的网络对验证所用的数据集进行识别分类,多次实验的平均识别率在99%以上,某次裂纹的真实结果与预测分类结果如图10所示。实验结果表明,设计的CNN在不同检测条件下获得的热图像仍具有一定的可行性。
Number of test piece Crack length/μm Number of test piece Crack length/μm A 9453.00 F 6577.41 B 9301.36 G 6629.00 C 9143.00 H 6740.50 D 8537.50 I 6983.00 E 8014.54 J 7275.00 Table 4. Metal plate specimen and optical measurement of crack size
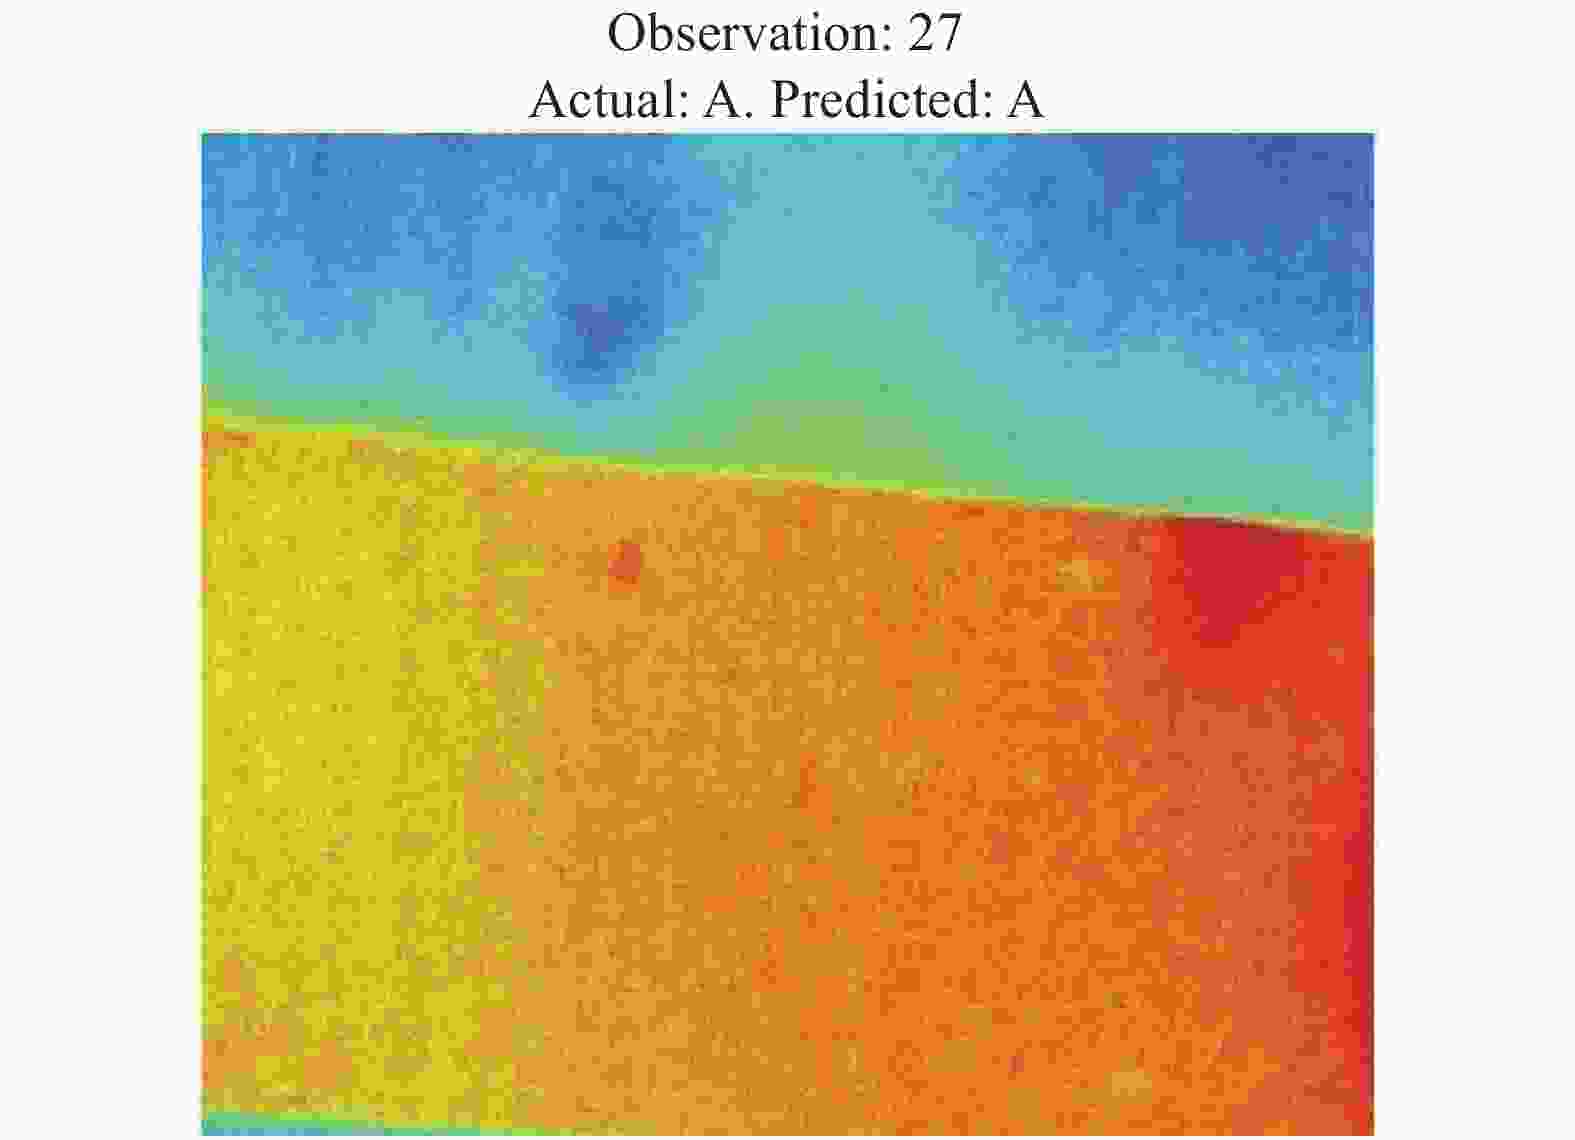
Figure 10. Prediction results of a crack
-
为验证文中设计的CNN的有效性,选取在图像识别中现常用的网络模型Alexnet[20]以及Googlent[21]进行对比实验,同时也使用支持向量机(SVM)[22]对图像进行分类。使用表1的实验数据进行验证。实验结果显示,设计的CNN分类准确率优于两种常用模型的准确率且网络训练时间较少,对比支持向量机,其识别效果更为显著,可知文中提出的方法优于传统检测与识别方法。具体实验结果如表5所示。
Algorithm Accuracy Time/s CNN designed in this article 100% 206 Alexnet 99.6% 236 Googlenet 98.9% 326 SVM 95.3% 1154 Table 5. Crack recognition and classification by different algorithms
-
文中针对超声红外热图像的后处理及裂纹的自动识别问题,提出了一种基于CNN的金属疲劳裂纹超声红外热像检测与识别方法,该方法对自制裂纹图像数据集识别分类准确率达到100%。为超声红外热图像的后处理及裂纹自动识别的研究提供了一定的参考。同时可得以下结论:
(1) 针对金属疲劳裂纹检测与识别的问题,提出的方法可同时对多种裂纹以及无裂纹红外热图像进行识别分类,验证了CNN自动识别超声红外热图像的可行性。
(2) 对不同超声红外实验条件下获得的红外热图像进行实验验证,结果表明,设计的CNN依然具有很高的识别率,验证了方法的可行性及网络良好的鲁棒性。
(3) 相比Alexnet网络、Googlenet网络和支持向量机(SVM),设计的CNN识别准确率最高。
Research on vibrothermography detection and recognition method of metal fatigue cracks based on CNN
doi: 10.3788/IRLA20210227
- Received Date: 2021-04-06
- Rev Recd Date: 2021-06-02
- Publish Date: 2022-04-07
Fund Project:
National Natural Science Foundation of China (51875576,52005510);Foundation of Key Laboratory of Nondestructive Testing Technology of Ministry of Education(EW201980445)
-
Key words:
- vibrothermography /
- Convolutional Neural Network (CNN) /
- image recognition /
- image classification
Abstract: Traditional methods of detecting and recognizing metal fatigue cracks by ultrasonic infrared thermal images mainly extract relevant thermal characteristics of infrared thermal images through image processing algorithms and match crack characteristics. This process is tedious and the recognition rate is low. Additionally, the effective characteristics need to be manually selected. Taking the advantages of active thermography and Convolutional Neural Network (CNN) in metal structure testing and automatic defect recognition, a vibrothermography crack detection and recognition method based on CNN was proposed. The specimens (metal platesin this work) were tested and thermal data sets were obtained by the proposed CNN-based vibrothermography. The designed convolutional neural network was applied to the feature extraction, recognition and classification of vibration-induced infrared thermal images with different crack sizes. In addition, the proposed method was compared with two common image classification network models and support vector machine. Experimental results show that the designed convolutional neural network can recognize and classify metal fatigue cracks with an accuracy of 100% on the experimental data sets, which is better than other network models and support vector machine, and can effectively detect and recognize metal fatigue cracks.


 DownLoad: