


-
随着我国基础建设规模的不断增大,各种类型的大型建筑层出不穷,而针对建筑物的智能监测就成为了保障其安全使用的主要手段,也是建筑物健康监测的研究热点[1]。对于建筑物的健康监测而言,重点是对总体位移、倾斜以及结构沉降等的监测。
由于各地方地质环境的不同,楼宇、隧洞、桥梁等建筑物的监测位置、封装形式、灵敏度要求均有所差异。以往的监测手段大部分是针对敏感部位应力应变的监测,虽然具有一定的代表性,但是对于建筑物本身而言,任意位置的隐性破坏都有可能造成严重的安全隐患,故研究适用于整体结构的健康监测系统更具普适意义。传统监测手段常采用应变片等电测传感元件,其存在最大的问题就是建筑物往往使用年限在几十年,而电测型传感器的使用寿命远小于此,并且非常容易受到外界环境干扰[2],例如潮湿短路、腐蚀失灵等问题。而光纤传感技术[3-4]由于采用无源的光纤作为传感单元,所以其具有很好的干扰能力,不受电磁影响,不怕水,同时具有更小的尺寸,非常适合长时间监测。目前,光纤传感技术已在隧道、桥梁、轨道等土木工程中得到广泛应用[5]。J.R. Fonollosa等人[6]研究了光纤传感回波信号的高阶矩阵表达方式,为解算光纤传感中的信号解调提供了理论支撑。Ali masoudi[7]提出了一种将光纤嵌入电缆完成应力场检测的工装方式。J. Tejedor等人[8]设计了基于分布式光纤网络的管道状态监测系统。A. Papp等人[9]采用光纤时域分析法完成了结构体应力场时域分析,实现了应力与振动状态的解耦计算。丁勇等人[10]采用FBG完成了H型钢在振动与应力耦合作用时的状态分析,并在工程中进行测试。许滨华等人[11]利用弯曲理论对分布式光纤网络在管道中的应力场实时监测进行了研究,并给出了其在板堆石坝的挠度测试数据,变相分析了建筑物的安全程度。何凯等[12]采用准分布式光纤感知阵列完成了空间结构变形与振动的在线监测。
综上所述,大部分研究主要针对特征位置偏移、振动的数据的获取,对主体结构的检测相对较少。文中重点针对主体结构应力场监测,面向建筑物整体健康状态的实时测量。
-
系统采用光纤光栅传感网络实现整体结构分布式数据采集,测试点使用基于光纤布拉格光栅(Fiber Bragg Grating,FBG)[13]作为感知单元,通过适用于建筑物结构体的封装固定于支撑结构的各个位置。测试系统由调频光源、光隔离器、耦合器、解调模块以及数据处理模块组成,系统如图1所示。

Figure 1. Schematic diagram of the overall structure of the system
如图1所示,光纤传感网络对建筑物主体结构进行全面覆盖,从而获取整个结构应力分布状态信息,完成对建筑物结构体承载状态在线监测。同时,其数据也能够进行包括整体位置偏移、倾斜以及沉降程度的分析。相比于传统的健康监测系统具有稳定性好,不受外界环境干扰的优势。
-
FBG通过强紫外光光刻实现在光纤中对入射光波进行反射,反射波长由刻栅周期决定,其关系有:
式中:λB为光纤回波的中心波长;neff为光纤纤芯对应的折射率;Λ为刻划周期。由此可见,当FBG刻制好后其回波中心波长就是固定值了。由于光纤的柔性特征,当存在应力作用或温度作用时,栅格结构受到挤压拉伸或热胀冷缩,从而导致波长偏移。基于此原理完成目标结构应力场及温度场的检测。共同作用效果有:
式中:α和ξ为光纤膨胀系数和热光系数;ΔT为温度改变量;Pε为弹性系数;Δε为应变改变量。由此可知,温度与应变存在交叉敏感,在该系统中采用在主体结构应力监测网中间断插入温度补偿标定光纤光栅的方式进行两参数的解耦。用于温度补偿的光纤光栅传感器标记为FBGt(如图1中所示)。将计算得到的补偿参数代入公式(2)后,有:
式中:Ct为温度补偿系数。
-
由材料力学和挠度理论[14]可知,通过两个平行位置的受力分析可以对其结构弯曲程度进行分析,故将两个位置上安装应变敏感的FBG后,就能够获得与FBG轴向同方向的应变测试值ε1和ε2,用这两个参数可以表征结构体的弯矩变形程度,其函数表达式有:
式中:Iz表示光纤的惯性矩;E表示光纤的弹性模量;ε1和ε2分别表示两个状态下的应力场分布;x表示测试轴向上的自变量值。
在上式的基础上,采用多项式拟合的方式,利用Fourier 级数展开[15],将原有的应变差值拟合的相应的函数曲线。在此过程中设拟合函数的限定长度为L,则x在[0, L]区间中满足拟合函数的一个周期。再通过定义2π周期内的表征系数为k(k=2π/L),则傅里叶函数展开形式ω(x)可以写成:
式中:n表示傅里叶阶数,N为其最大值;f(x)表示拟合应变场的函数形式。其中包含的两个积分项表示拟合函数的系数,可以采用求解矩形面积的方式得到。当f(x) 是对应位置上的应变值时,可以通过微分量dx表示测量值的最小可识别量,故当测量采样密度足够小时,函数的拟合曲线就能够符合设计要求。拟合过程通过MATLAB实现,利用傅里叶级数展开的方式获得多项式的准确表达。故只要函数在整个测试区间中是可积的,都可以通过公式(4)的计算得到其对应的傅里叶函数展开,从而完成各种波形的计算。由此可见,只要光纤解调模块的光谱解调能力能够区分,那么其傅里叶函数展开的结果就都是适用的。
-
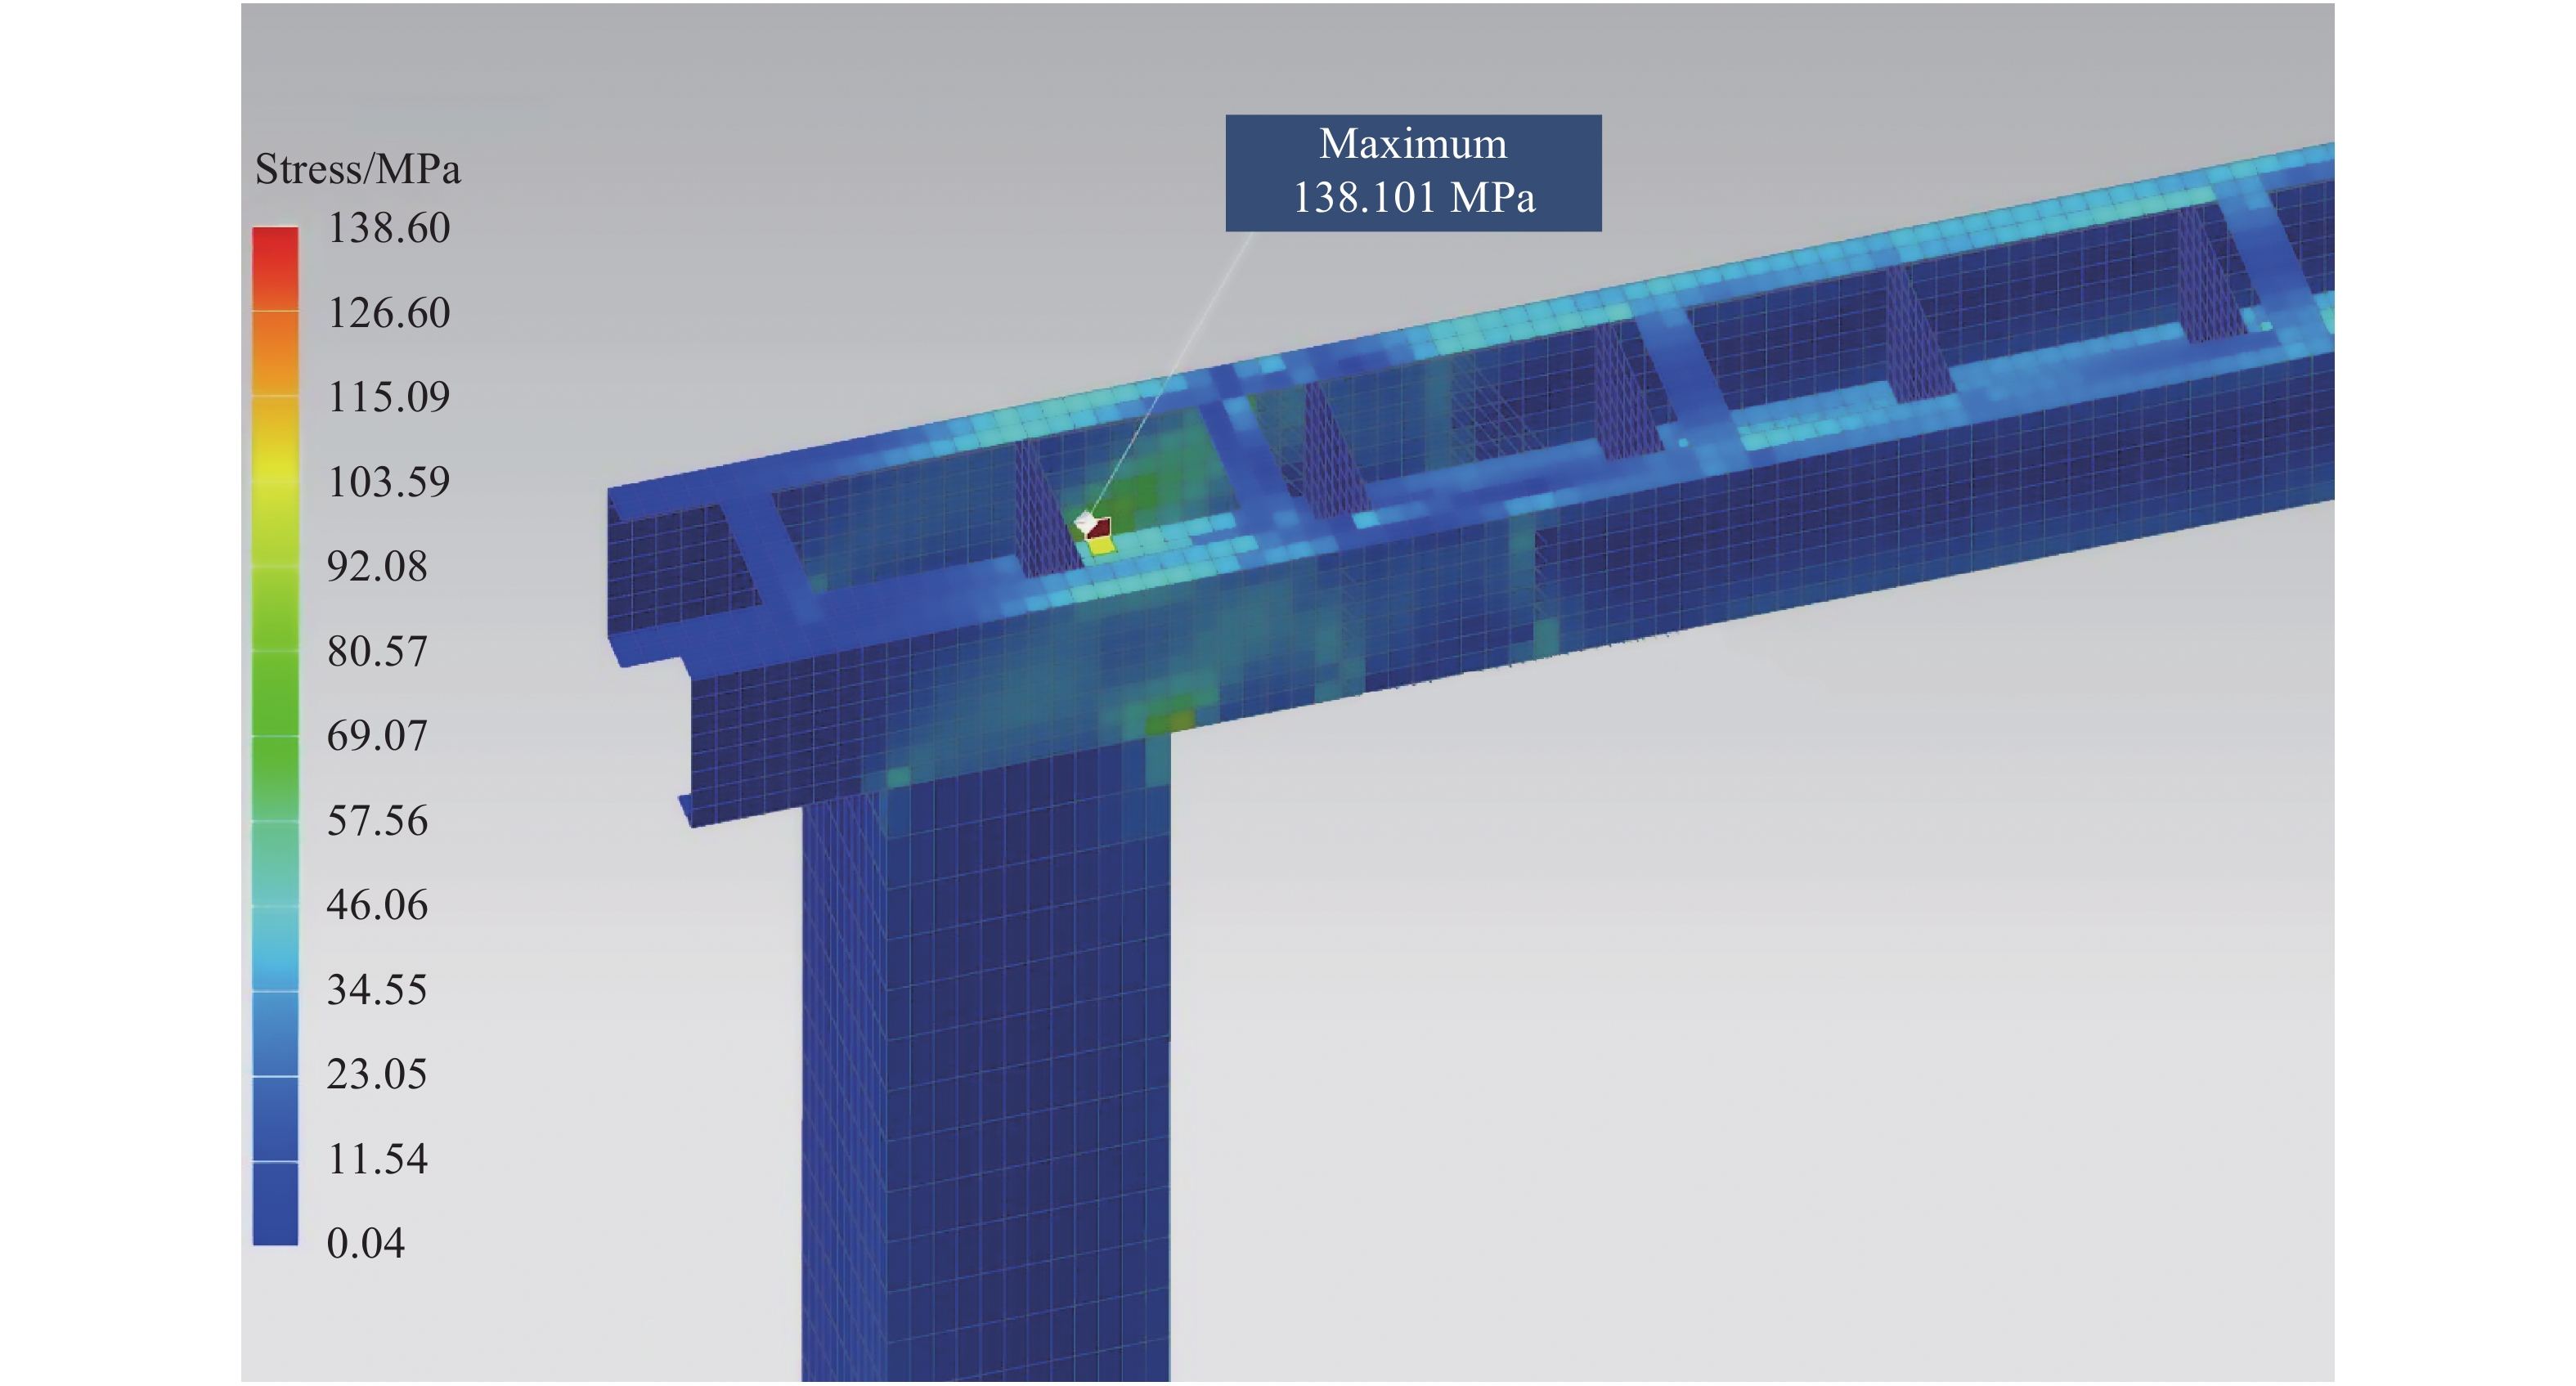
为了对光纤传感网络进行合理的布局,使其能够完全获取建筑物主体结构的应力场分布特征,首先对建筑物主体结构的结构体受力状态进行仿真分析。为了模拟楼宇内部主结构的应力分布,采用ANSYS仿真了支撑结构类型的钢框架在受到一定载荷时的应力场分布,仿真结果如图2所示。

Figure 2. Simulation diagram of stress distribution of supporting structure
如图2所示,这个主体钢框架结构是在受到外部冲击下产生的应力场分布,施力位于整个上梁体,用于模拟在建筑物受到一定冲击的条件下产生的应力场分布变化。仿真结果显示,这个结构中响应的最大值为138.60 MPa,最小值为0.04 MPa。主要的应力敏感区域集中在垂直支撑架与水平支撑架的连接位置的内侧,应力分布趋势以放射性发散的形式为主。通过该应力场仿真分布可知,在布设FBG传感网络时需要以连接位置为中心进行梯度布设,其中连接位置的FBG插入密度应该优于设计载荷范围最大值时的梯度变化线。而在其他部位的FBG插入密度可以适当降低,例如垂直支撑架的下部,可采用稀疏插值的方式完成结构体应力场的获取,这样既保证了整个主体结构应力场的构建精度,又减少了FBG传感器的总体数据量,提升了系统稳定性和降低了构建成本。
-
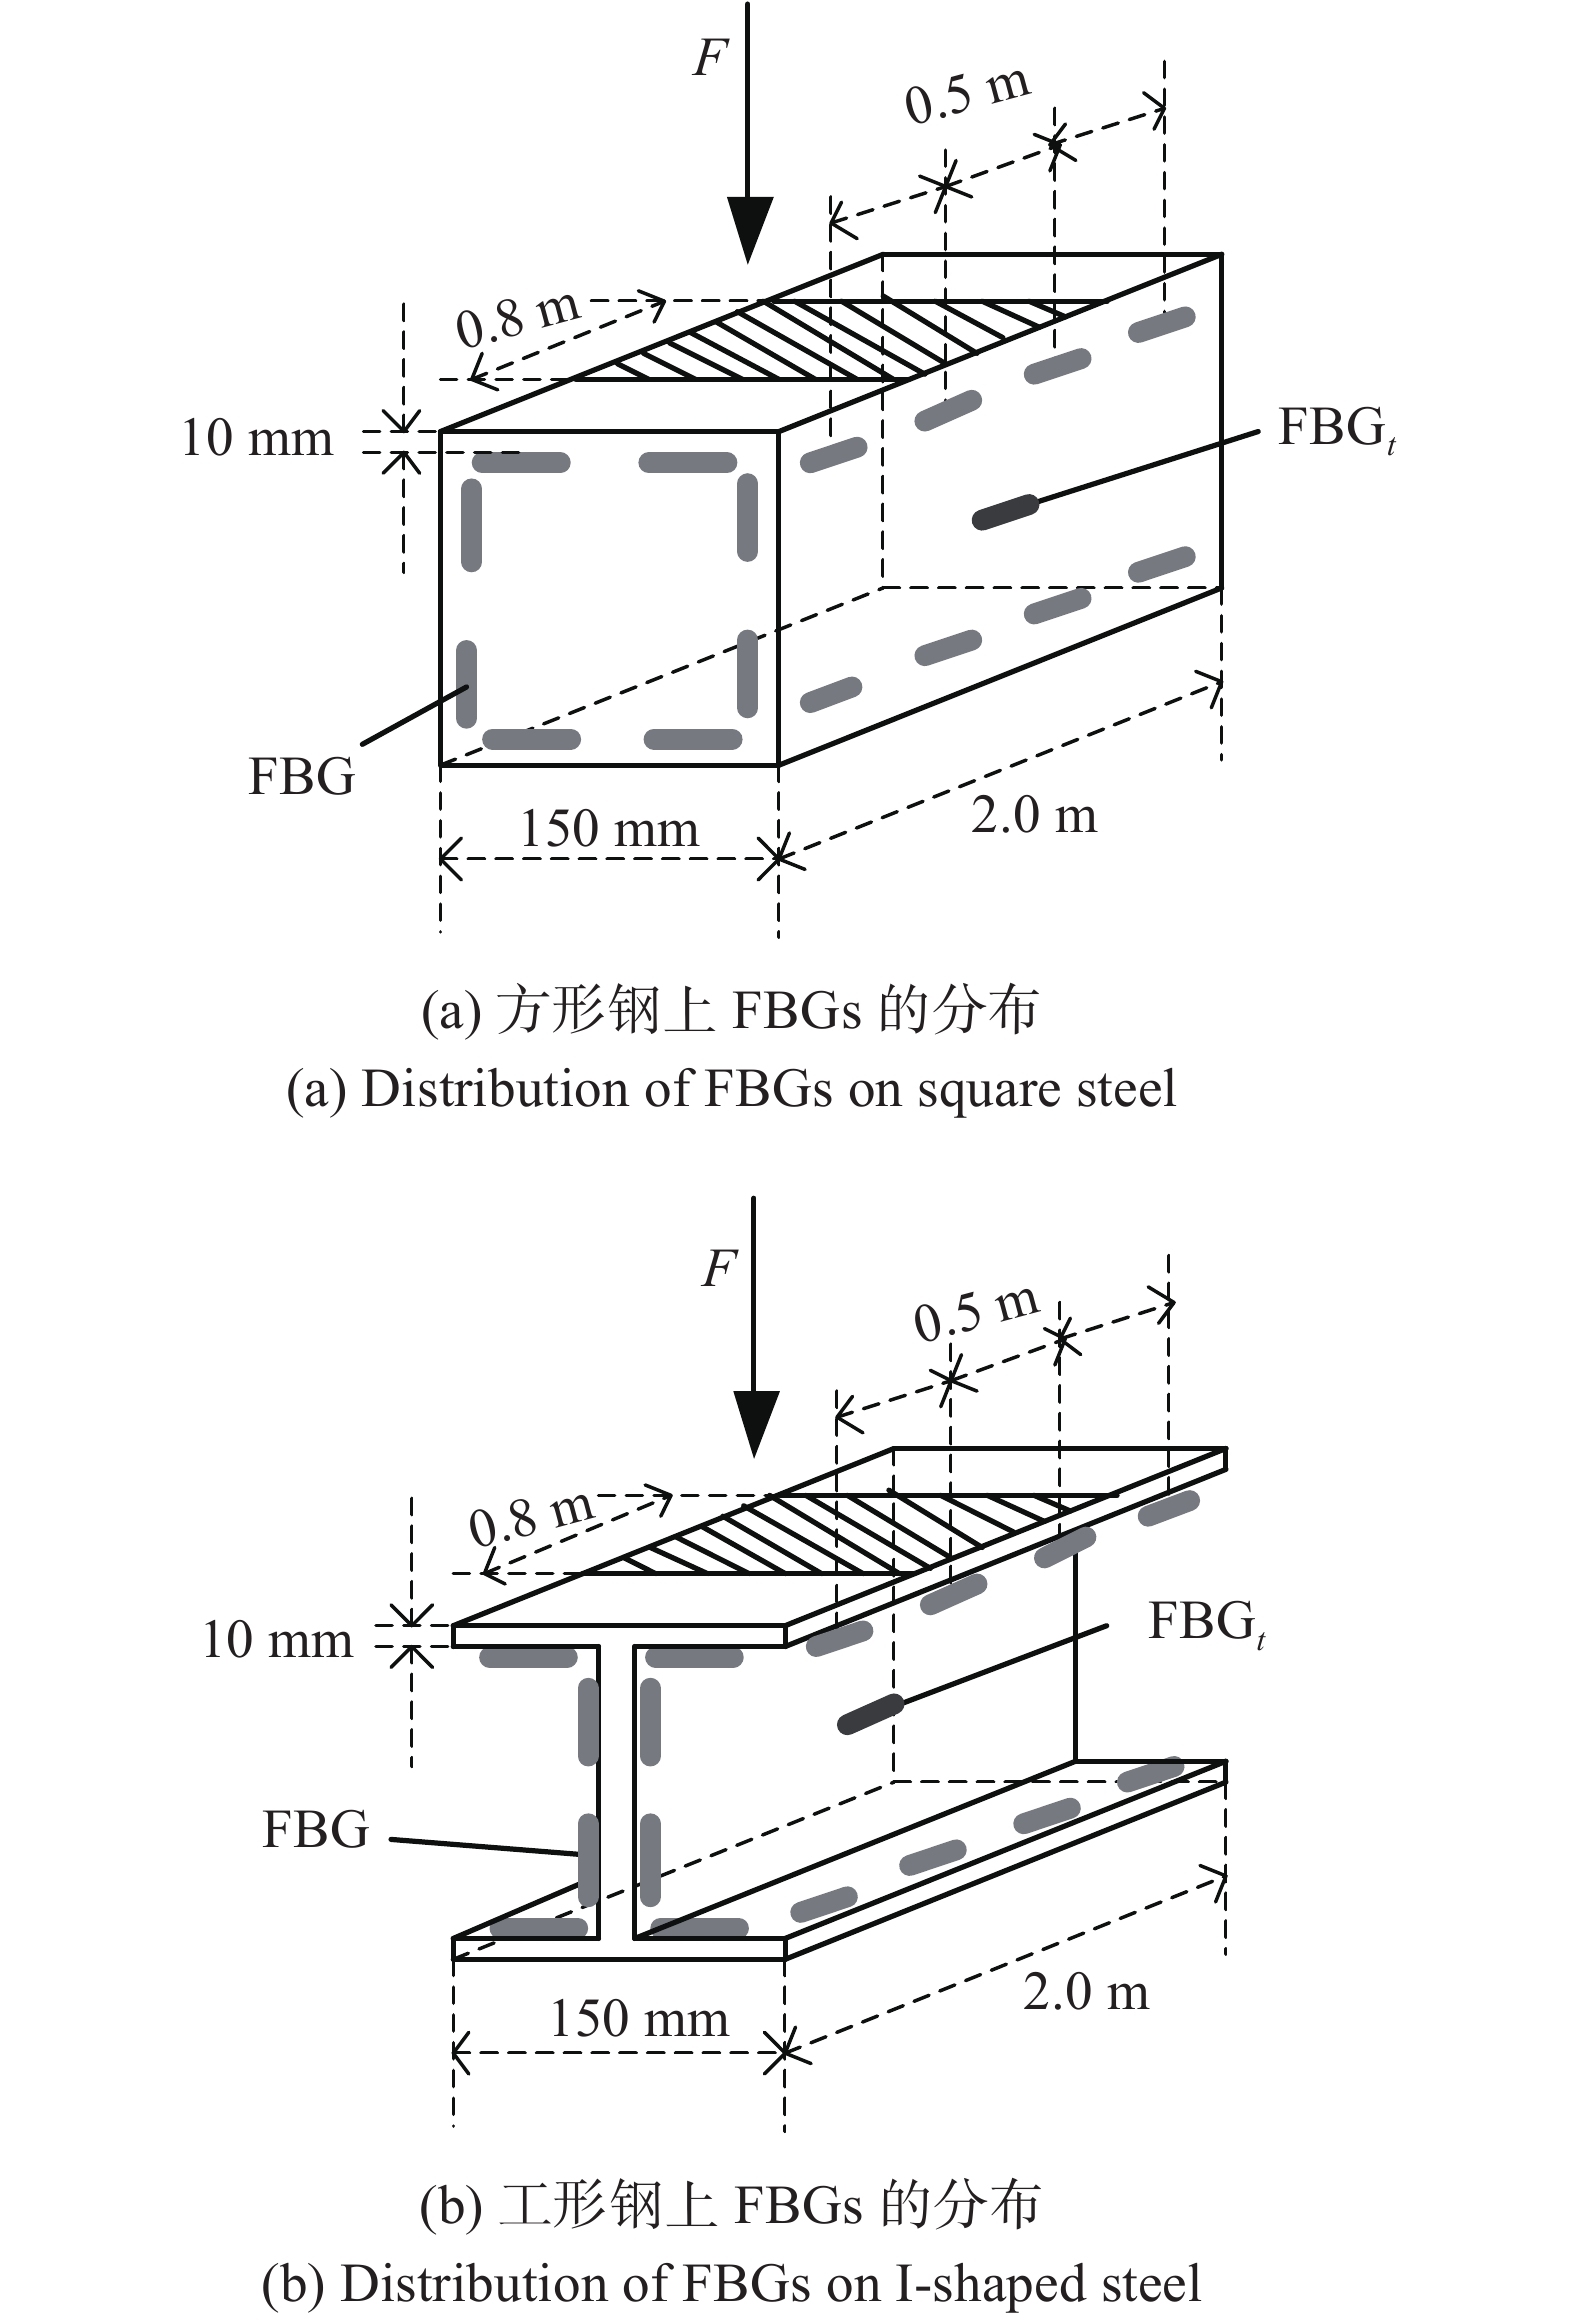
为了模拟建筑物主体结构在载荷发生明显变化条件下的应力场变化,实验针对常见的方形钢和工形钢模拟测试,分别搭建成果类似建筑物主体结构中的支撑结构。测试结构长度2.0 m,载荷施加于目标梁的中间位置,宽度0.8 m。方形钢和工形钢长2.0 m,梁面宽度为150 mm,厚度10 mm。光纤传感网络分布主要有两个方向组成,一组是与梁方向平行,分布于梁上部支撑板的下表面,另一组是与梁方向垂直,分布于垂直支撑架与梁相接的位置及每间隔0.5 m位置的梁体上。分布设计如图3所示。
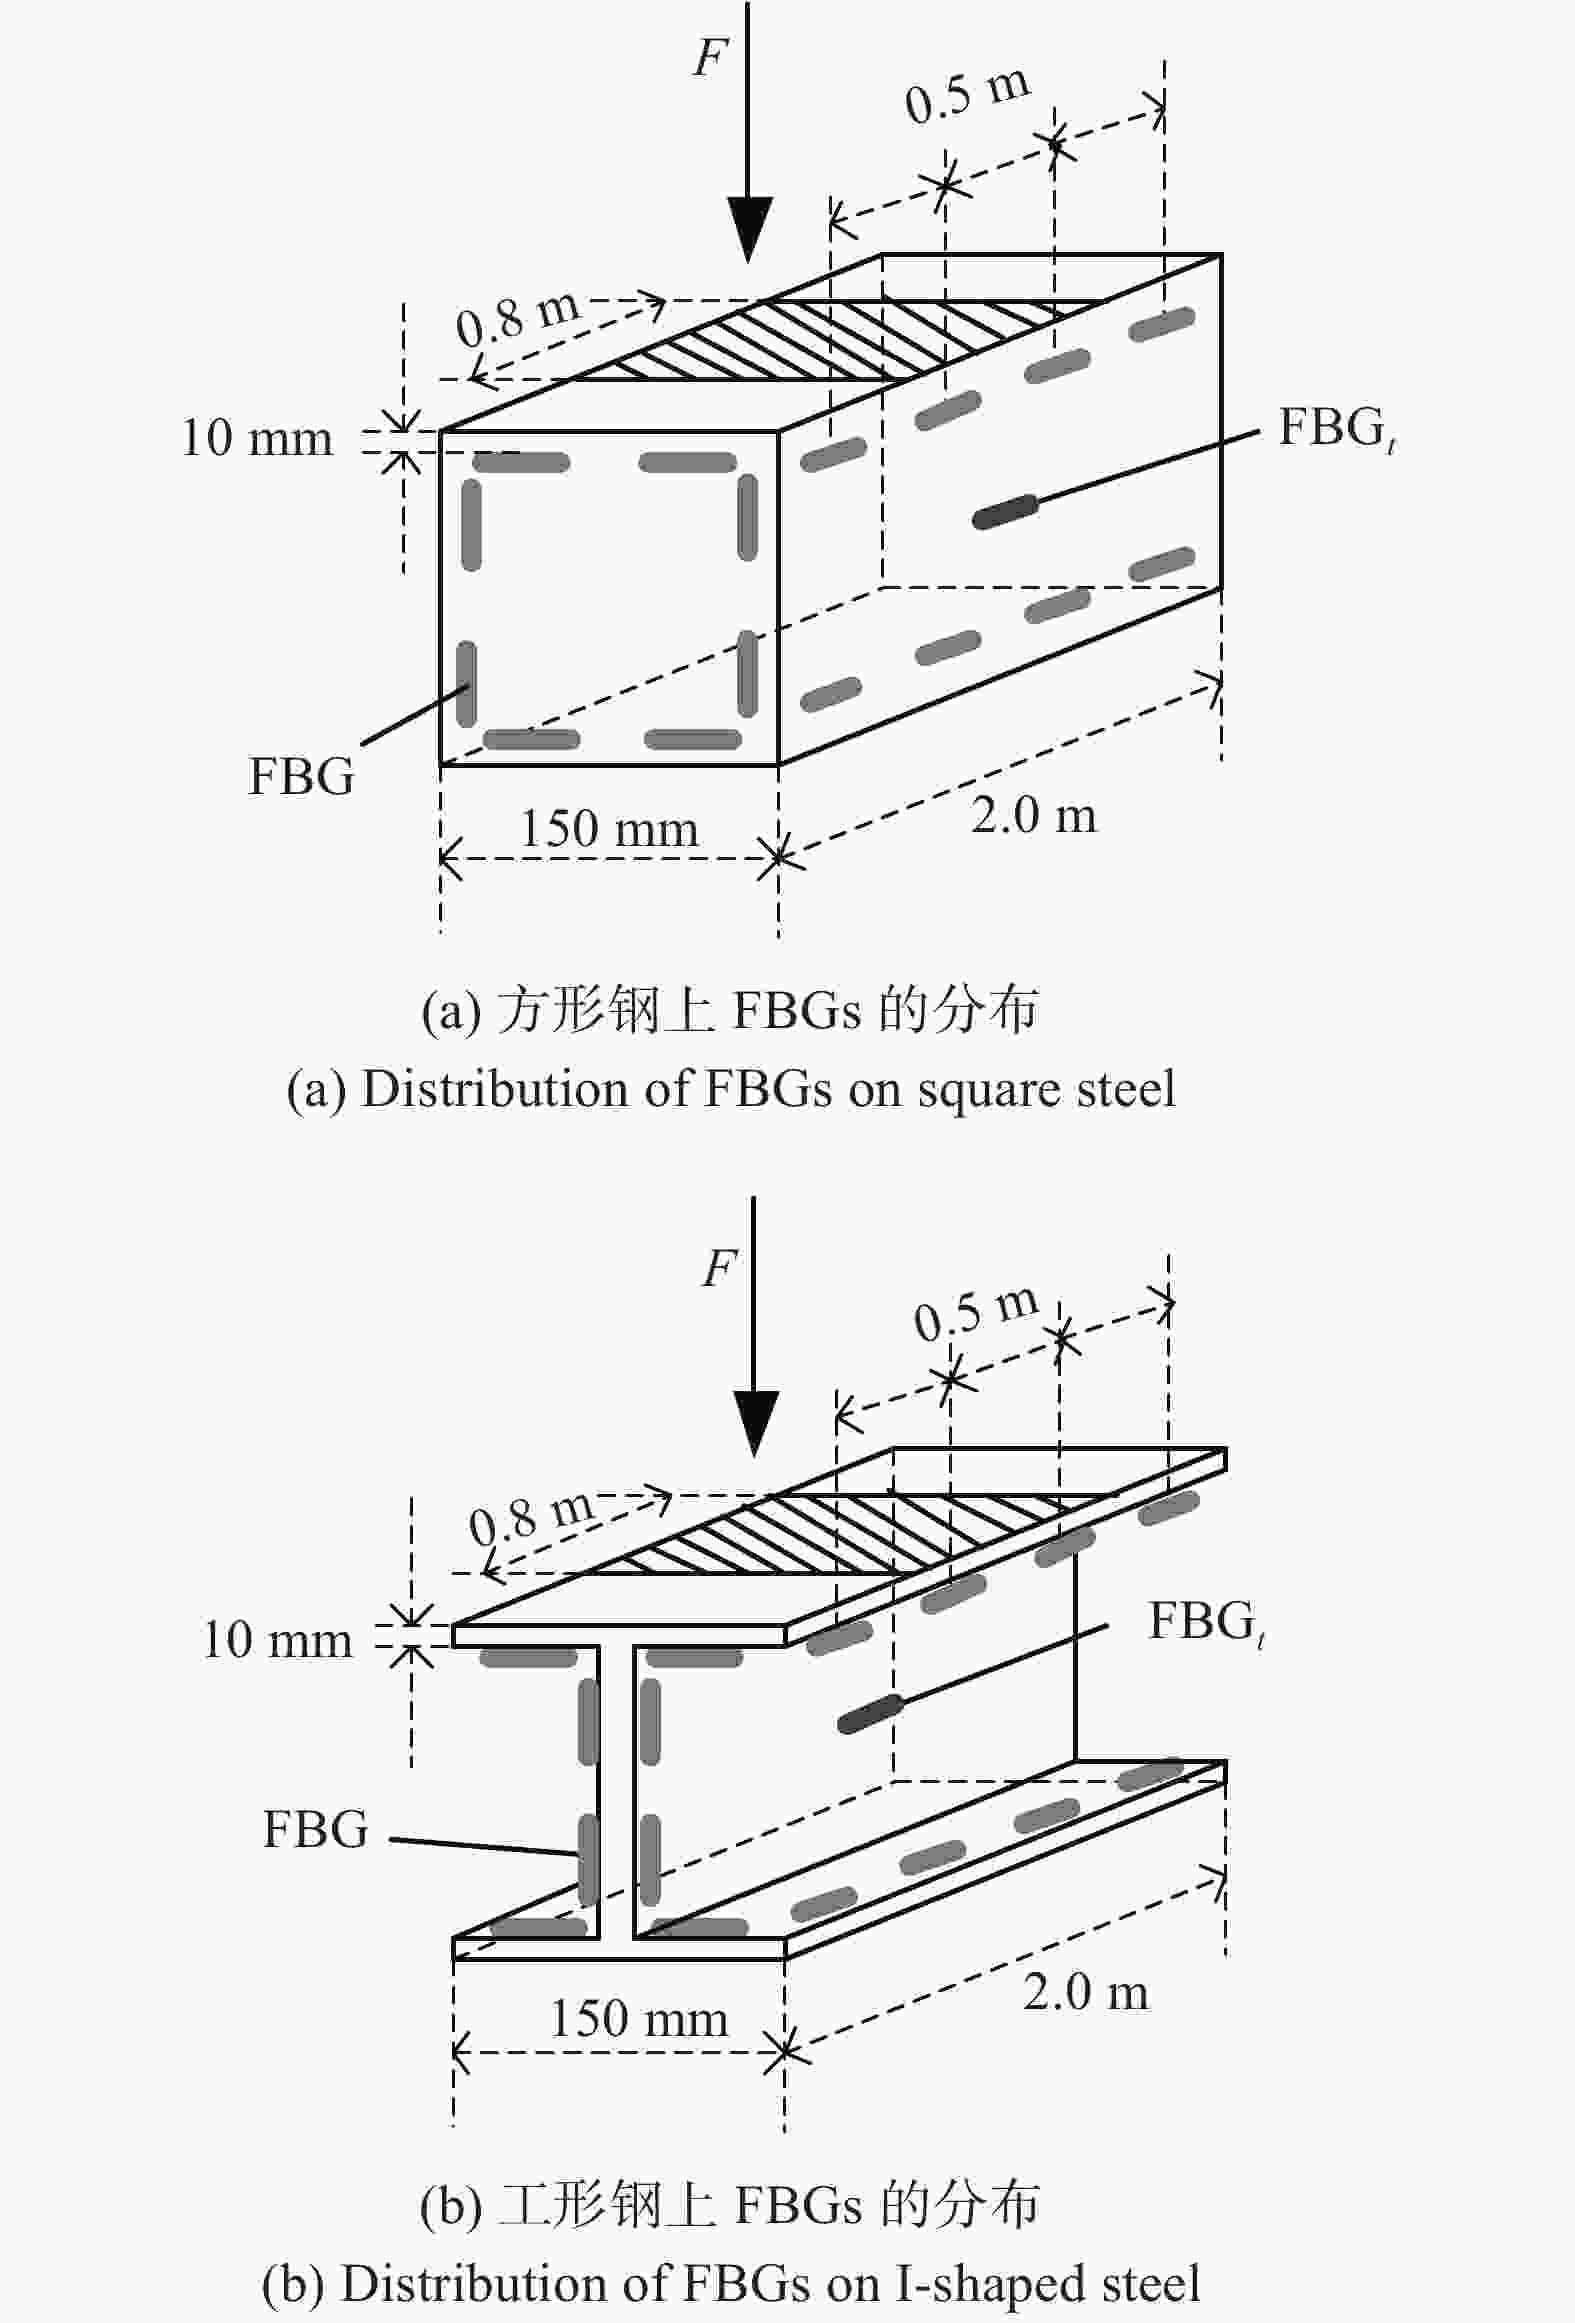
Figure 3. Schematic diagram of stress loading position and FBGs distribution
-
光源采用1630~1660 nm激光,通过波长调制完成对整个FBG网络的扫描,由于建筑物应变场属于缓变信号,故采用10 Hz工作频域。解调部分才与之相应的滤波方式得到FBG中心波长偏移量。
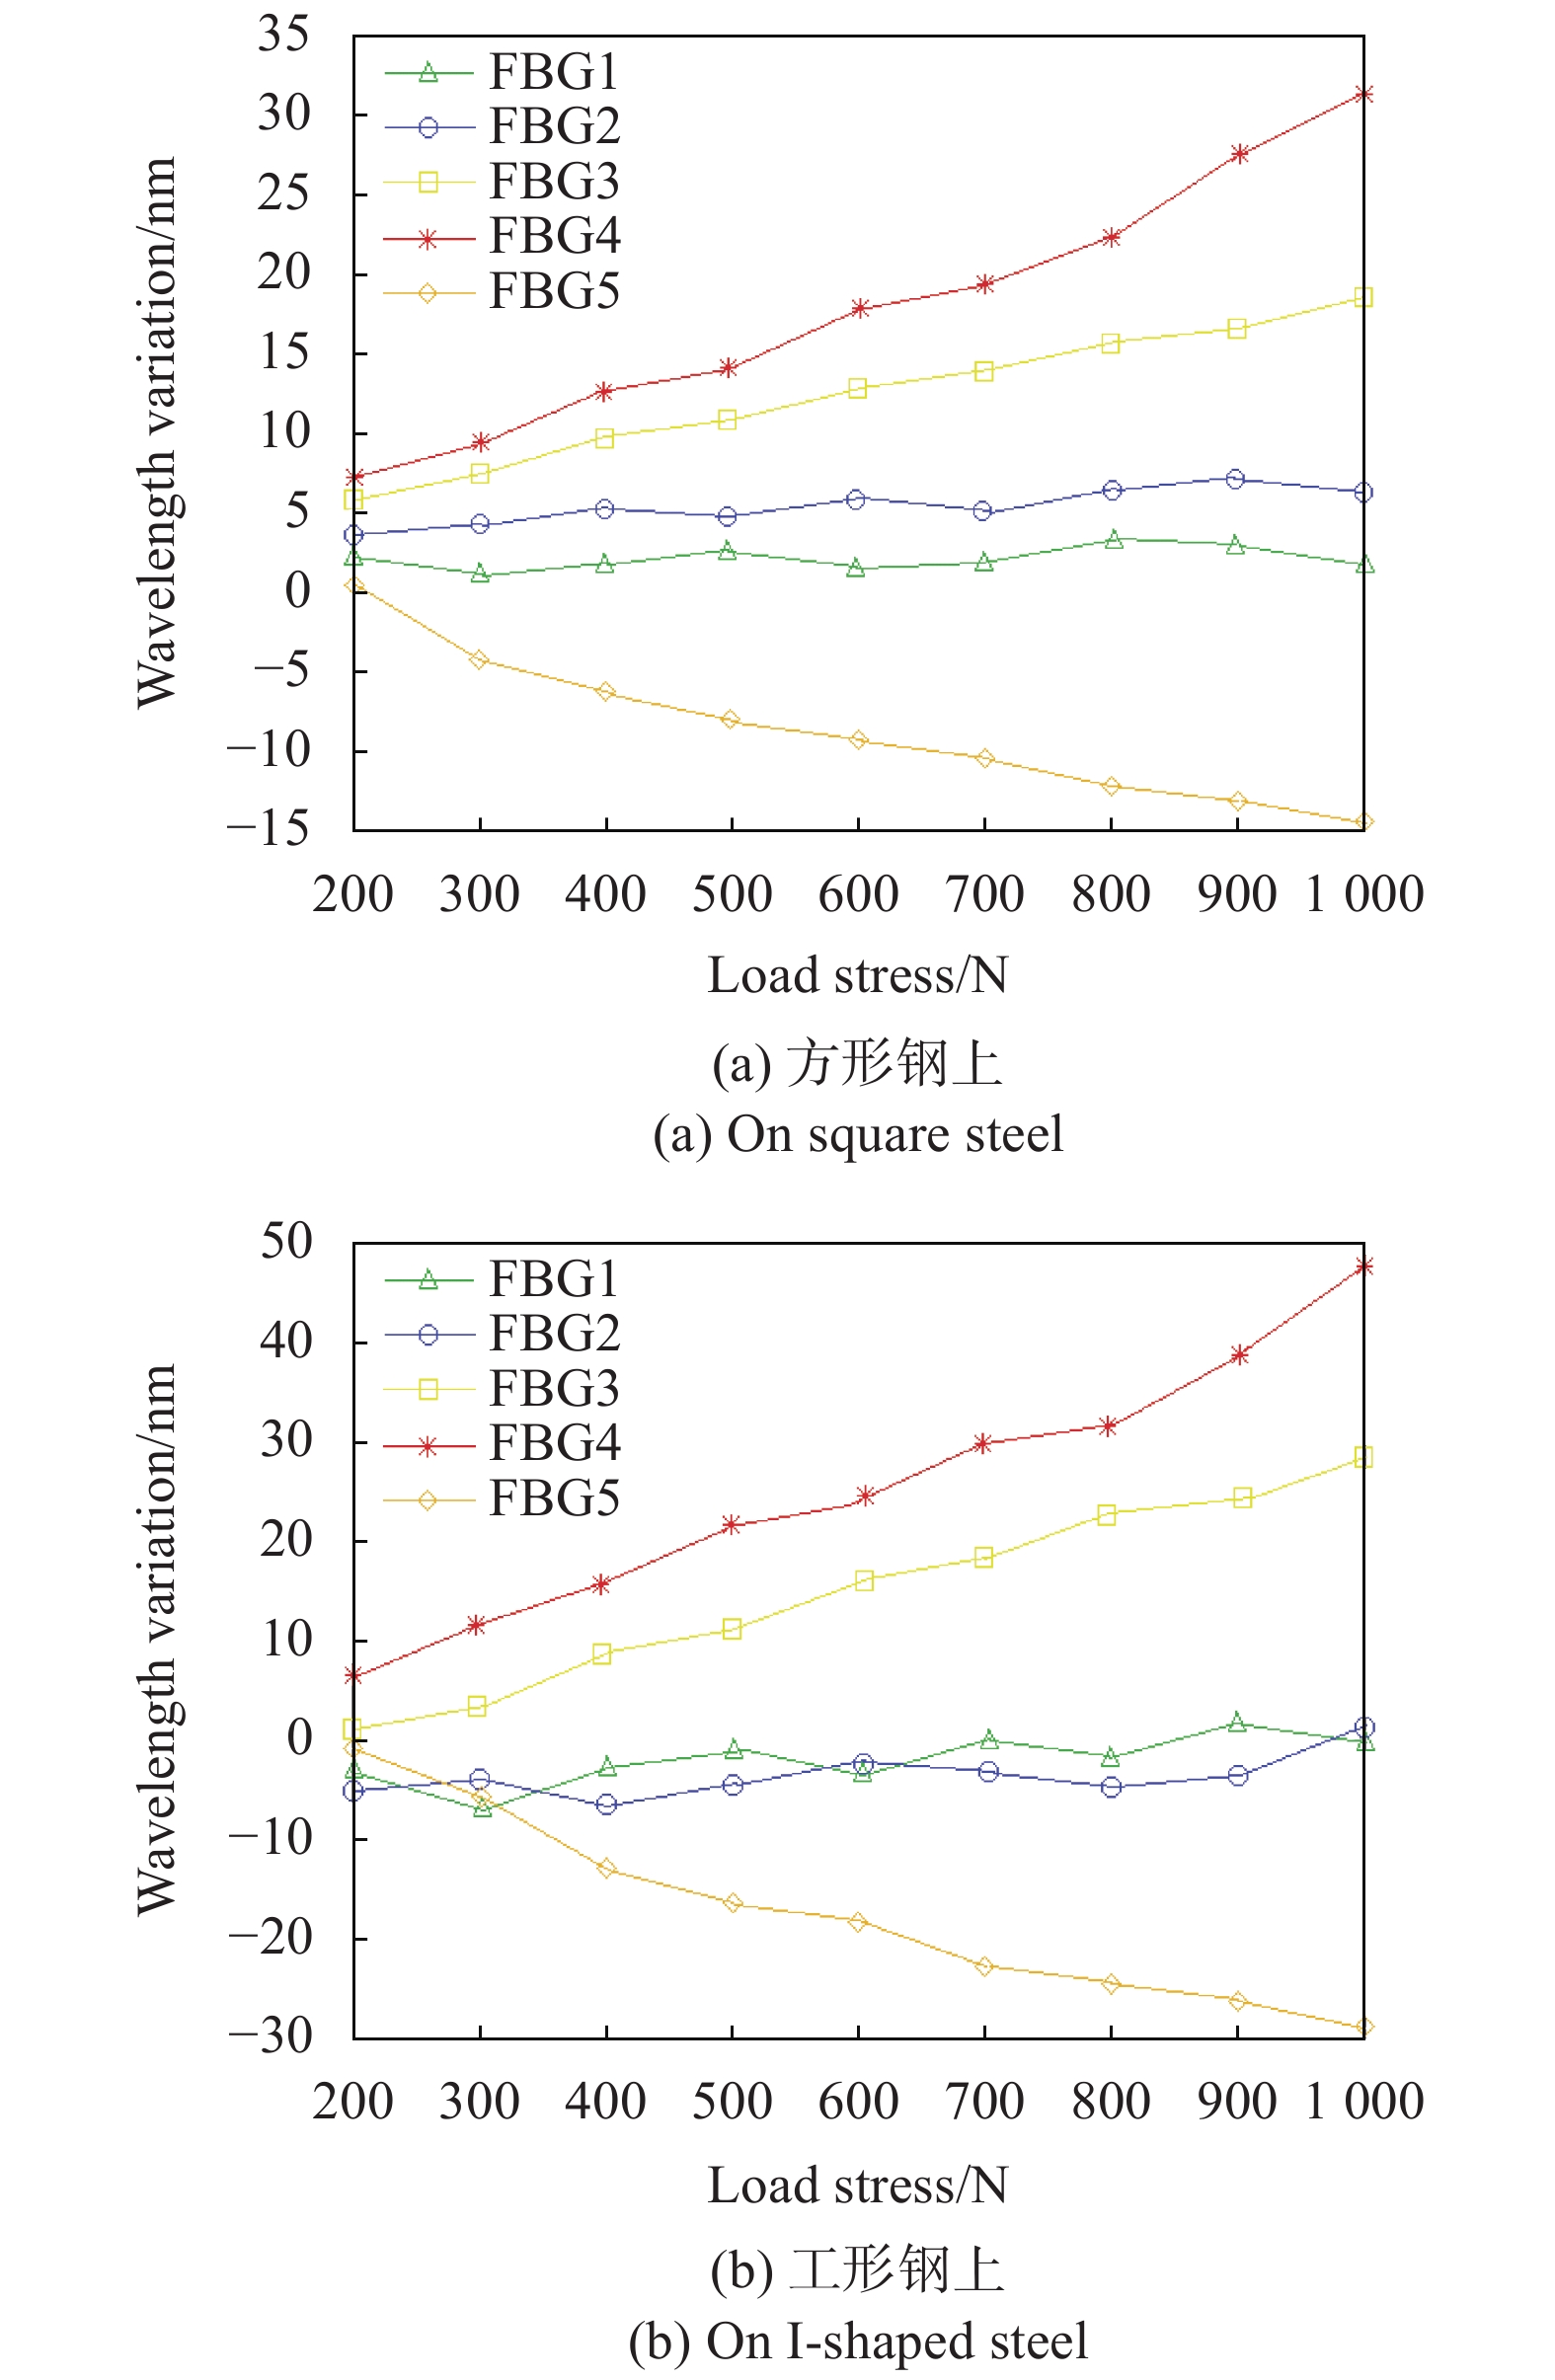
测试时在两组测试体结构中分布的FBG获取载荷从200~1000 N时其对应的波长响应值,其中按照分布位置主要分为三大类:一是在交叉位置的敏感区域(FBG1,FBG2),二是在施力平面位置与竖直平面位置的稳定区域(FBG3,FBG4),三是在应力施加位置的反向区域(FBG5)。对于方形钢测试结果如图4(a)所示,对于工形钢测试结果如图4(b)所示。
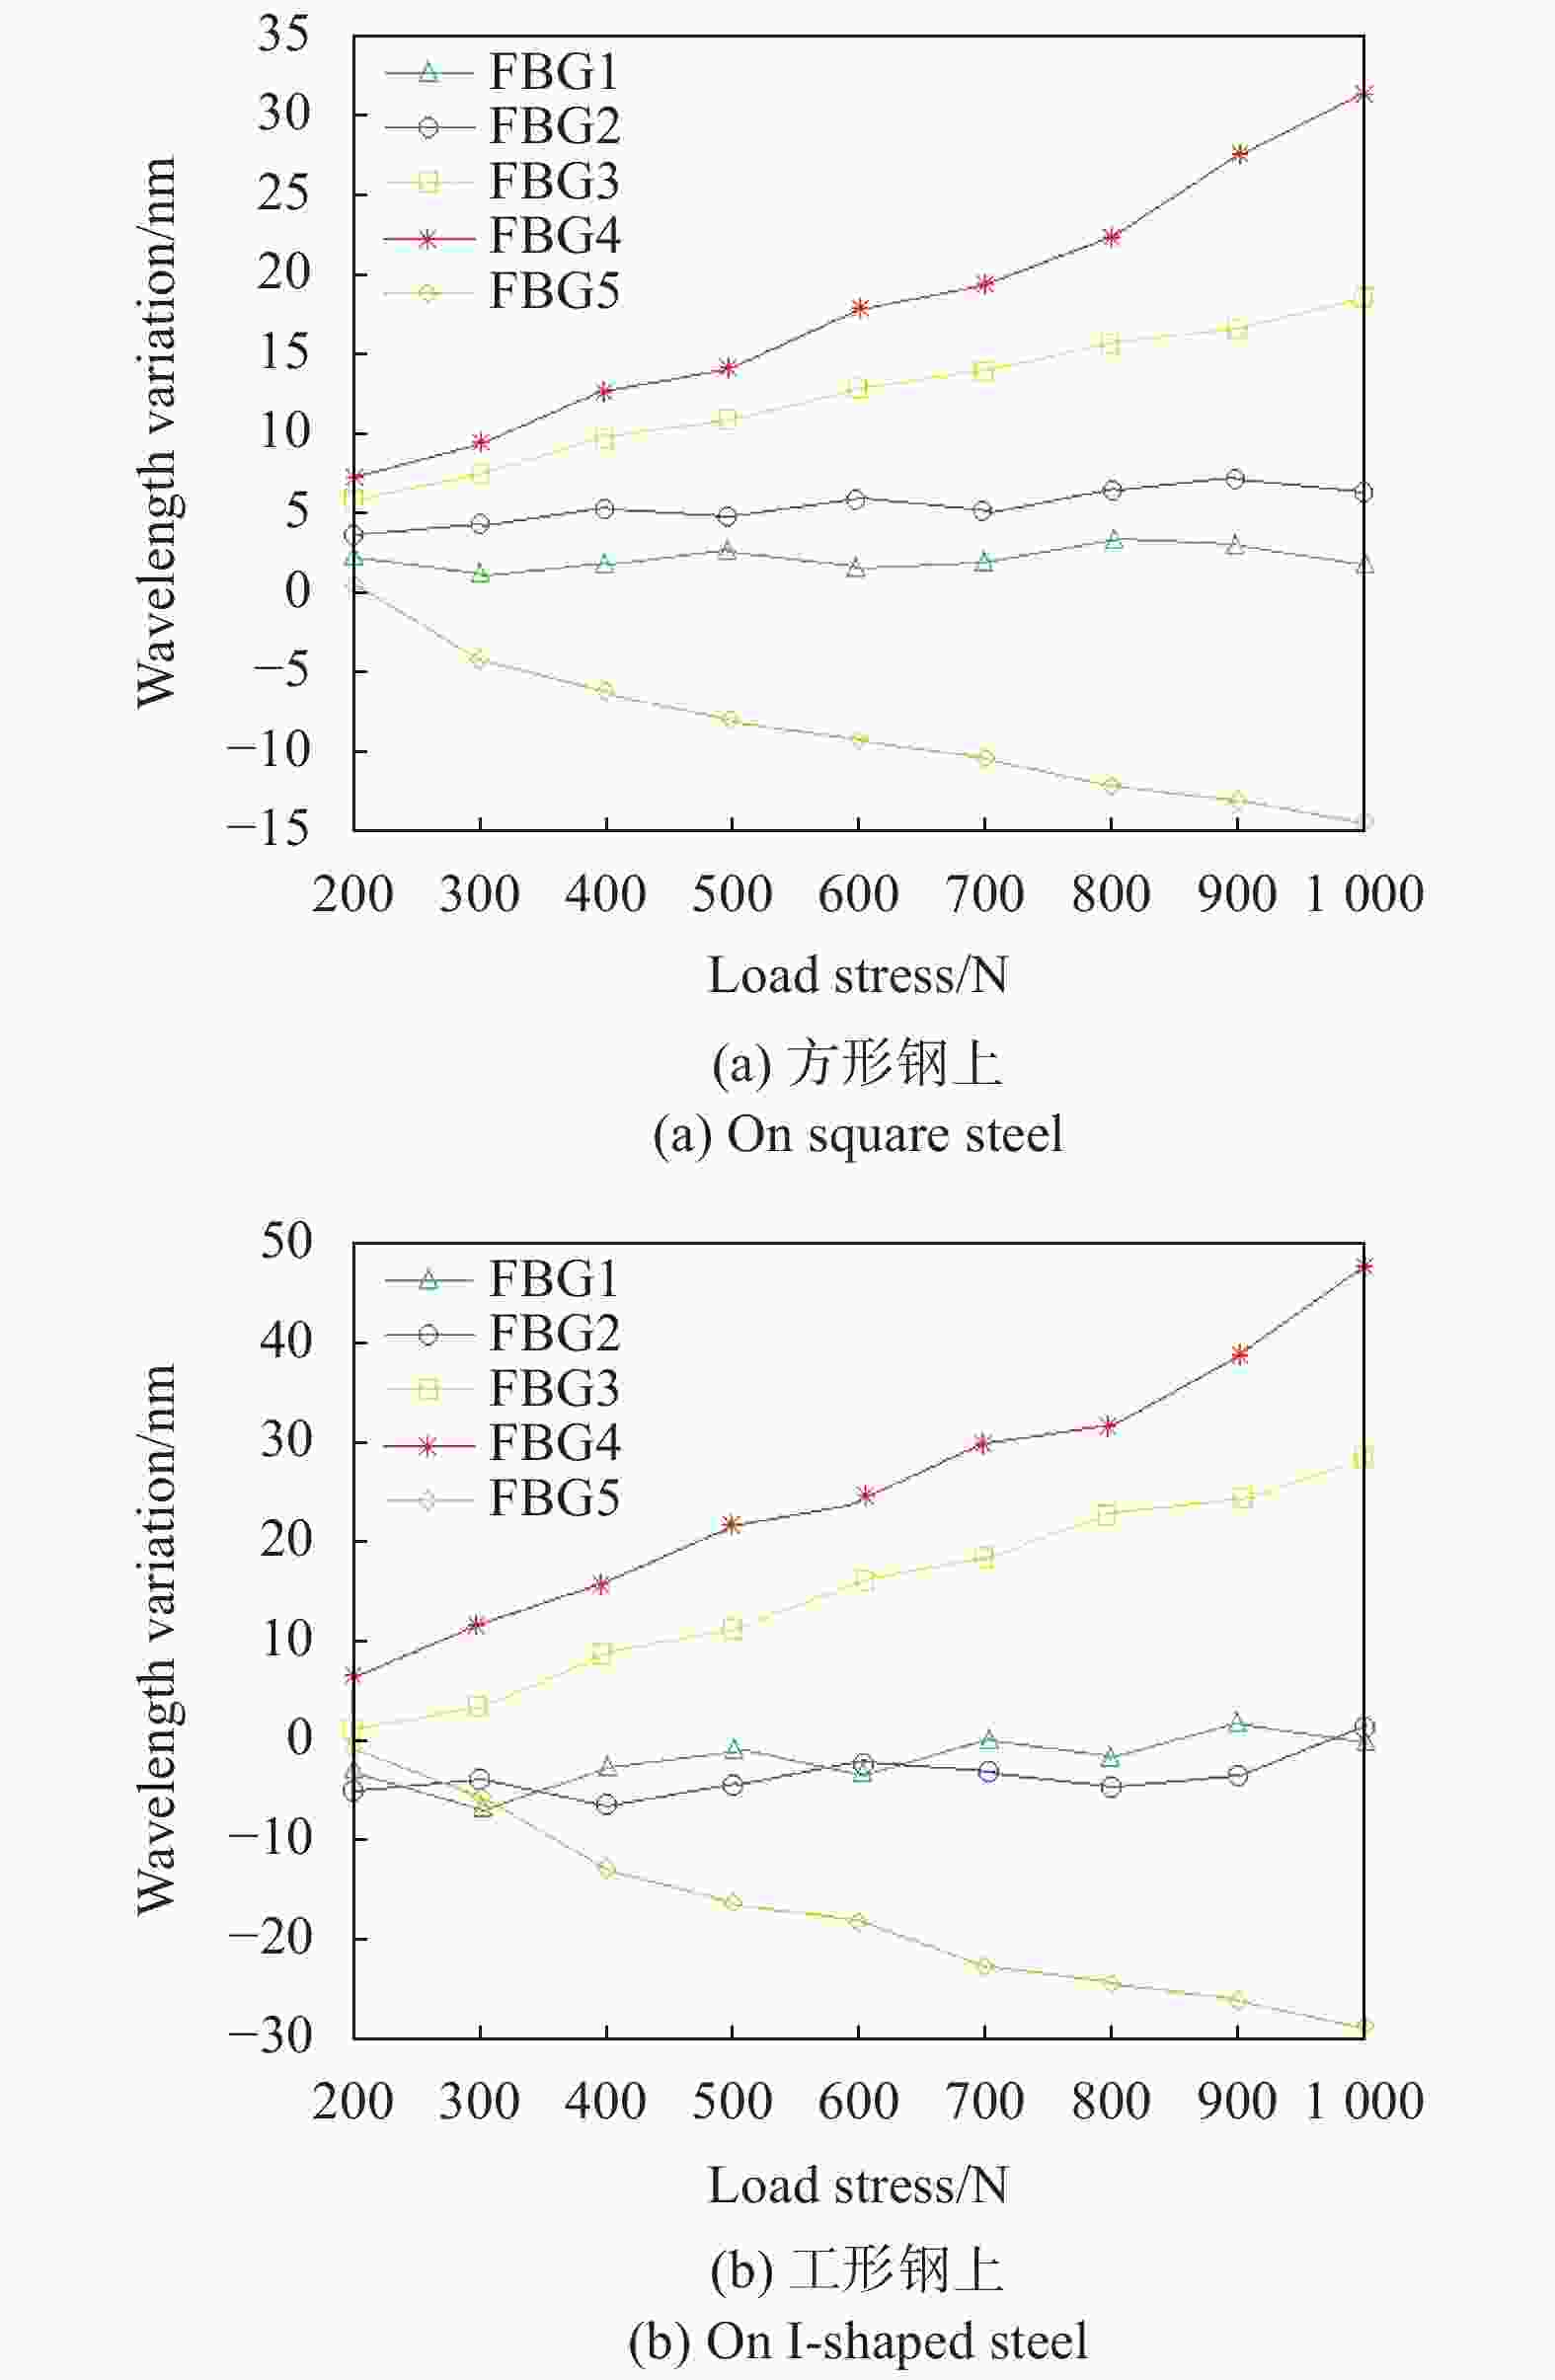
Figure 4. Response curve of FBG at the main characteristic position
由图4(a)可知,对于方形钢而言,FBG1在其水平梁与垂直梁的交叉位置处,其响应效果最为明显,在整个载荷递增过程中,波长偏移约25 nm。相比之下,随着应力场梯度位置不同,距离约0.5 m位置处的FBG2的波长偏移量减小,总偏移量约为16 nm。而在平面位置与垂直平面位置的测试值并不具备单调性,而是存在一定的波动,波长基本没有变化,可见这两个位置的应力场敏感程度很低,这和FBG的位置是有关系的。最后,在应力施加位置的反向区域,波长偏移量为负值,与应力位置相反,其说明形变方式与FBG1和FBG2正好相反,即压缩与拉伸的关系。由图4(b)可知,工形钢的应力响应曲线斜率大于方形钢,说明其在相同载荷的施力条件下变形程度更明显。但从其三个分布类型的响应曲线变化趋势可以看出,其规律与方形钢上FBG的回波特征是一致的。再有了FBG传感网络对待测件的应力-波长测试数据后,就可以根据上文中采用的验算方法完成对模拟建筑物在受到载荷时的位置偏移进行解算了,从而为建筑物健康状态提供数据支撑。
-
实验中为了对比该系统的测试效果,采用ODISI6100型分布式解调仪在临近位置进行测试,其空间最小采样间隔优于1 mm,应变测试范围±12000 με,应变测试精度±30 με。与此同时,将两组测试结果与ANSYS仿真值进行对比,测试数据如表1所示。
Stress value/N Position deviation/mm Error ANSYS ODISI System 200 0.0425 0.034 0.037 8.8% 400 0.0854 0.081 0.090 11.1% 600 0.1256 0.120 0.115 4.2% 800 0.1637 0.169 0.154 8.3% 1000 0.2024 0.212 0.202 4.9% Table 1. Comparison of square steel test data
由表1可知,当载荷逐渐增大时,三种方法的位置偏移都呈增大趋势,从测试数据的总体分布中可以看出,仿真分析计算值普遍大于实际测试值,分析认为由于仿真分析是通过理论计算得到的,而实际测试的过程中有噪声的引入,再抑制噪声的过程中,会对信号强度有一定的抑制。对比ODISI系统和本系统的测试结果可以看出,分布规律基本一致,测试误差除400 N应力加载时都优于10%,符合设计要求。表2与表1的测试数据分布规律相似,但单位应力对应的偏移程度有所不同,相比之下,工型钢比方形钢的测试结果更明显,应力响应效果更大,这与其结构有关。对比两表之间的数据可知,模拟方形钢条件下应力与位置偏移量的平均比率是1.99×10⁻⁷ m,模拟工型钢条件下应力与位置偏移量的平均比率是2.79×10⁻⁷ m。综上所述,该模拟实验验证了测试系统可以获取在受到外界额外载荷条件下的应力场分布,并依据此完成主体结构的位置偏移计算,为建筑物结构健康提供风险分析的数据依据。
Stress value/N Position deviation/mm Error ANSYS ODISI System 200 0.0624 0.063 0.059 6.3% 400 0.1151 0.121 0.111 9.9% 600 0.1658 0.172 0.164 4.7% 800 0.2139 0.208 0.217 4.3% 1000 0.2627 0.269 0.287 6.5% Table 2. Comparison of I-shaped steel test data
-
文中针对建筑物结构健康监测中主体结构整体状态分析的问题,设计了基于弯度矩阵验算的应力场-位置偏移计算模型。通过仿真分析给出了渐变载荷条件下直角支撑梁结构的应力场分别,并根据其分布特性完成了测试点位的分布设计。实验通过与ODISI6100光纤检测仪进行对比发现,该系统中FBG的应变-波长响应度具有很好的线性特征,测试数据能够与布设状态很好的匹配,位置偏差测试结果误差均值基本在10%以内。综上所述,该系统适用于建筑物主体结构的健康监测,具有一定的应用前景。
Research on optical fiber sensor network monitoring system for building structural health
doi: 10.3788/IRLA20210263
- Received Date: 2021-04-23
- Rev Recd Date: 2021-05-10
- Publish Date: 2021-08-25
-
Key words:
- optical fiber sensing /
- structural health /
- bending calculation /
- state analysis
Abstract: The analysis of the overall stress field distribution and state parameters of the main structure in building health monitoring is a bottleneck problem in the online state assessment technology. In order to comprehensively and consistently reflect the overall state information of the building, an optical fiber sensor network system was designed for the main structure of the building. A mapping algorithm was proposed, which established the relationship between the stress field information in the main structure and the position offset data of the overall structure. According to the theory of material mechanics and deflection, the deflection matrix was used for the conversion of stress field and displacement field. The simulation analyzed the distribution law of the stress field of the horizontal beam and the vertical beam in the main structure when the external load was applied, so as to provide a quantitative basis for the laying of the sensing unit. In the experiment, square steel and I-shaped steel were used to simulate the main structure. The load external stress range was 200-1000 N, fiber grating strain sensors were selected as sensing unit, and the same type of temperature sensors were used to compensate for temperature drift. The test results show that the intersection of the horizontal beam and the vertical beam is the most sensitive. The wavelength shift can well reflect the stress field distribution. The total amount of wavelength shift at this position is about 25 nm. At a gradient distance of 0.5 m, the total wavelength shift is 16 nm. The average error of the position offset of the main structure calculated is 7.46% and 6.34% based on the wavelength offset data. The average ratios of the corresponding stress to position offset for square steel and I-shaped steel are 1.99×10⁻⁷ m and 2.79×10⁻⁷ m, respectively. It can be seen that the system can test and calculate the overall health of the structure.

 DownLoad: