


-
荧光光谱分析技术因其灵敏度高、重复性好、数据充足的特点在水质分析及相关领域得到许多科研工作者的青睐[1-3]。但是由于信息过于复杂,需要借助平行因子分析算法[4]将复杂物质的三维荧光光谱分解为多个代表因子荧光团。该算法将荧光信号分解为相对独立的荧光因子而加以鉴别,从而提高了准确性。平行因子分析算法最早应用于心理学研究中,是一种基于三线性分解和交替最小二乘原理的高维张量分解算法。在分析三维荧光光谱过程中,平行因子分析算法通过建立因子模型来确定各个荧光组分峰的位置,避免了主观因素的影响,简化了分析过程,提高了分析的灵敏度,完成了对物质内部组成的分析。在包括水质检测[5]、信号处理[6]、数值分析[7]、医疗卫生[8]、图像分析[9]等多个领域得到应用。一般来说,因子数目只和物质内部组成有关,不受激发光和其他外界因素的影响,因此可以反映物质内部组成,因子数目过少,则会分解不完全,造成大部分信息损失,因子数目过多,则会造成因子冗余,因此确定合适的因子数目模型是该技术的关键。由于平行因子分析模型复杂度较高,因此可以从多个方面对因子数目进行选择,如残差分析法、核一致诊断法、负载曲线判断法等[10]。但由于各类因子数目选择标准的评价侧重点不一致,甚至在实际应用中会存在不同的选择标准给出的结果不同的现象,目前大多数研究中仅使用某一种方法来进行因子数目的选择,或使用多种因子数目选择方法,但使用流程不统一。针对平行因子法应用过程中存在的因子数目选择流程不明确的问题,文中提出了一种针对因子数目选择的改进流程。为验证该流程的准确性,分析浓度变化对溶液性质的影响,由于腐植酸在固定激发和发射波长作用下的因子分析结果已知,在室温下利用优级纯的腐植酸试剂配置了不同浓度的溶液,利用自行搭建的系统结合改进平行因子分析算法,实现对水中腐殖质的检测。
-
在数据上,平行因子分析法(Parallel Factor analysis, PARAFAC)将三维数据矩阵X分解为三个载荷矩阵,A、B、C,且每个矩阵都具有实际的物理意义[11]。具体见公式(1):
式中:
${\boldsymbol{X}}_{{ijk}}$ 为第i个样品在发射波长j、激发波长k处的荧光强度;${{a}}_{{if}}$ 为负载矩阵A的元素,和第f个组分占样品总浓度的比例有关;${{b}}_{{jf}}$ 为负载矩阵矩阵B的元素,和第f个组分在发射波长j处的荧光量子效率相关;${{c}}_{{kf}}$ 为负载矩阵C的元素,和第f个组分在激发波长k处的荧光量子效率相关;${{\varepsilon}}_{{ijk}}$ 为第i个样品在发射波长j、激发波长k处不符合三线性分解的数据。 -
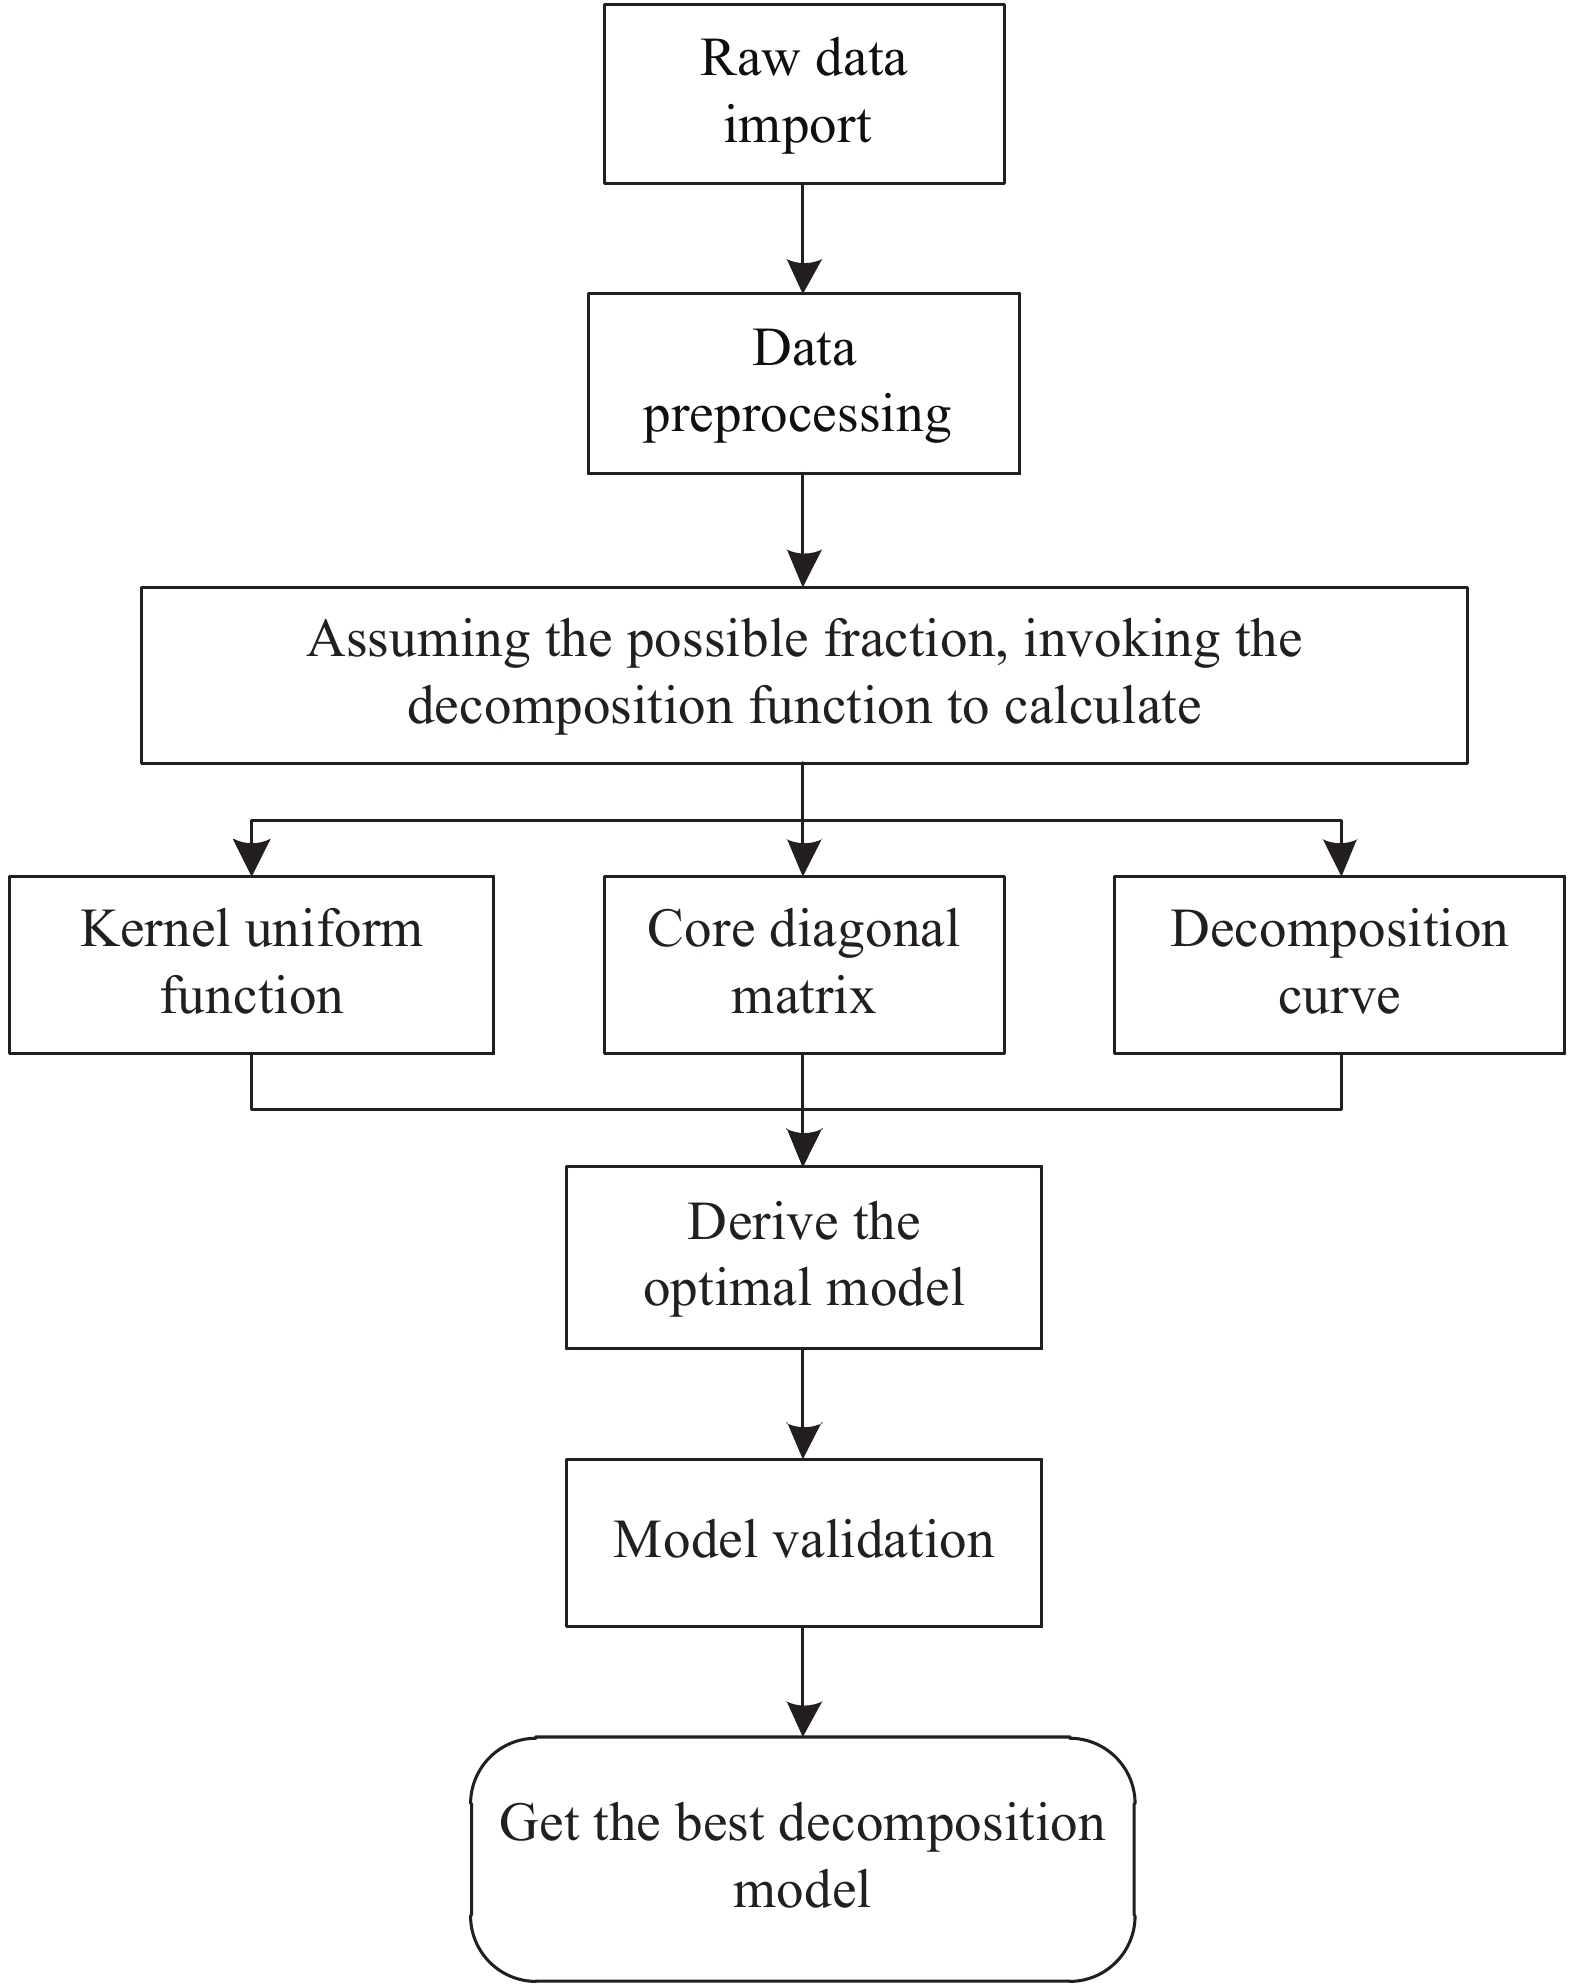
文中自行设计了平行因子分析算法,实现流程如图1所示。

Figure 1. Parallel factor application process
为了建立符合三线性分解的模型,首先需要保证所分析的数据符合三线性分解理论,其次进行离群点分析,去除对于模型影响过大的数据点或者波段。借助各种模型评价方法对各个因子下的模型进行判断。获得最优模型后,利用半分法验证模型的正确性,最后利用因子分解模块将所获得的因子导出,和由之前的科研工作者所探索出的标准物质表进行对比,最终得出因子所代表的物质,从而实现对复杂物质的分解。
-
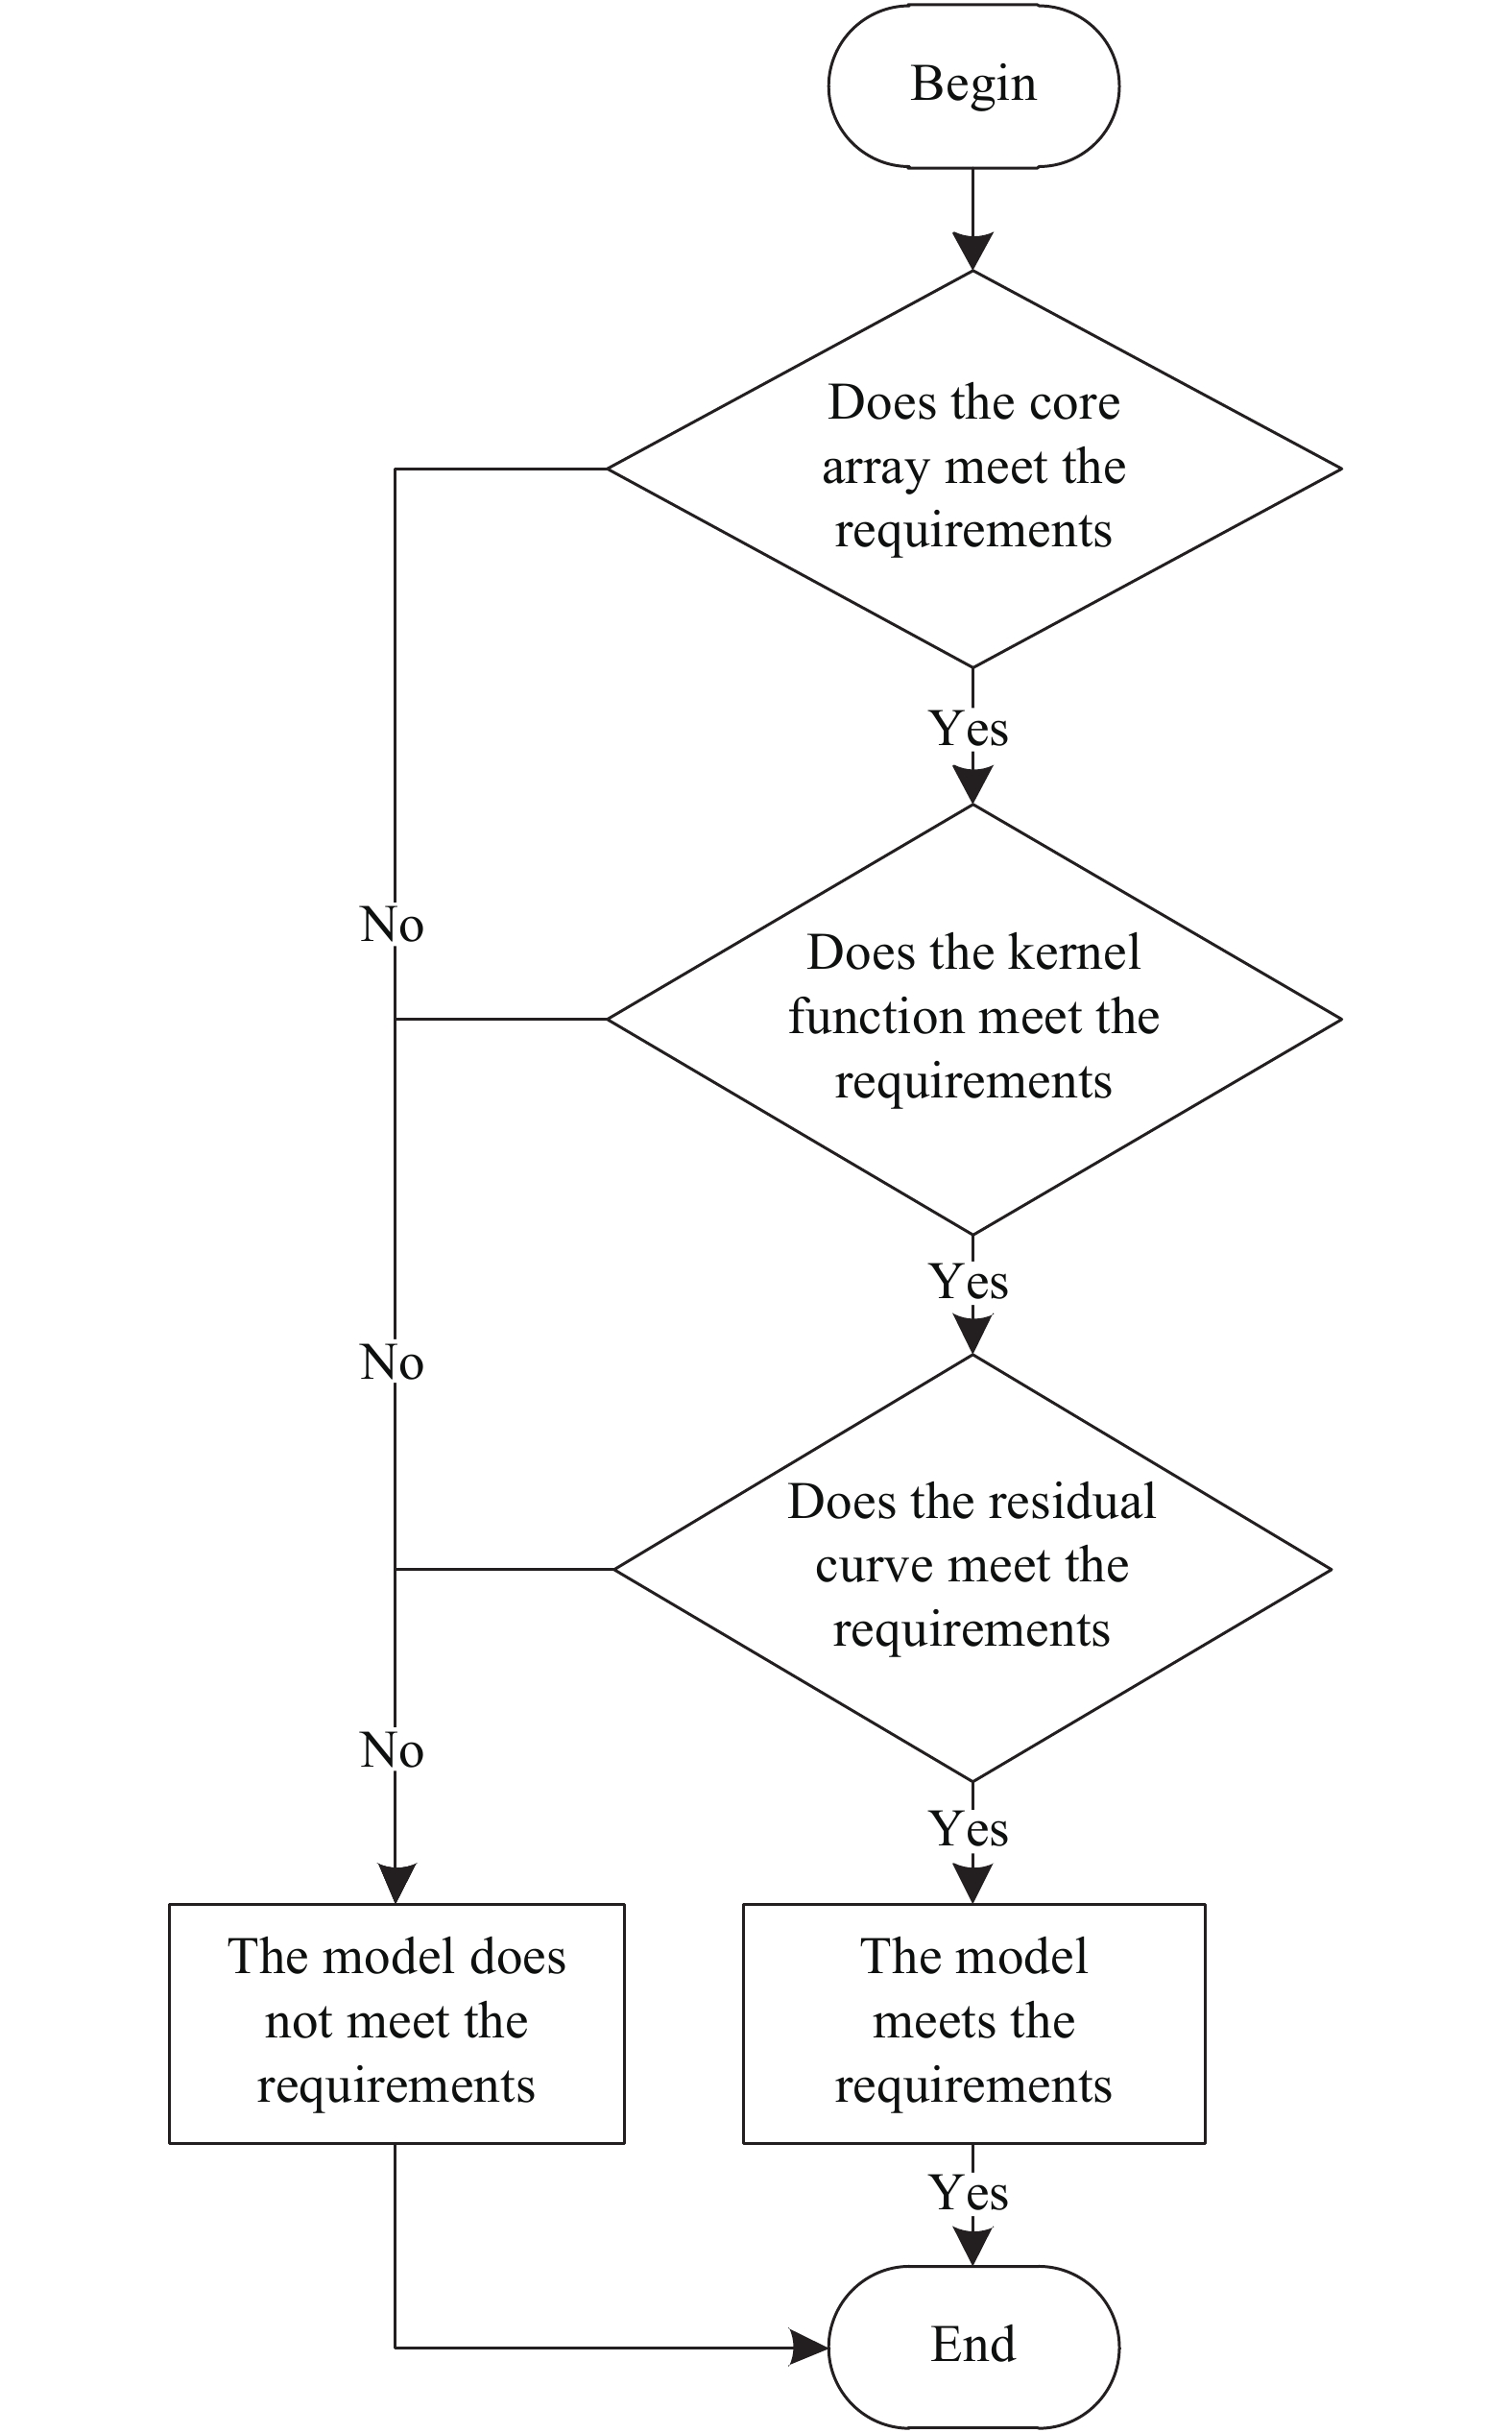
常见的因子数目选择标准有核心对角矩阵法、核一致函数法、恒波长残差值等。确定一个合适的模型评价流程使分解的模型准确性最优十分关键。从限制条件来看,核心对角阵要求核心阵的对角线元素应该为1,其余数值应该接近于0,条件相对宽松,因此将核心对角矩阵法作为评价标准的第一项。核一致函数法认为当核一致函数的数值在50%~60%时分解模型较为准确,该方法进一步缩小了因子数目的范围,若存在多个因子数目的模型都满足上述条件,可以通过观察拟合谱图与原始谱图的恒波长残差谱线来确认最终的分解模型。对于每一个因子数的模型,判断其模型是否符合要求的具体流程如图2所示。

Figure 2. Model judgment process
不同于传统的利用单一方法进行因子数目的选择,上述组合方法可靠性更强。若存在多个因子数目的模型都满足上述条件,为了使模型更加简洁,应使用因子数目较少的模型。
-
从检测水中腐殖质的实际需求出发进行三维荧光光谱检测系统的设计与搭建。结合检测的实际需求,双光栅单色仪工作波长为350~450 nm,光谱仪工作范围为340~650 nm,样品槽使用石英试管以保证紫外光的充分透过,系统的设计与实际组成图见图3。

Figure 3. Design and physical diagram of detection system
-
利用优级纯的腐植酸粉末配置浓度分别为20 mg/L、50 mg/L、100 mg/L、150 mg/L和200 mg/L共5个浓度的试剂进行检测,将不同浓度的数据进行归一化处理后导入分析程序中。借助因子数目选择流程完成对因子数目的选择,确定最优模型。因子分析中,因子数量一般不少于2个,不高于5个,腐植酸是的组成较为复杂,因此因子数上限为5。
(1)核心对角矩阵分布
首先获得腐植酸溶液的三维荧光光谱在因子数为2~5时的核心对角矩阵分布图。当选择因子数合适时,核心对角矩阵对角线的元素应该接近于1,其余接近于0。因子数为2~5时核心对角矩阵元素分布如图4所示。

Figure 4. Core matrix distribution of different factor models
经过分析发现,因子数2~5的核心阵都满足需求,即对角线元素偏向于1,其余偏向于0,当因子数目为4或5时,核心阵元素更偏向于0。需要进一步分析来判断各个因子下模型的优缺点。
(2)核一致函数
计算不同因子数目下模型的核一致函数数值,进一步选择模型。当核一致函数接近于100%时说明因子数目过少,接近于0时则说明因子数目过多,不同因子数目的核一致函数数值如表1所示。
Factor numbers 2 3 4 5 6 Numerical value 84% 73% 56% 51% 24% Table 1. Numerical change of kernel consistent function
由表1可看出:当因子数在4或5个时,核一致函数的数值在50%~60%之间,比较符合分解要求;当因子数为2或3时,核一致函数在70%以上,函数较高,不符合分解要求;当因子数为6个或者更多时,核一致函数数值过少,且降低的幅度过少,不符合残差比较要求,因此,因子数为4和5最为合适。
(3)恒波长残差值
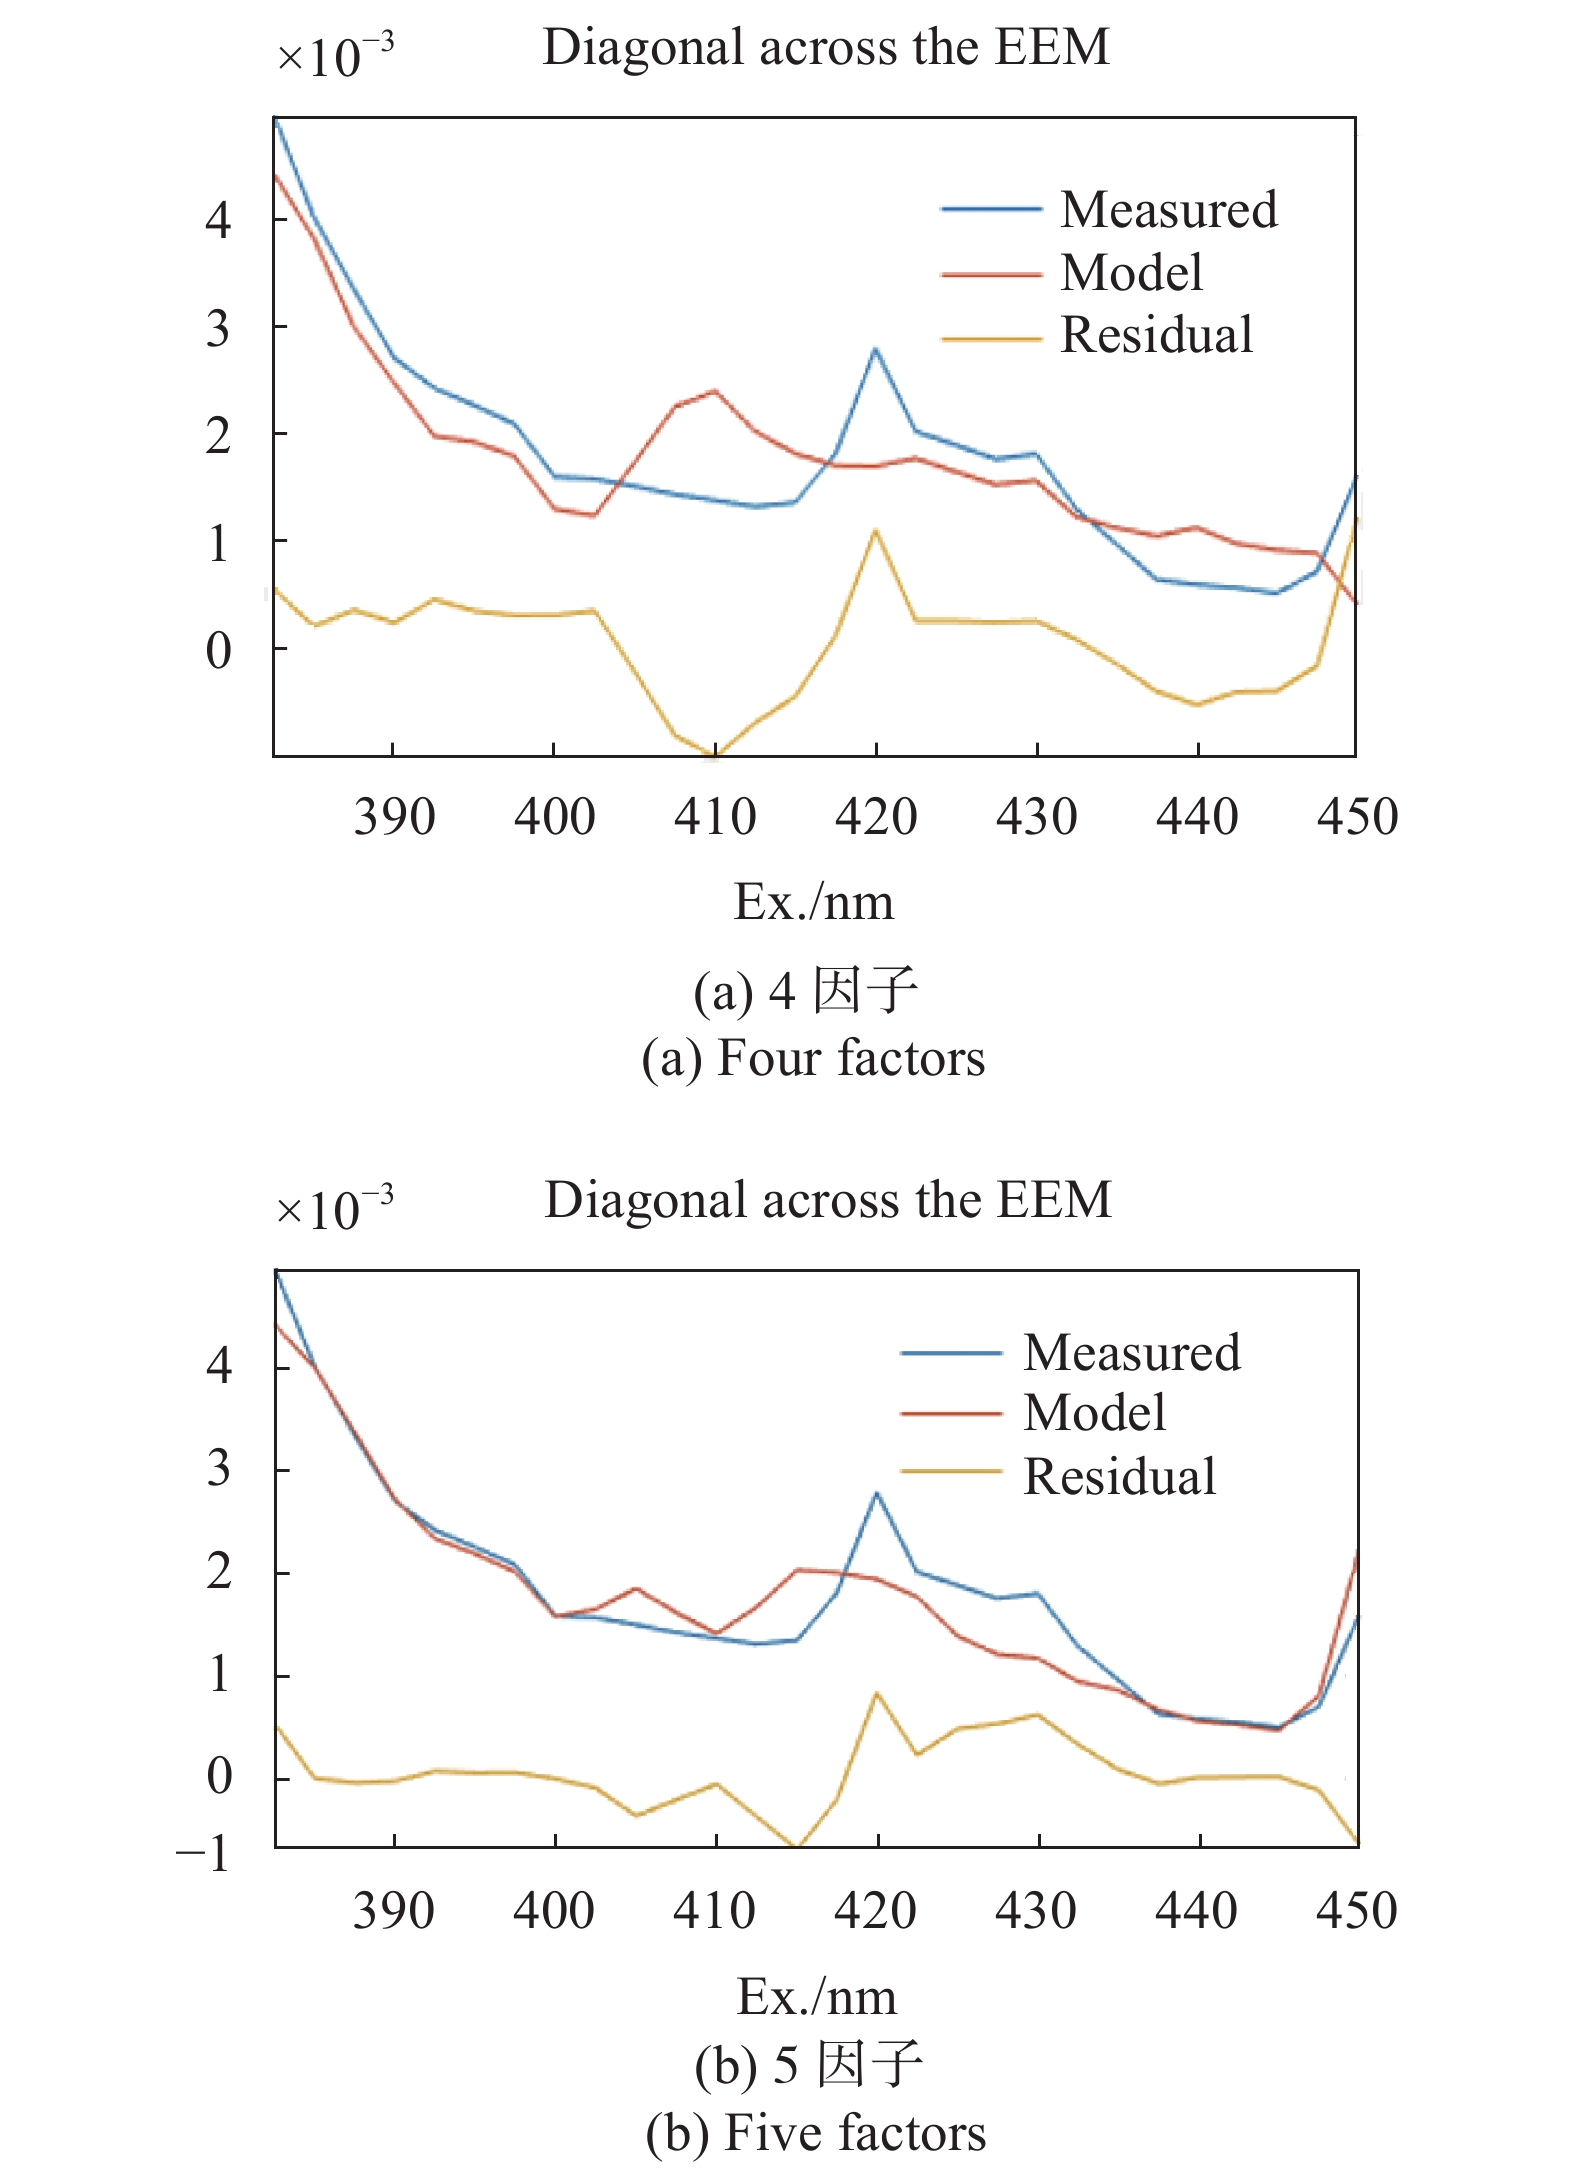
当因子数为4或5时,分析实测图和拟合图在恒波长同步荧光光谱图上的残差来进一步选择模型。因子数为4和5时恒波长残差图如图5所示。

Figure 5. Constant wavelength residual diagram with factor numbers of 4 and 5
通过仔细比较图5(a)和图5(b)所示的恒波长残差图示,当因子数为4时残差图效果图更优。
(4)综合分析
通过上述因子数目选择流程可以发现,核心对角矩阵法条件相对宽松,可以用来确定因子数目范围,核一致函数条件严苛,可以锁定因子数目,若存在多个因子模型的核一致函数满足要求时,需要进一步分析残差图进行比较,最后若存在多个因子数目的模型满足需求,则使用数目较少的模型以避免因子冗余。
-
不同浓度的腐植酸溶液导出了相同的4个因子,各个因子所在区间如表2所示。
Excitation wavelength/nm Emission wavelength/nm 360-370 450-500 350-360 450-500 365-375 475-525 380-390 475-525 Table 2. Distribution of humic acid factors
经过和标准物质表进行对比,可以发现上述因子分别为两个类腐植酸A类物质,一个类腐植酸C类物质,一个土壤富里酸物质。
-
为了探索溶液浓度对因子贡献率的影响,编写分析算法来分析各个因子的相对贡献率,由于平行因子分析技术关注的样品之间相对强度的差别,因此此处因子的强度并不是绝对强度,而是相对数值,反映的是因子之间的相对差异。图6反映了浓度为20 mg/L、50 mg/L、100 mg/L、150 mg/L、200 mg/L浓度从小到大时4个因子的占比,可见尽管浓度变化,由于其溶液性质并未改变,因子的占比相近不会发生巨大的变化。

Figure 6. Contribution rate of each factor under different concentrations
-
文中针对平行因子分析法因子数目选择流程不明确的问题提出了由核心对角阵-核一致函数-恒波长残差图组成的选择流程,利用自行搭建的三维荧光光谱检测系统和自行编写的平行因子分析算法对水中腐殖质进行研究以验证模型的准确性。经过分析,该流程利用核心对角矩阵法确定了因子数目的范围,进一步利用核一致函数限制因子数目,最后若存在多个因子数目都满足上述要求,则使用残差图法进行对比,相较于之前单一的因子数目选择方法逻辑性更强,在实际应用中效果更好。研究结果表明,在室温下对优级纯的腐植酸溶液进行分析,当因子数为4时,核心对角矩阵分布满足需求,核一致函数数值为52%,残差数值最小,相较于其他因子数目模型拟合效果最优。因此确定在激发光和发射光分别在350~450 nm/350 ~620 nm时,共分解出4个因子,第一类因子的峰值的激发波长与发射波长分别位于360~380 nm/450~500 nm,这是典型的类腐植酸A类物质所在的区域,一般与腐殖质内部结构中的羧基与羰基有关。第二类因子峰值的激发波长与发射波长分别位于380~420 nm/475~525 nm,这是典型的土壤富里酸类物质所在的区域,一般是腐殖质内部中萘类有机质引起的。第三类因子峰值的激发波长与发射波长分别位于390~410 nm/475~500 nm,这是典型的类腐植酸C类物质所在的区域一般是腐殖质内部中还原性醌类物质引起的。且不同浓度下各个因子贡献率变化不大,即尽管溶液浓度发生了很大变化,但溶液的性质本身没有改变。
Design and verification of improved factor number selection process for parallel factor algorithm
doi: 10.3788/IRLA20210362
- Received Date: 2021-06-02
- Rev Recd Date: 2021-07-05
- Publish Date: 2021-11-02
Abstract: In order to solve the problem that the selection process of the number selection of model factors in the decomposition of three-dimensional fluorescence spectrum by parallel factor algorithm is not clear, an improved factor number selection process composed of core diagonal matrix, kernel uniform function and constant wavelength residual graph was proposed. The improved parallel factor analysis algorithm was developed to verify the accuracy of factor number selection process with humic acid as detection material. The results show that, combined with the above process, when the excitation light and emission light are in 350-450 nm/350-620 nm, respectively, and the factor number is 4, the core diagonal matrix distribution meets the demand, the kernel consistent function is 52%, the residual error of the fitting diagram is the smallest, and the decomposition effect is the best in the standard region. Compared with using a single method, the above combination process is more logical and accurate, and can quickly determine the number of factors in practical application. The four factors are two humic acid factor A located at 360-370 nm/450-500 nm and 350-360 nm/450-500 nm, one humic acid factor C located at 365-375 nm/475-525 nm, and one soil fulvic acid factor located at 380-390 nm/475-525 nm. When the concentration increased from 20 mg/L to 200 mg/L, the composition and contribution rate of the factors has little difference, that is, the change of concentration did not change the properties of the solution.


 DownLoad: