Volume 50 Issue 12
Dec.  2021
Turn off MathJax
Article Contents

Liu Yingtao, Xu Lulu, He Fangcheng, Li Shuoning, Yang Danggang. Effects of environmental factors on infrared flash thermography nondestructive testing in outfield detection[J]. Infrared and Laser Engineering, 2021, 50(12): 20210711. doi: 10.3788/IRLA20210711
Citation: Liu Yingtao, Xu Lulu, He Fangcheng, Li Shuoning, Yang Danggang. Effects of environmental factors on infrared flash thermography nondestructive testing in outfield detection[J]. Infrared and Laser Engineering, 2021, 50(12): 20210711. doi: 10.3788/IRLA20210711

Effects of environmental factors on infrared flash thermography nondestructive testing in outfield detection

doi: 10.3788/IRLA20210711
  • Received Date: 2021-09-27
  • Rev Recd Date: 2021-10-26
  • Publish Date: 2021-12-31
  • To reveal mechanism of influence of environmental factors such as ambient temperature, sunshine and wind velocity on infrared thermographic nondestructive testing, modeling of a delamination in a glass fiber reinforced plastic specimen in infrared flash thermography testing was made and studied. The model was an axial symmetry model. Thermal signals to be detected in infrared thermographic nondestructive testing, such as temperature difference, the maximum temperature difference, temperature contrast and the maximum temperature contrast, were calculated and analyzed using finite element method in that model. Several experiments with special process treatment on that specimen were carried out. Evolution of the thermal signals with changes of those environmental factors was researched. Comparison of results from modeling and experiment in ambient temperature 25 ℃ and 30 ℃ was made. Results from modeling and experiments in uneven sunshine and in homogeneous temperature were compared too. Results in deferent wind speed were presented at the end of this paper. Convective heat transfer coefficients in the model were 10 W/(m2·K) and 100 W/(m2·K). The simulation results and the experiment results show that the maximum temperature contrast declines with increase of ambient temperature. Decline of the maximum temperature contrast means that clarity of defect gets worse, and detection of defect becomes more difficult. The maximum temperature difference and the maximum temperature contrast increase or decrease due to uneven sunshine on the specimen. Those changes lead to misjudgment or missing detection. Increase of wind velocity may reduce the maximum temperature difference and the maximum temperature contrast, and result in worse detectability and clarity of defect.
  • [1] Wang Yaqiong. Research on maintenance and detection of civil aircraft based on infrared thermal Image detection [J]. Modern Manufacturing Technology and Equipment, 2019(11): 169-170. (in Chinese) doi:  10.3969/j.issn.1673-5587.2019.11.086
    [2] Cao Qiang, Han Daorong. Application of NDT in military aircraft maintenance [J]. Aviation Maintenance & Engineering, 2015(4): 74-77. (in Chinese) doi:  10.3969/j.issn.1672-0989.2015.04.024
    [3] 李秀芬, 陈俊文, 姜洋等. 飞机结构件在役渗透及磁粉检测技术应用研究[C]. 第十一届全国磁粉渗透检测技术年会, 2017年山东济宁: 154-158

    Li Xiufen, Chen Junwen, Jiang Yang, et al. Application research of penetrant inspection and magnetic particle inspection in aircraft components in service[C]//The 11th National Conference of Penetrant Inspection and Magnetic Particle Inspection, 2017: 154-158. (in Chinese)
    [4] Huang Huabing, Xu Mao, Peng Zhiwei. In-situ testing method of R area for aircraft structure [J]. Nondestructive Testing, 2019, 41(3): 38-41. (in Chinese) doi:  10.11973/wsjc201903010
    [5] Ma Jianhui, Yang Guang, Liu Yong. The in-situ detection of aero-engine turbine blade with endoscope and fluorescence penetration [J]. Nondestructive Testing, 2020, 42(6): 50-53. (in Chinese) doi:  10.11973/wsjc202006011
    [6] Wang Dan, Ning Ning, Yang Pengfei, et al. In-situ nondestructive testing technology for the integral composite panel of the fuel tank [J]. Nondestructive Testing, 2018, 40(11): 33-36,55. (in Chinese) doi:  10.11973/wsjc201811009
    [7] Liu Bingwei, Zhong Mian, Fu Hangjun, et al. Defect extraction and quantitative analysis of composite materials based on infrared detection[C]//Proc of SPIE, 2020, 11455: 114550M.
    [8] Liu Yingtao, Mu Rende, Guo Guangping, et al. Infrared flash thermographic nondestructive testing of defects in thermal barrier coating [J]. Journal of Aeronautical Materials, 2015, 35(6): 83-90. (in Chinese) doi:  10.11868/j.issn.1005-5053.2015.6.014
    [9] Liu Yingtao, Guo Guangping, Yang Danggang, et al. Pulsed thermography of composite components used in aerospace applications [J]. Journal of Aeronautical Materials, 2012, 32(1): 72-77. (in Chinese) doi:  10.3969/j.issn.1005-5053.2012.1.015
    [10] Wang Zhiyong, Liu Yingtao, Wang Xiaohu, et al. Application of infrared thermography in research of radar absorbing coating defects [J]. Journal of Aeronautical Materials, 2012, 32(3): 91-95. (in Chinese) doi:  10.3969/j.issn.1005-5053.2012.3.016
    [11] Maldague X. Nondestructive Evaluation of Materials by Infrared Thermography[M]. London: Springer, 1993.
    [12] 杨世铭, 陶文铨. 传热学[M]. 第3版. 北京: 高等教育出版社, 1998: 420-424

    Yang Shiming, Tao Wenquan. Heat Transfer[M]. 3rd Edition. Beijing: Higher Education Press, 1998: 420-424. (in Chinese)
    [13] Liu Yingtao, Tang Jia, Guo Xingwang, et al. Effects of composites translucence on flash infrared thermal detection [J]. Laser & Infrared, 2017, 47(10): 1264-1270. (in Chinese) doi:  10.3969/j.issn.1001-5078.2017.10.014
    [14] Guo Xingwang, Guan Heqing, Liu Yingtao, et al. Spectrum characteristics and light source selection for infrared thermal imaging testing of semitransparent materials [J]. Infrared and Laser Engineering, 2017, 46(1): 0104001. (in Chinese) doi:  10.3788/IRLA201746.0104001
    [15] Lin Zhengyun. The distributions of global radiation and ground radiation balance in Fujian province [J]. Acta Energiae Solaris Sinica, 1994, 15(3): 248-256. (in Chinese)
  • 加载中
通讯作者: 陈斌, bchen63@163.com
  • 1. 

    沈阳化工大学材料科学与工程学院 沈阳 110142

  1. 本站搜索
  2. 百度学术搜索
  3. 万方数据库搜索
  4. CNKI搜索

Figures(18)  / Tables(2)

Article Metrics

Article views(174) PDF downloads(29) Cited by()

Related
Proportional views

Effects of environmental factors on infrared flash thermography nondestructive testing in outfield detection

doi: 10.3788/IRLA20210711
  • 1. AECC Beijing Institute of Aeronautical Materials, Beijing 100095, China
  • 2. Beijing Key Laboratory of Aeronautical Materials Testing and Evaluation, Beijing 100095, China
  • 3. Key Laboratory of Aeronautical Materials Testing and Evaluation, Aero Engine Corporation of China, Beijing 100095, China
  • 4. Aviation Key Laboratory of Science and Technology on Materials Testing and Evaluation, Beijing 100095, China
  • 5. School of Materials Science and Engineering, Beihang University, Beijing 100191, China

Abstract: To reveal mechanism of influence of environmental factors such as ambient temperature, sunshine and wind velocity on infrared thermographic nondestructive testing, modeling of a delamination in a glass fiber reinforced plastic specimen in infrared flash thermography testing was made and studied. The model was an axial symmetry model. Thermal signals to be detected in infrared thermographic nondestructive testing, such as temperature difference, the maximum temperature difference, temperature contrast and the maximum temperature contrast, were calculated and analyzed using finite element method in that model. Several experiments with special process treatment on that specimen were carried out. Evolution of the thermal signals with changes of those environmental factors was researched. Comparison of results from modeling and experiment in ambient temperature 25 ℃ and 30 ℃ was made. Results from modeling and experiments in uneven sunshine and in homogeneous temperature were compared too. Results in deferent wind speed were presented at the end of this paper. Convective heat transfer coefficients in the model were 10 W/(m2·K) and 100 W/(m2·K). The simulation results and the experiment results show that the maximum temperature contrast declines with increase of ambient temperature. Decline of the maximum temperature contrast means that clarity of defect gets worse, and detection of defect becomes more difficult. The maximum temperature difference and the maximum temperature contrast increase or decrease due to uneven sunshine on the specimen. Those changes lead to misjudgment or missing detection. Increase of wind velocity may reduce the maximum temperature difference and the maximum temperature contrast, and result in worse detectability and clarity of defect.

  • 无损检测是保障飞机飞行安全的重要手段之一。在飞机的在役检测和维修检测中,目视、敲击、超声、渗透、磁粉、涡流、X射线等多种无损检测方法根据实际需要都有着大量的应用[1-6]。譬如,利用渗透及磁粉检测技术可以有效检查出飞机结构表面缺陷及损伤,如疲劳裂纹、应力腐蚀裂纹等[3]。可以采用涡流检测法对飞机结构外R区进行在役原位检测[4]。对于航空发动机涡轮叶片,可以采用内窥镜荧光渗透方法对其内腔裂纹进行原位检测[5]。对于机翼油箱整体壁板,可以采用超声相控阵技术进行快速化原位检测[6]等。

    近些年来,由于红外热成像检测方法具有非接触、可视化、检测效率高等特点,并得益于方法本身的日渐成熟和设备的不断迭代升级,该技术逐渐成为新的在役检测和维修检测方法。

    波音、空客等公司都将红外热成像检测技术列为蜂窝积水的重要检测手段。尤其是空客公司在飞机方向舵、升降舵的积水检测中大量采用红外热成像检测技术。电吹风加热和电热毯加热是常见的蜂窝积水检测加热手段[1]。此外,在飞机冲击损伤、复合材料层压板结构件分层、夹层结构件脱粘、涂层脱粘等缺陷的检测中,红外热成像检测方法也给出了良好的检测结果[7-10],其中以闪光灯加热为激励手段的红外热成像检测是发展较为成熟的一种红外检测方法。

    在役检测中,避免不了需要在外场环境下实施原位检测的情况,而外场环境的复杂性对红外热成像检测存在一定影响,尤其是外场强热辐射源会明显干扰对检测结果的分析。此外,环境温度、日照不均、环境风速等都可能对检测结果产生不利影响,但是目前针对这些环境因素如何影响红外热成像检测的研究还未见报道。文中以闪光灯激励红外热像法为例,通过建模仿真分析和基于试块的实验研究探究外场检测环境对红外热成像检测方法的影响机理及规律。

    • 用于仿真计算的缺陷模型如下:

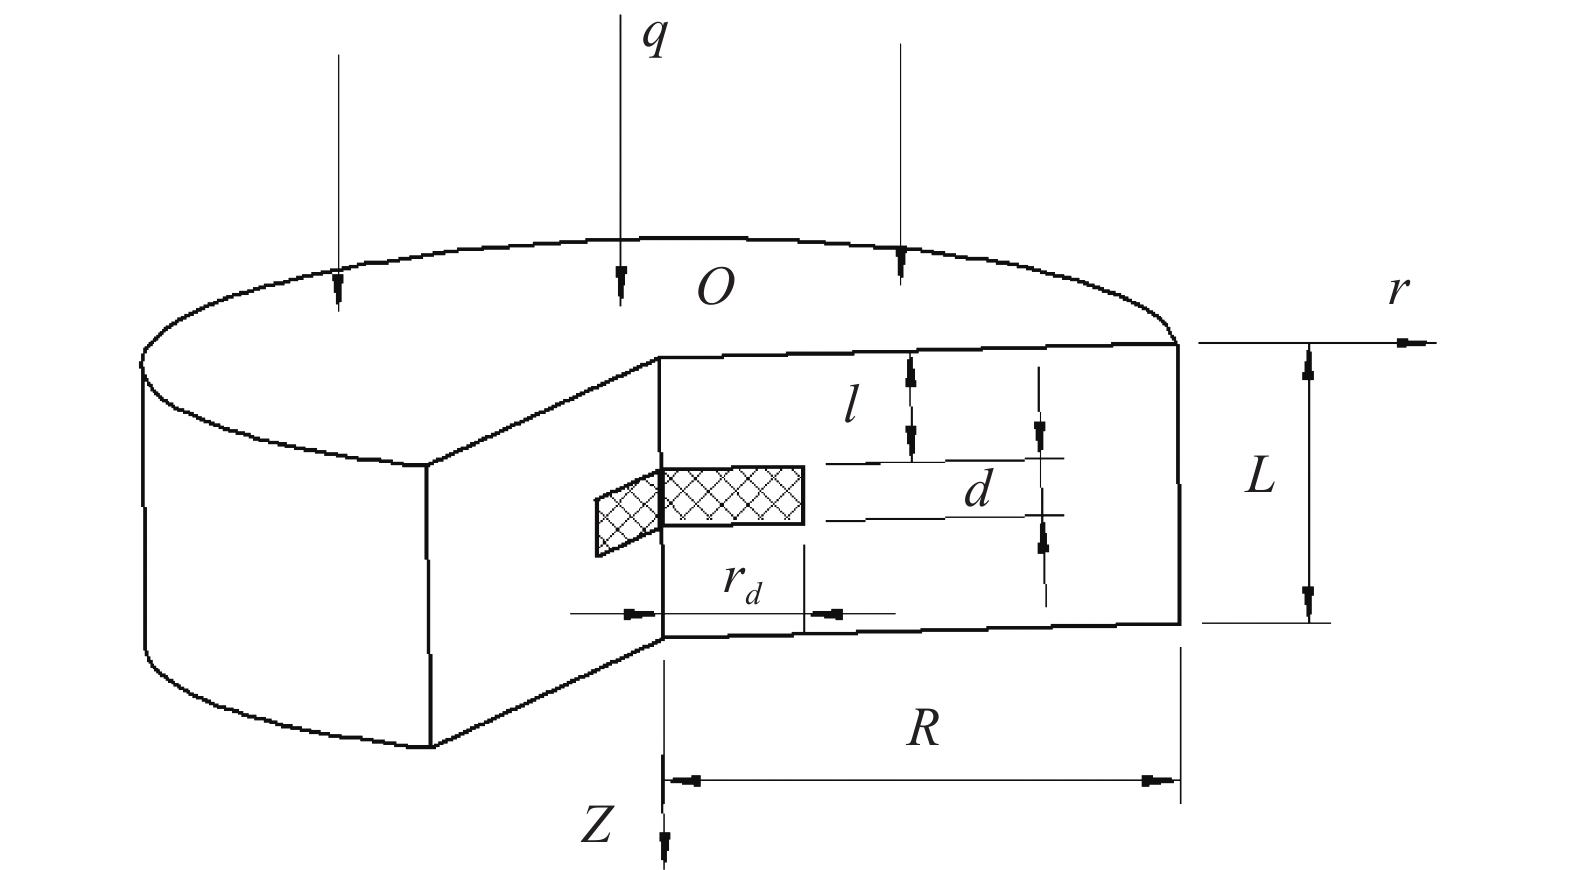
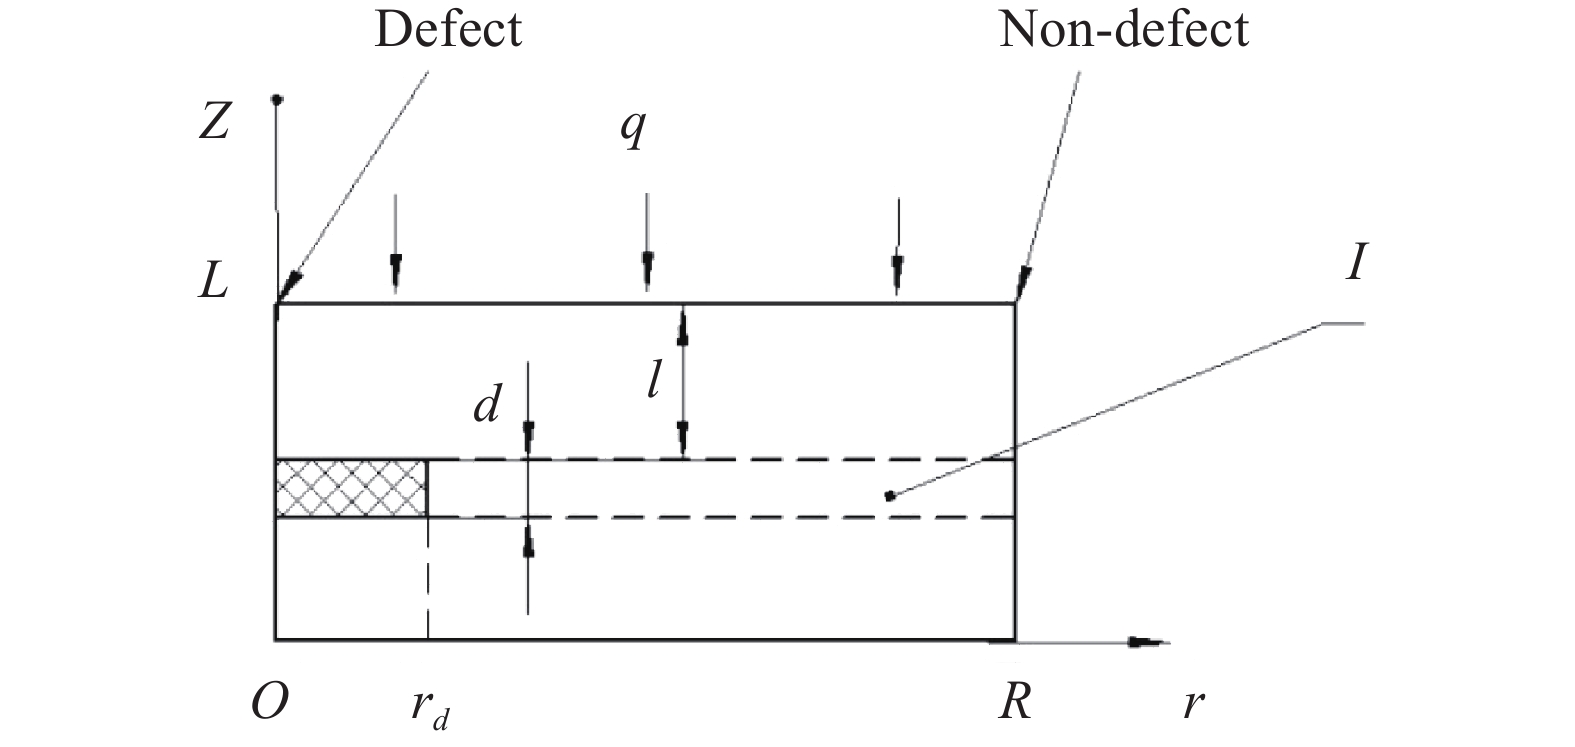
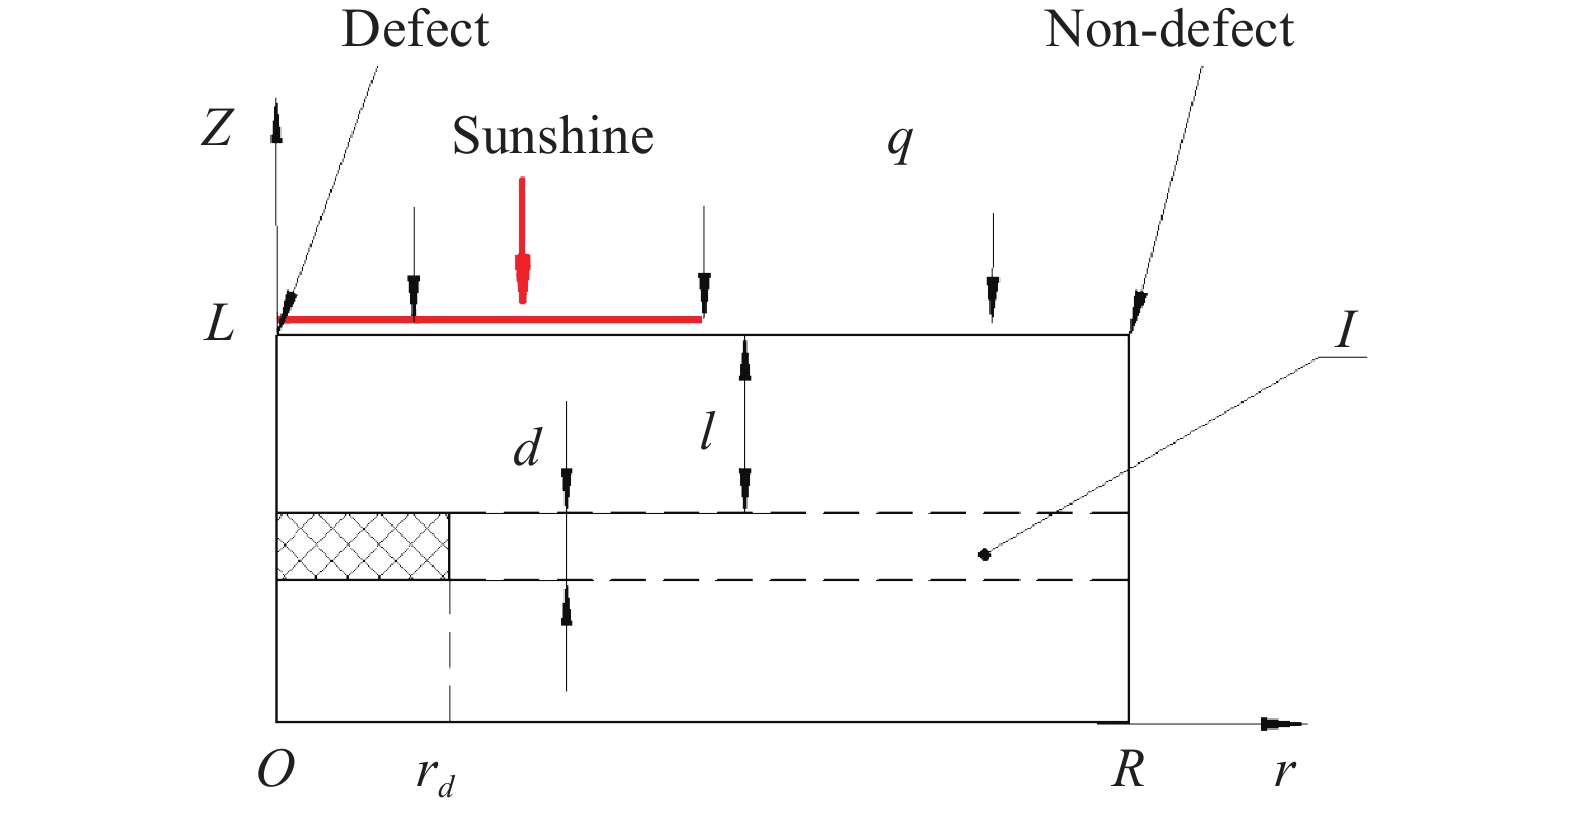
      含分层缺陷的三维模型如图1所示时,因为具有轴对称性,当采用具有轴对称特性的ANSYS单元进行解算时,该模型可以等同为如图2所示的二维模型。为了便于计算,文中接下来采用二维模型进行仿真研究。模型中画有网格的区域为分层缺陷,为空气,本底材料为玻璃纤维增强塑料(Glass Fiber Reinforced Plastic,GFRP)。这里L为试件厚度,l为缺陷埋深,d为缺陷厚度,R为圆柱形试件半径,rd为缺陷半径,q为加热的热流密度。

      Figure 1.  3D cylindrical model

      Figure 2.  2D model simplified from 3D cylindrical model

      对于脱粘缺陷的情况,需要将缺陷区域右侧的I区换成胶层,缺陷和I区的上方换为GFRP蒙皮或涂层,缺陷和I区的下方换为芯材或基体,来模拟夹层结构或涂层的脱粘缺陷。文中以上述模型为基础着重研究分层缺陷的仿真。仿真对比分析的主要参数见表1。25 ℃空气的热物理性质参数由其20 ℃和30 ℃的数值插值得到。

      研究中涉及两种材料:GFRP和空气,它们的热物理性质参数见表2

      Specimen thickness
      L/m
      Defect thickness
      d/m
      Defect depth
      l/m
      Specimen radius
      R/m
      Defect radius
      rd/m
      Heating pulse duration
      t/s
      Heating flux density
      q/W·m−2
      0.00250.000050.00050.0200.00750.0020.84×107

      Table 1.  Main parameter in the model

      MaterialDensity
      ρ/kg·m−3
      Specific heat
      cp/kJ·kg−1·K−1
      Thermal conductivity
      λ/W·m−1·K−1
      GFRP[11]19001.20.3
      Air(20℃)[12]1.2051.0050.0259
      Air(30℃)[12]1.1651.0050.0267

      Table 2.  Thermal properties of materials

      在进行仿真计算之前,需要定义如下可检信息参数,同一时刻缺陷和无缺陷的温差ΔT(t)可表示为:

      同一时刻温度对比度C(t)可表示为:

      式中:θd(t)为有缺陷区的表面温升;θnd(t)为无缺陷区的表面温升。选取缺陷中心点作为缺陷区的参考点,模型边缘处的点作为无缺陷区的参考点,见图2。温差ΔT(t)反映的是缺陷可检性,如果ΔT(t)小于、等于环境噪声,则缺陷很难被检测到。温度对比度C(t)反映的是温差ΔT(t)相对于无缺陷信号的大小,在图像上反映的是缺陷的清晰程度。

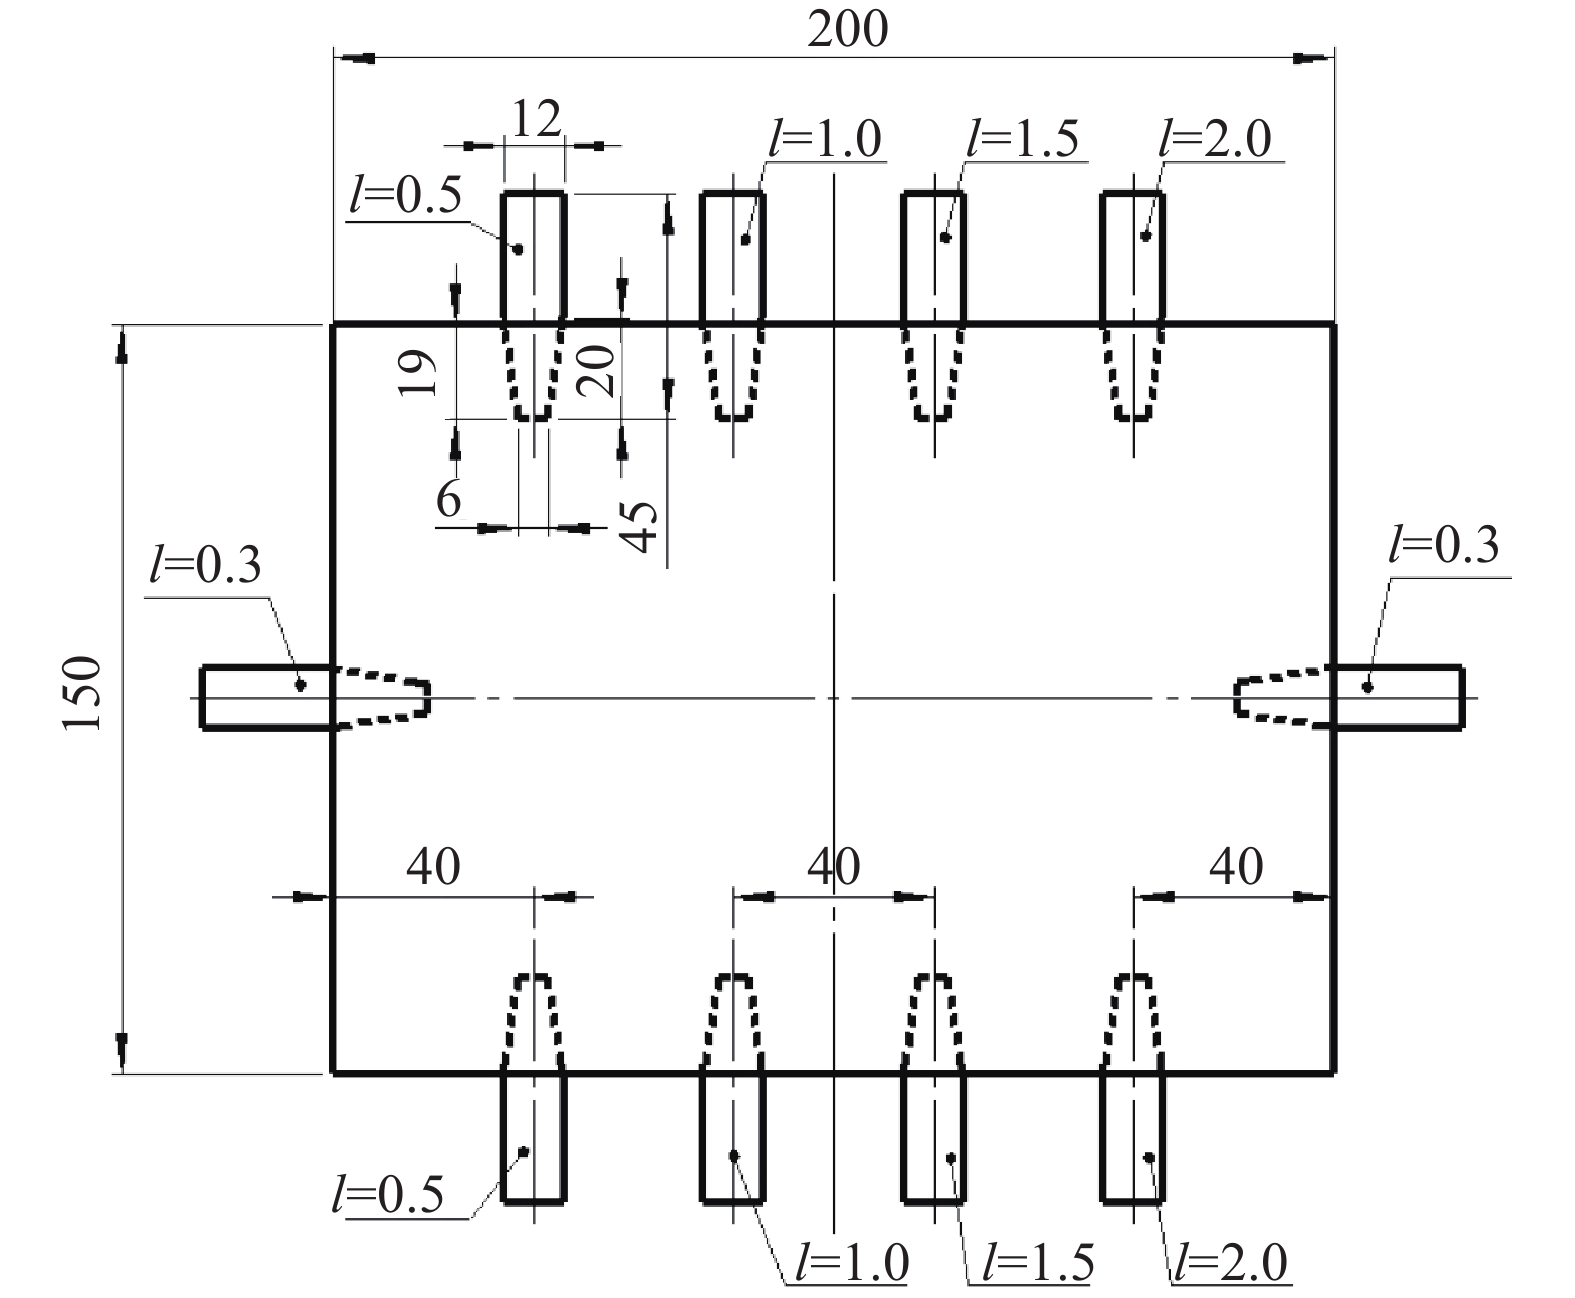
    • 试块为GFRP层压板,长×宽为200 mm×150 mm,总厚度2.5 mm,不锈钢插片厚度为0.05 mm,试块制作完成后,将其拔出。中间一行分层缺陷埋深0.3 mm,左数第一列分层缺陷埋深0.5 mm,左数第二列分层缺陷埋深1.0 mm,左数第三列分层缺陷埋深1.5 mm,最后一列分层缺陷埋深2.0 mm。缺陷布置图见图3

      Figure 3.  Arrangement of defects in the specimen

    • 为了考察环境温度对闪光灯激励红外热成像检测的影响,设环境温度分别为25 ℃和30 ℃。由于只考虑环境温度的影响,在环境温度稳定的情况下,由于热平衡,可以推算出被检测试块的初始温度也分别为25 ℃和30 ℃。加热阶段除加热面外其他边界均为绝热边界条件,冷却阶段原加热面为对流换热边界条件,对流换热系数设为10 W/(m2·K),其他边界仍然为绝热边界条件。

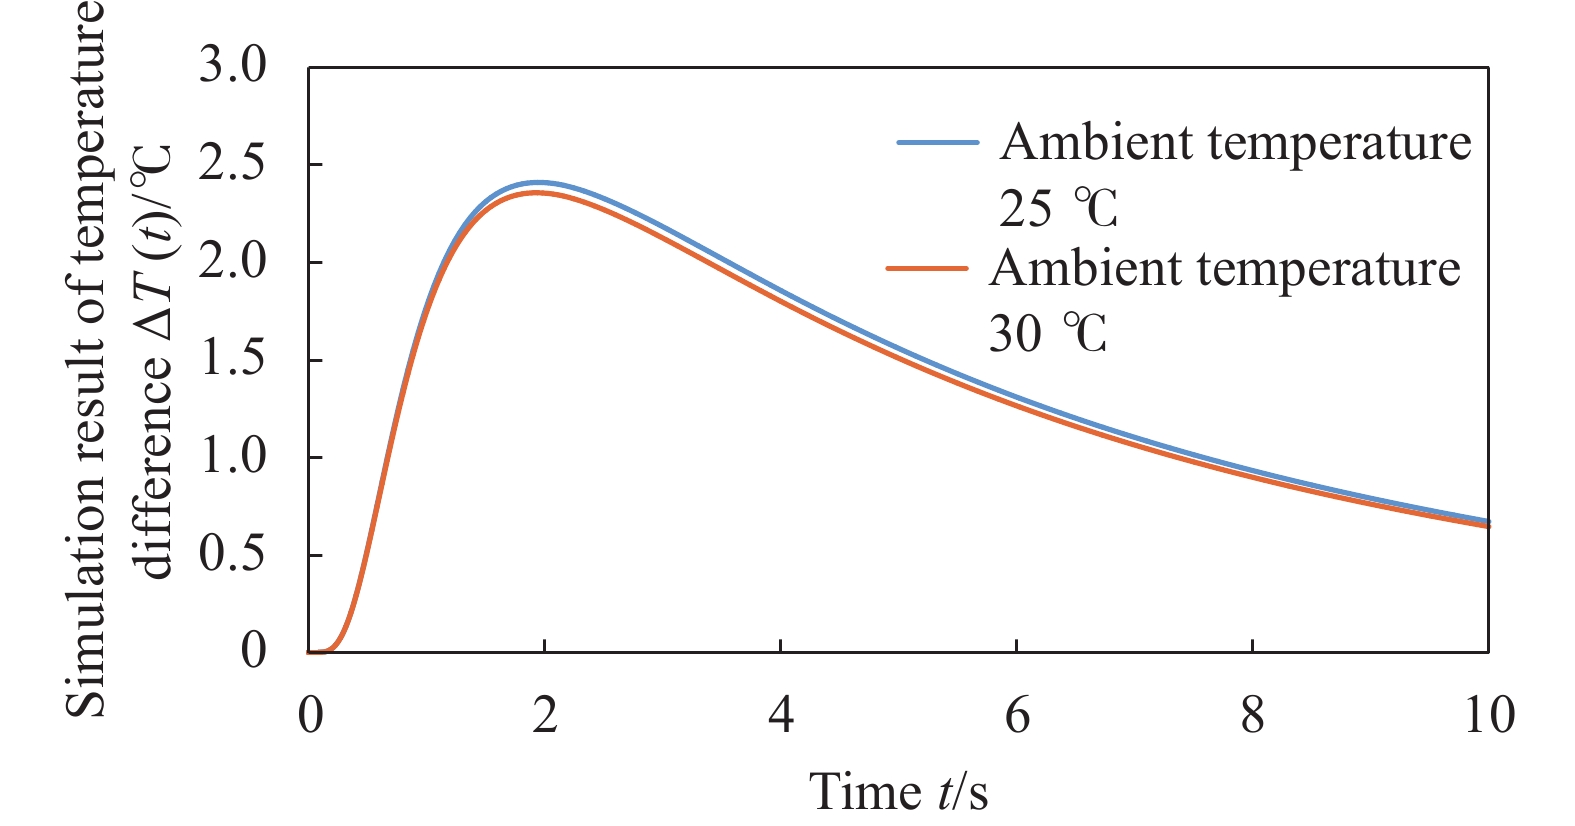
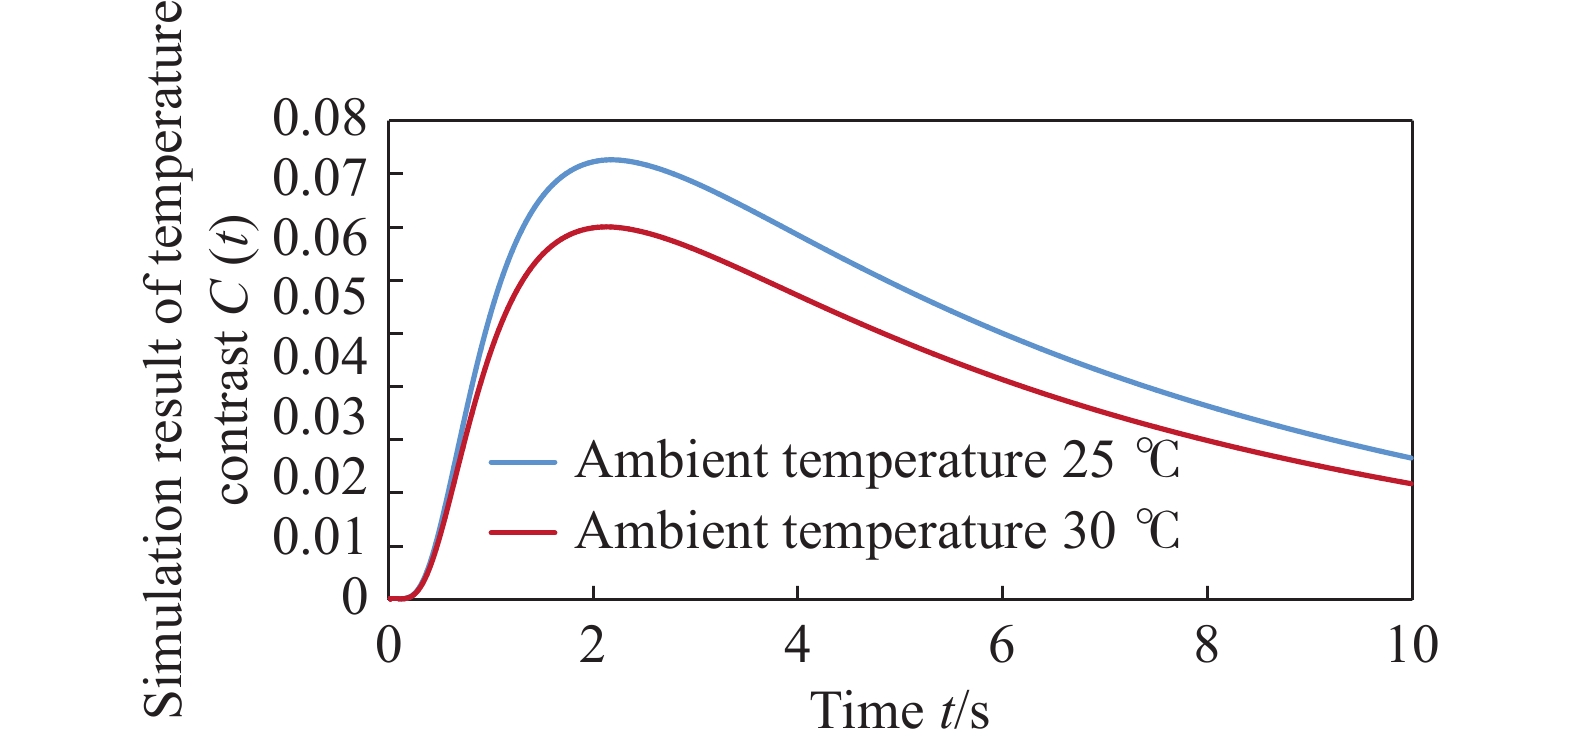
      利用ANSYS软件进行建模仿真计算,得到环境温度分别为25 ℃和30 ℃的缺陷区和无缺陷区温差ΔT(t)曲线,见下图4,对应的温度对比度C(t)曲线见图5。仿真过程的总时间为10 s,加热过程为0.002 s。

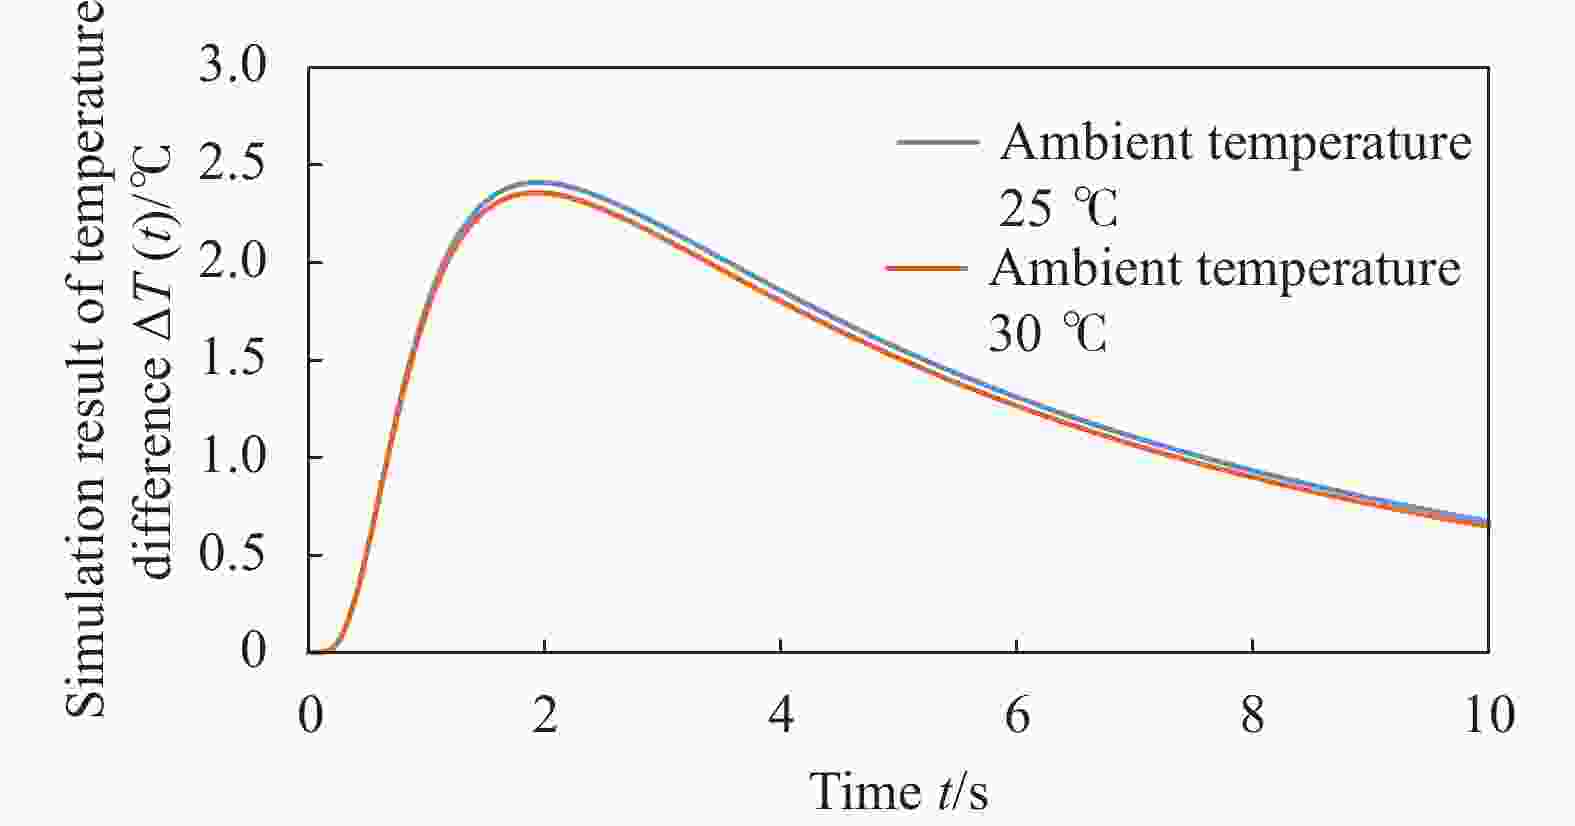
      Figure 4.  Simulation result of temperature difference ΔT(t) in different testing ambient temperature

      Figure 5.  Simulation result of temperature contrast C(t) in different testing ambient temperature

      可见,虽然环境温度相差5 ℃,但是两种环境温度下的ΔT(t)曲线几乎一致,ΔT(t)的最大值ΔTm也是非常接近的,只是高环境温度下的ΔTm及ΔT(t)曲线后半段略低。然而,温度对比度C(t)曲线却差异明显,随着环境温度的升高,温度对比度C(t)的最大值Cm明显减小这对检测有一定负面影响,缺陷清晰度下降。

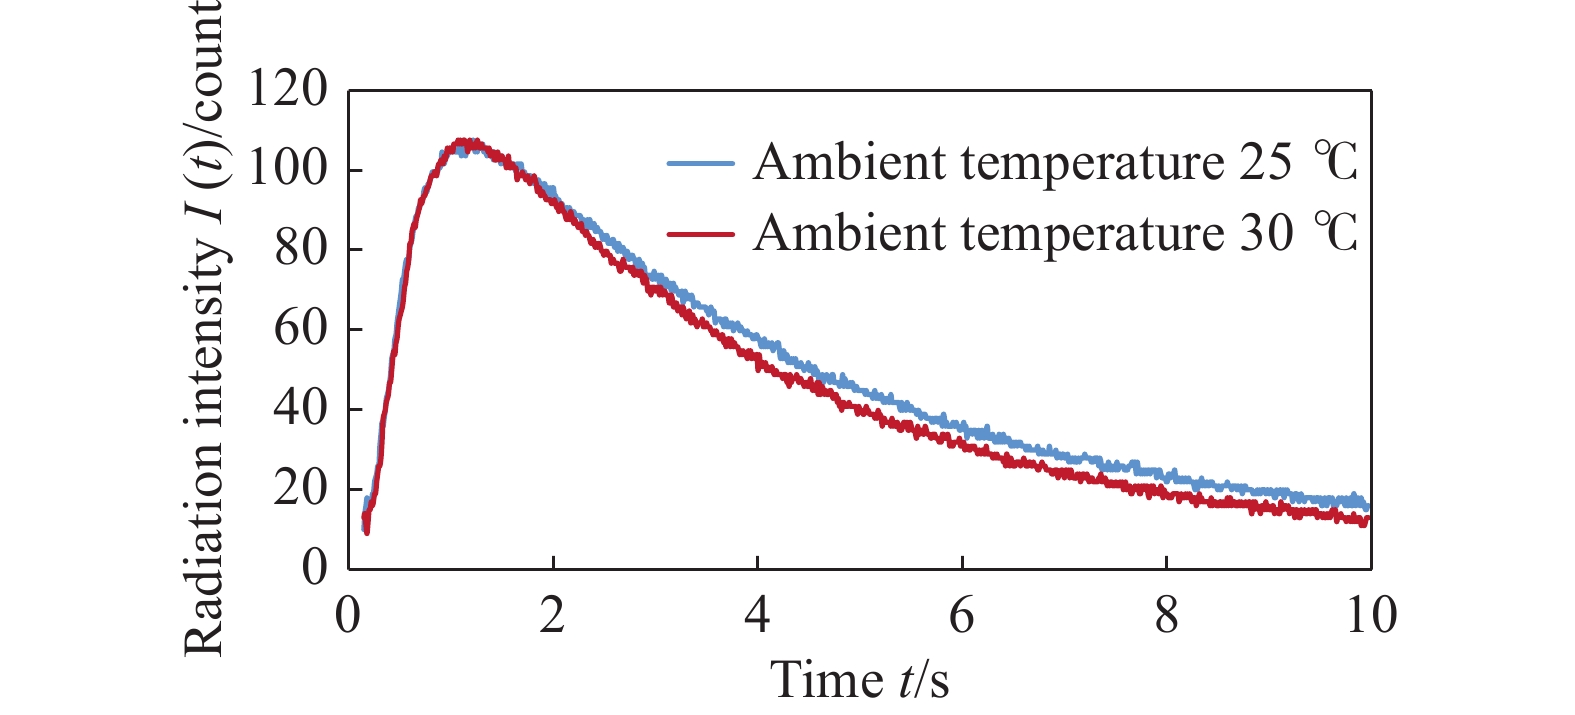
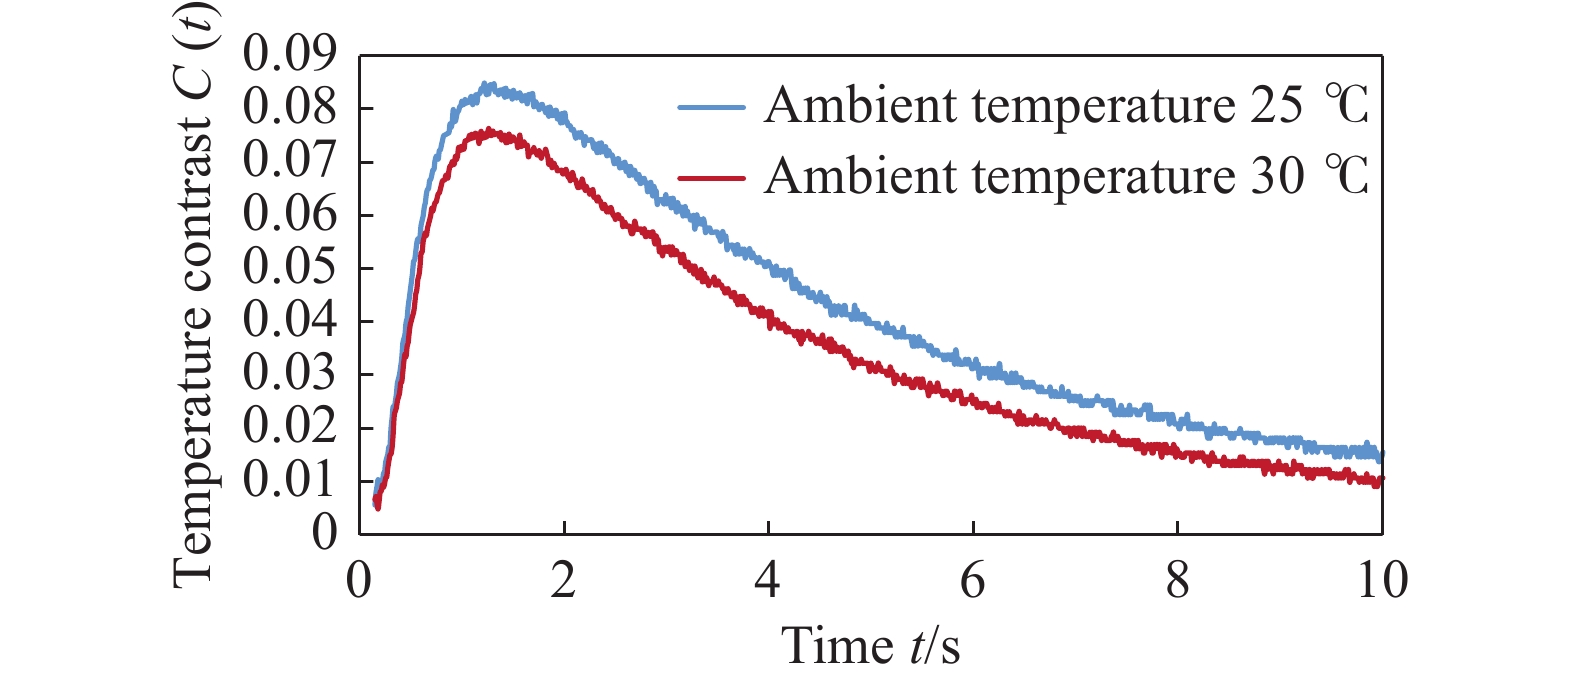
    • 分别在环境温度为25 ℃和30 ℃的条件下,对试块进行了检测。由于GFRP层压板具有半透明性[13-14],所以检测表面事先喷涂了水溶性黑漆(以下实验同样处理)。检测参数为:加热能量9.6 kJ,采集频率95 Hz,采集时间20 s。为了与仿真结果进行比对,对实验结果中前0.15~10 s的数据进行了截取,并按照公式(1)和公式(2)进行计算。0.15 s之前的数据存在闪光时的饱和影响和闪光灯热辐射的明显干扰,所以将其舍去。图6为在检测结果中的取点位置,图7为试块的缺陷和无缺陷温差ΔT(t)曲线,图8为试块温度对比度C(t)曲线。

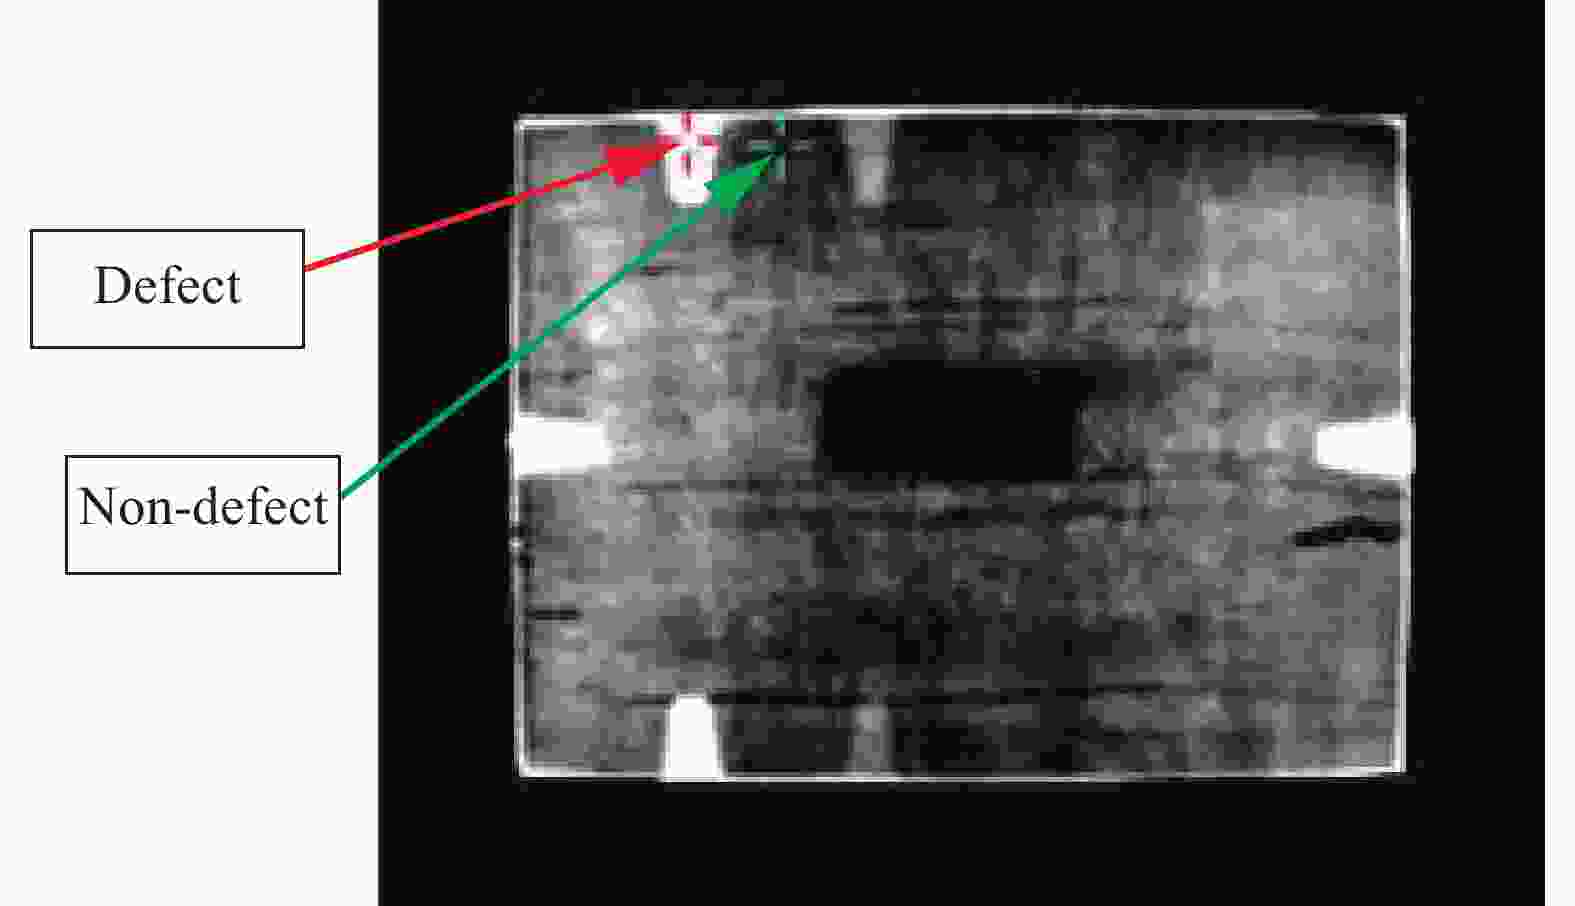
      Figure 6.  Positions of defect point and reference non-defect point in thermal image

      Figure 7.  Experiment result of temperature difference ΔT(t) in different testing ambient temperature

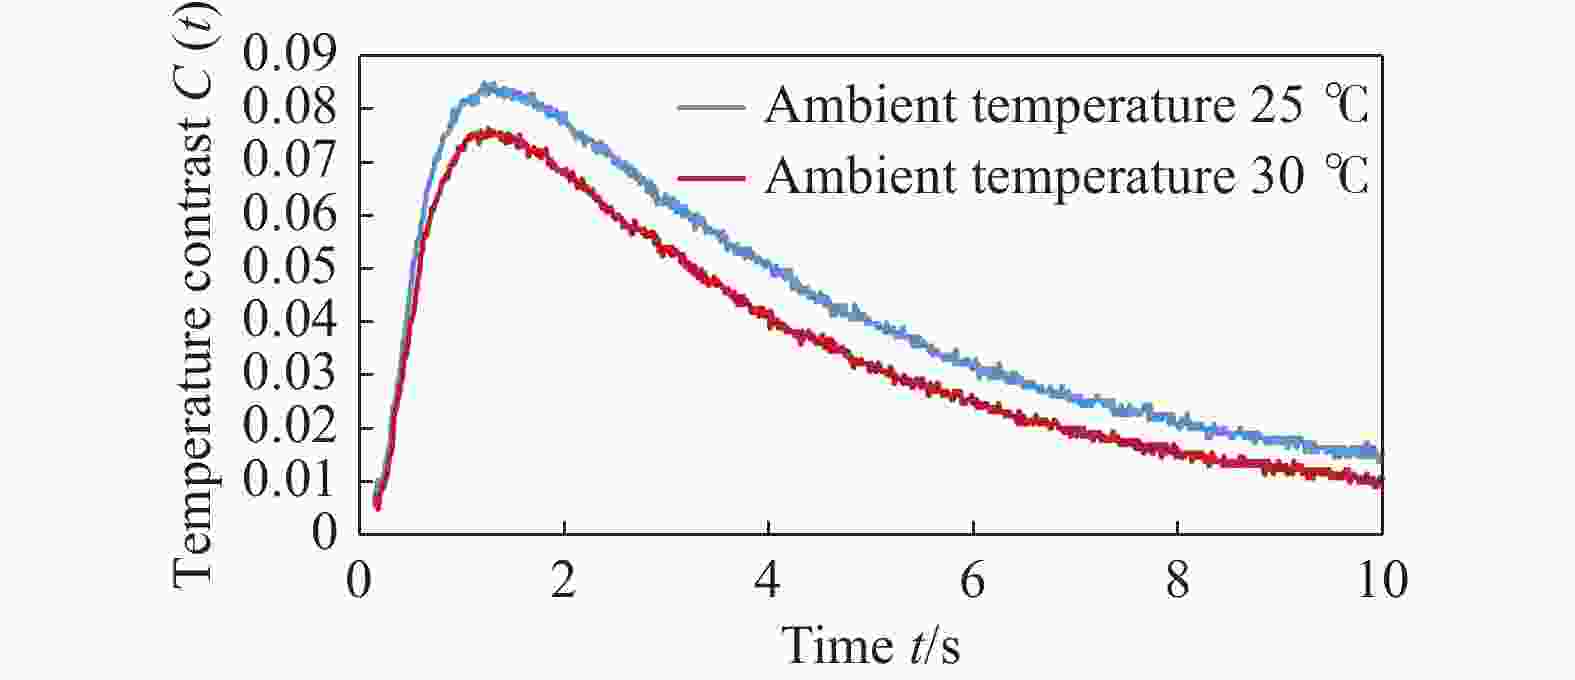
      Figure 8.  Experiment result of temperature contrast C(t) in different testing ambient temperature

      由于实验中实测得到的数据是直接从红外热像仪读取的裸数据,无明确单位,它代表了辐射强度的强弱,与温度之间的换算需要进行黑体标定,又加之文中主要研究变化趋势和规律,具体温度是多少并无影响,所以以下实验结果均直接以从红外热像仪读取的辐射强度来表示。

      从基于试块实验结果得到的两种不同检测环境温度下温差△T(t)曲线和温度对比度C(t)曲线可以看出:随着检测环境温度的升高,曲线的后半段都有下降的趋势,与仿真结果相一致。而温差△T(t)曲线随着检测环境温度的升高,后半段在检测实验结果中出现了更为明显的下降。温度对比度C(t)的最大值Cm随着检测环境温度的升高,明显减小,与仿真结果一致。

    • 日照均匀的情况下,日照造成检测前被检测部位的初始温度相同,同前面的环境温度影响相近似。文中主要研究日照造成被检测部位初始温度不均匀的影响。

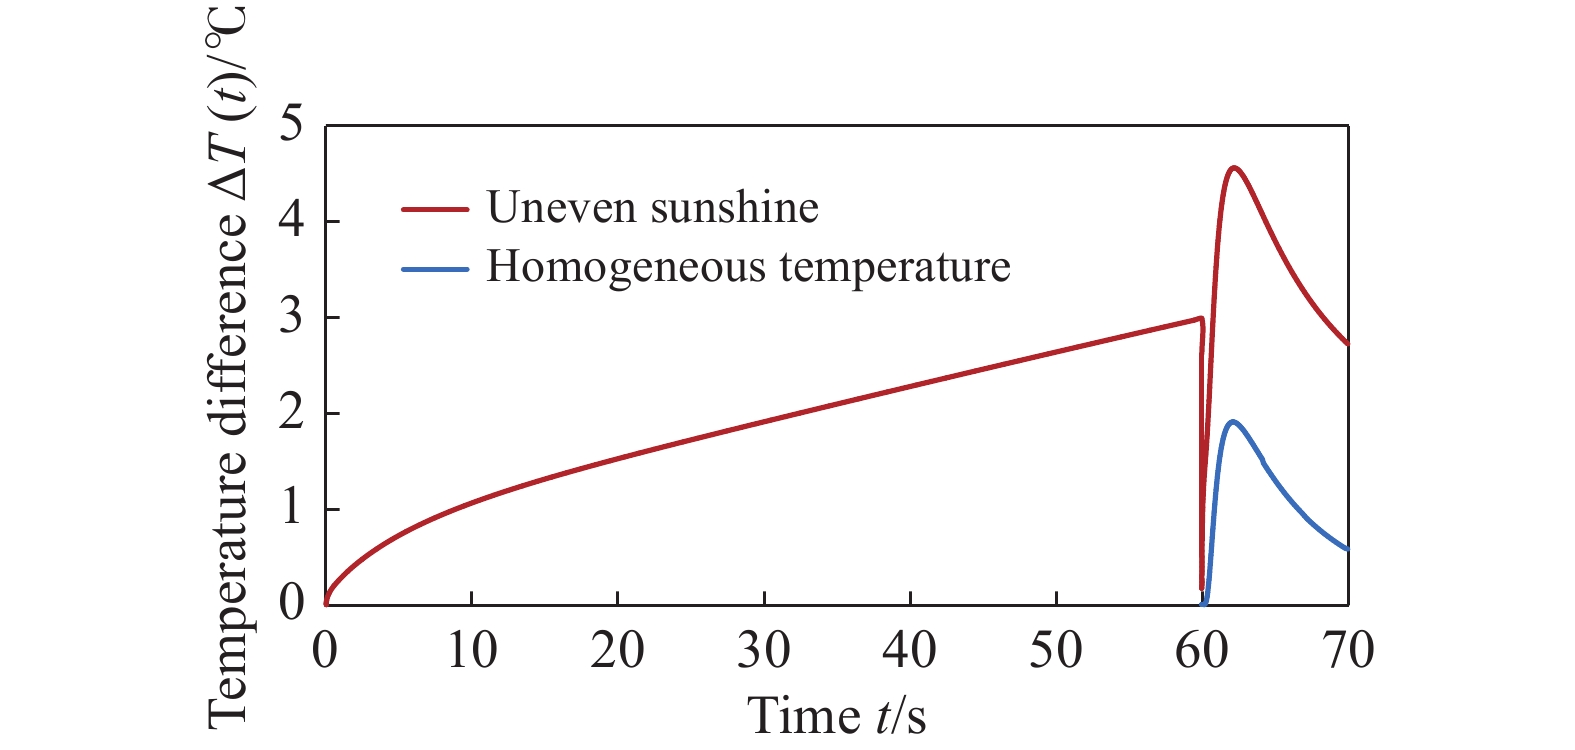
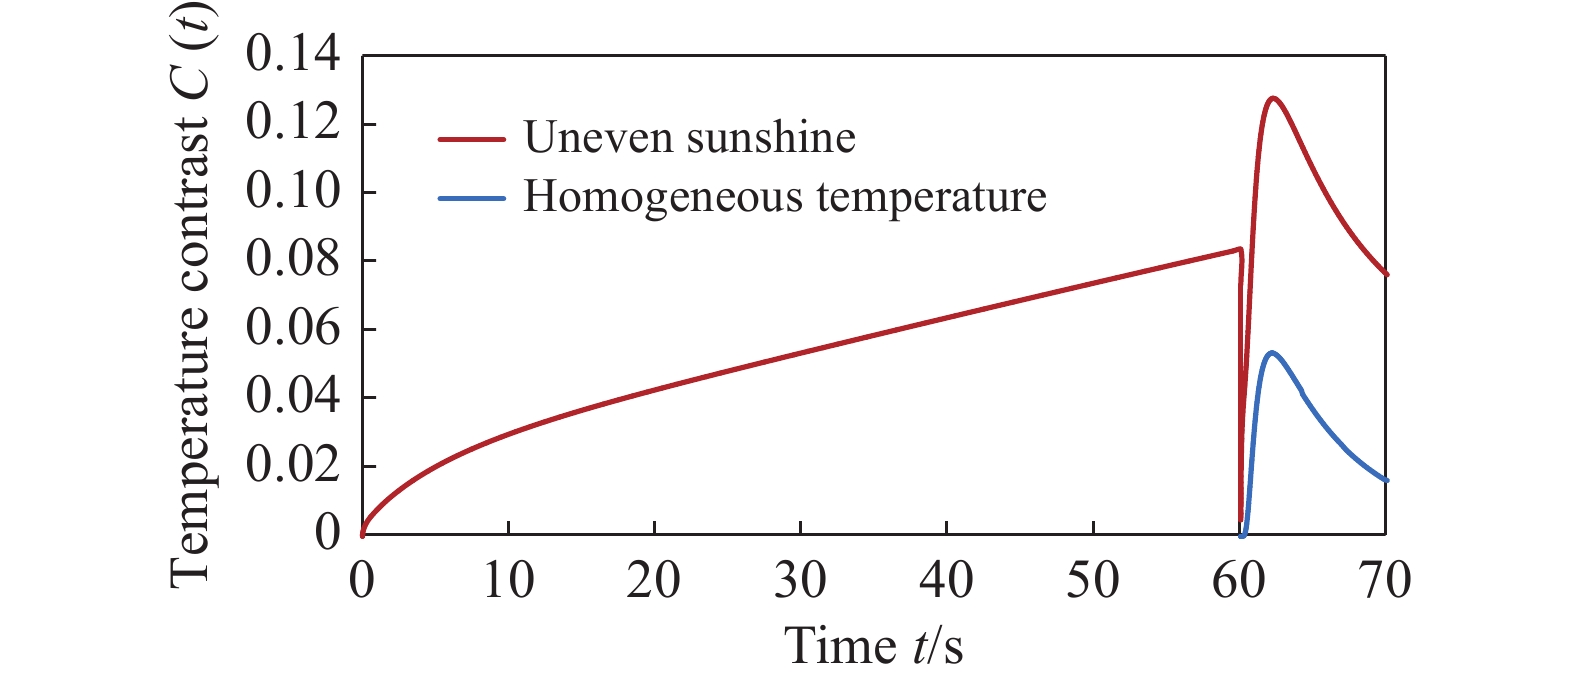
    • 为了模拟由于日照造成的检测部位初始温度不均匀,首先取地面接受到的太阳辐射热流密度为q = 150 W/ m2[15],在模型上表面左半部分施加该热流,加热时长为60 s,见图9模型中左上红线部分。然后,再于模型的上表面全部施加热流q = 0.84×10⁷ W/ m2,加热时长为0.002 s,即闪光灯激励加热,此后开始正常检测过程,这一过程总时长为10 s。模型上表面左半部分施加的热流情况参见公式(3),右半部分施加的热流情况参见公式(4)。对应的环境温度为25 ℃。均匀温度条件下进行的常规检测中,对应的环境温度和试块温度同为25 ℃。两种模型下加热面在冷却阶段的对流换热系数均为10 W/(m2·K),其他边界在加热阶段和冷却阶段均为绝热边界条件。两种模型中温度差△T(t)和温度对比度C(t)的对比分别见图10图11

      Figure 9.  2D model of uneven sunshine

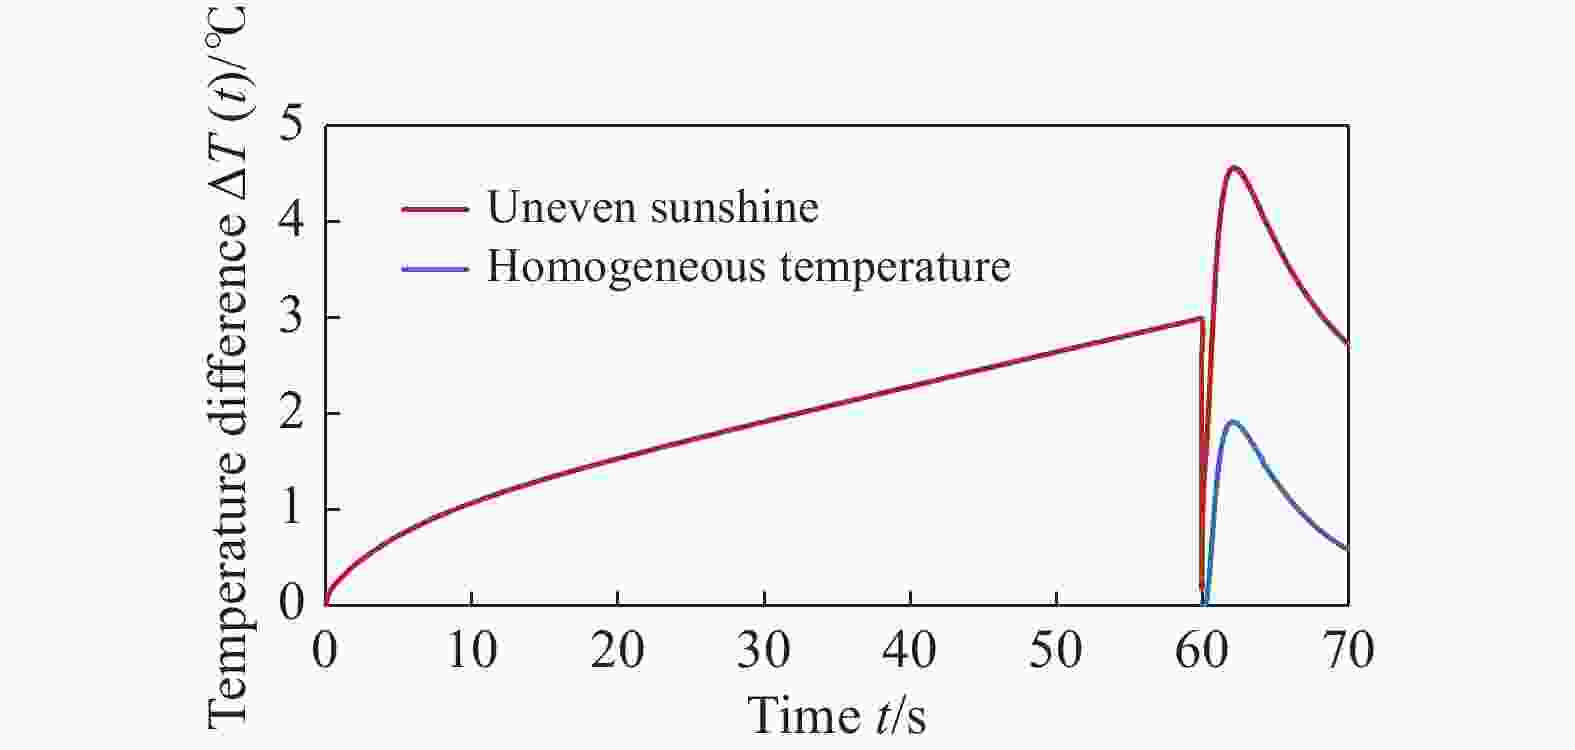
      Figure 10.  Simulation result of temperature difference ΔT(t) in uneven sunshine and in homogeneous temperature

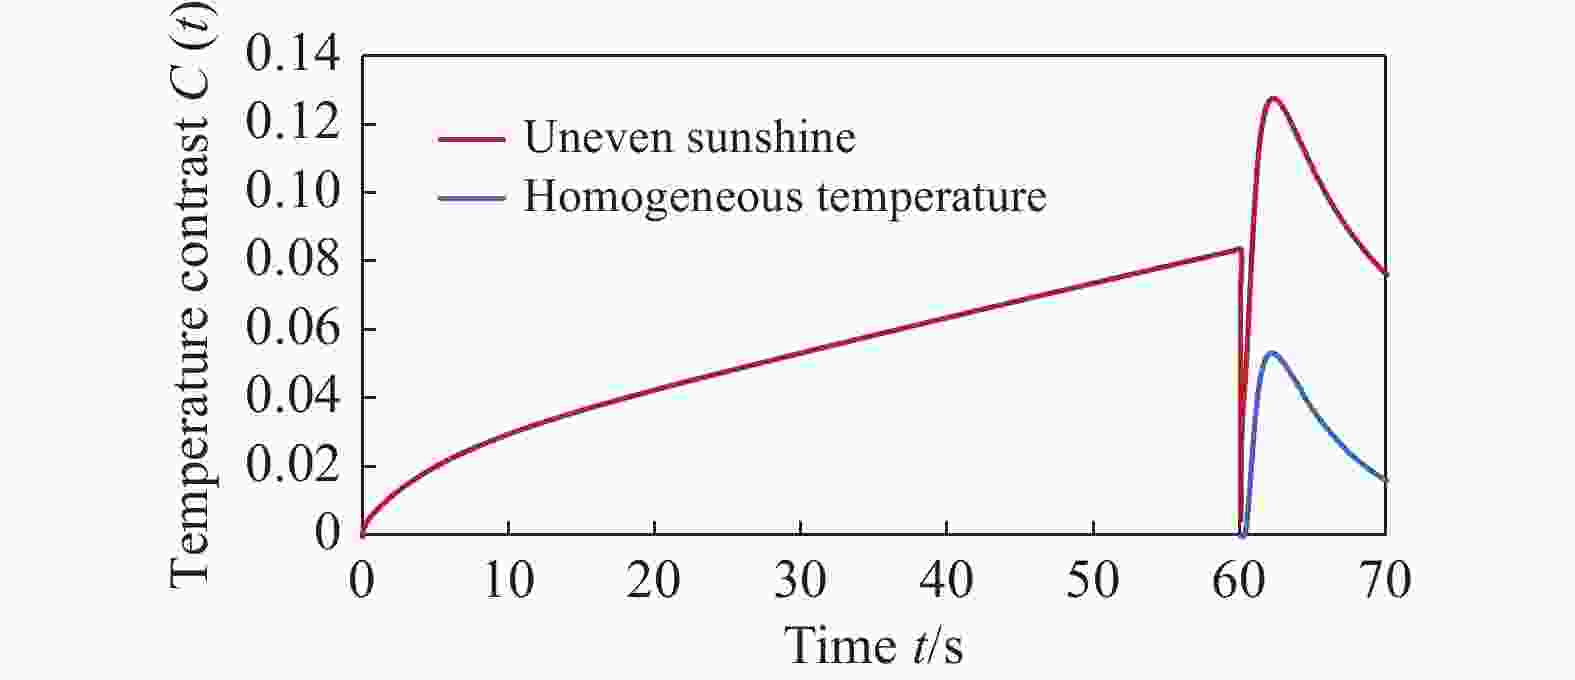
      Figure 11.  Simulation result of temperature contrast C(t) in uneven sunshine and in homogeneous temperature

      可见,日照不均使得检测实施前有缺陷处被阳光加热升温,参考的无缺陷区没有被阳光加热,因而造成缺陷区与无缺陷区的温差ΔT(t)和温度对比度C(t)发生明显变化。此例中温差ΔT(t)最大值ΔTm和温度对比度C(t)最大值Cm较均匀温度模型下的最大值均明显增大,不利于红外热成像的缺陷检测与识别。

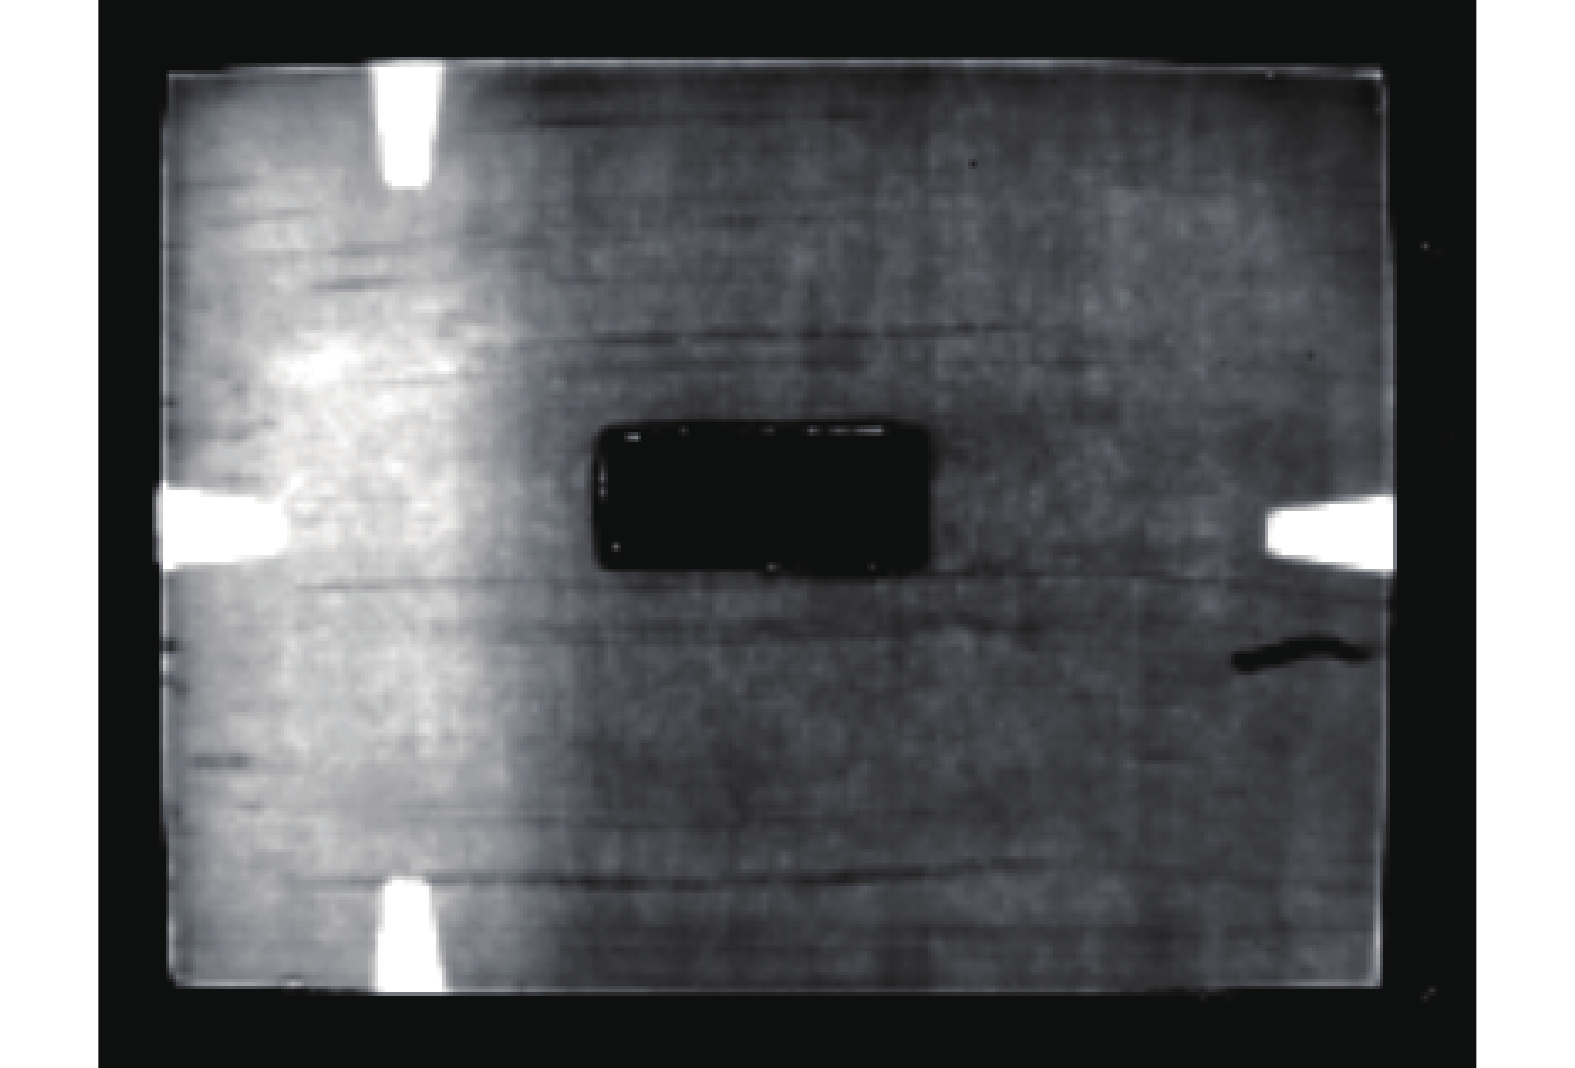
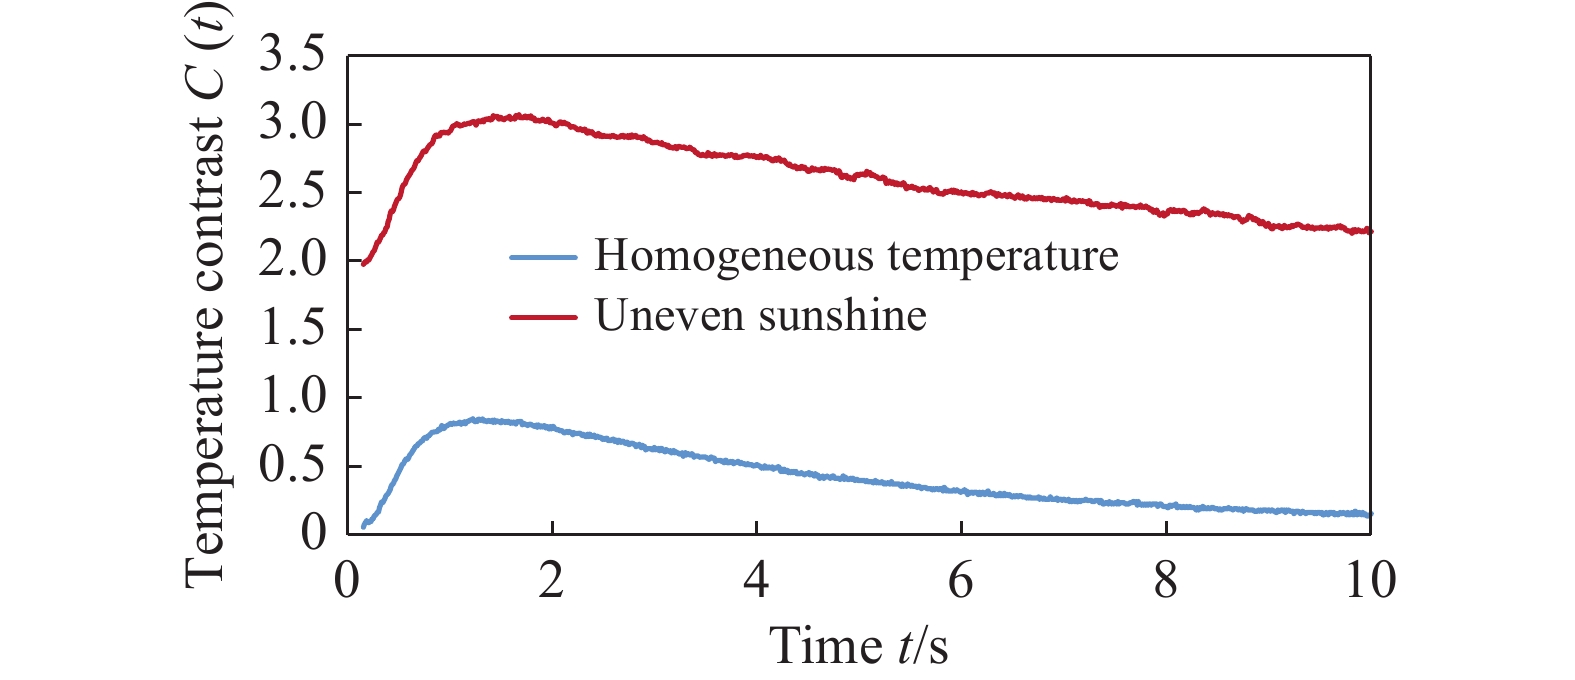
    • 将试块第一列埋深为0.5 mm的缺陷右侧用铝箔遮盖,然后放到太阳下直晒1 min,然后迅速拿回到室内进行检测实验。将埋深为0.5 mm缺陷的0.15~10 s范围内温差ΔT(t)曲线和温度对比度C(t)曲线与试块温度均匀(25 ℃)时的检测结果进行对比。图12t =1.102 s时刻的红外热成像图,图中左侧区域明显要亮于(温度高于)右侧区域。图13为日照不均引起温差ΔT(t)变化的实验结果。图14为日照不均引起温度对比度C(t)变化的实验结果。

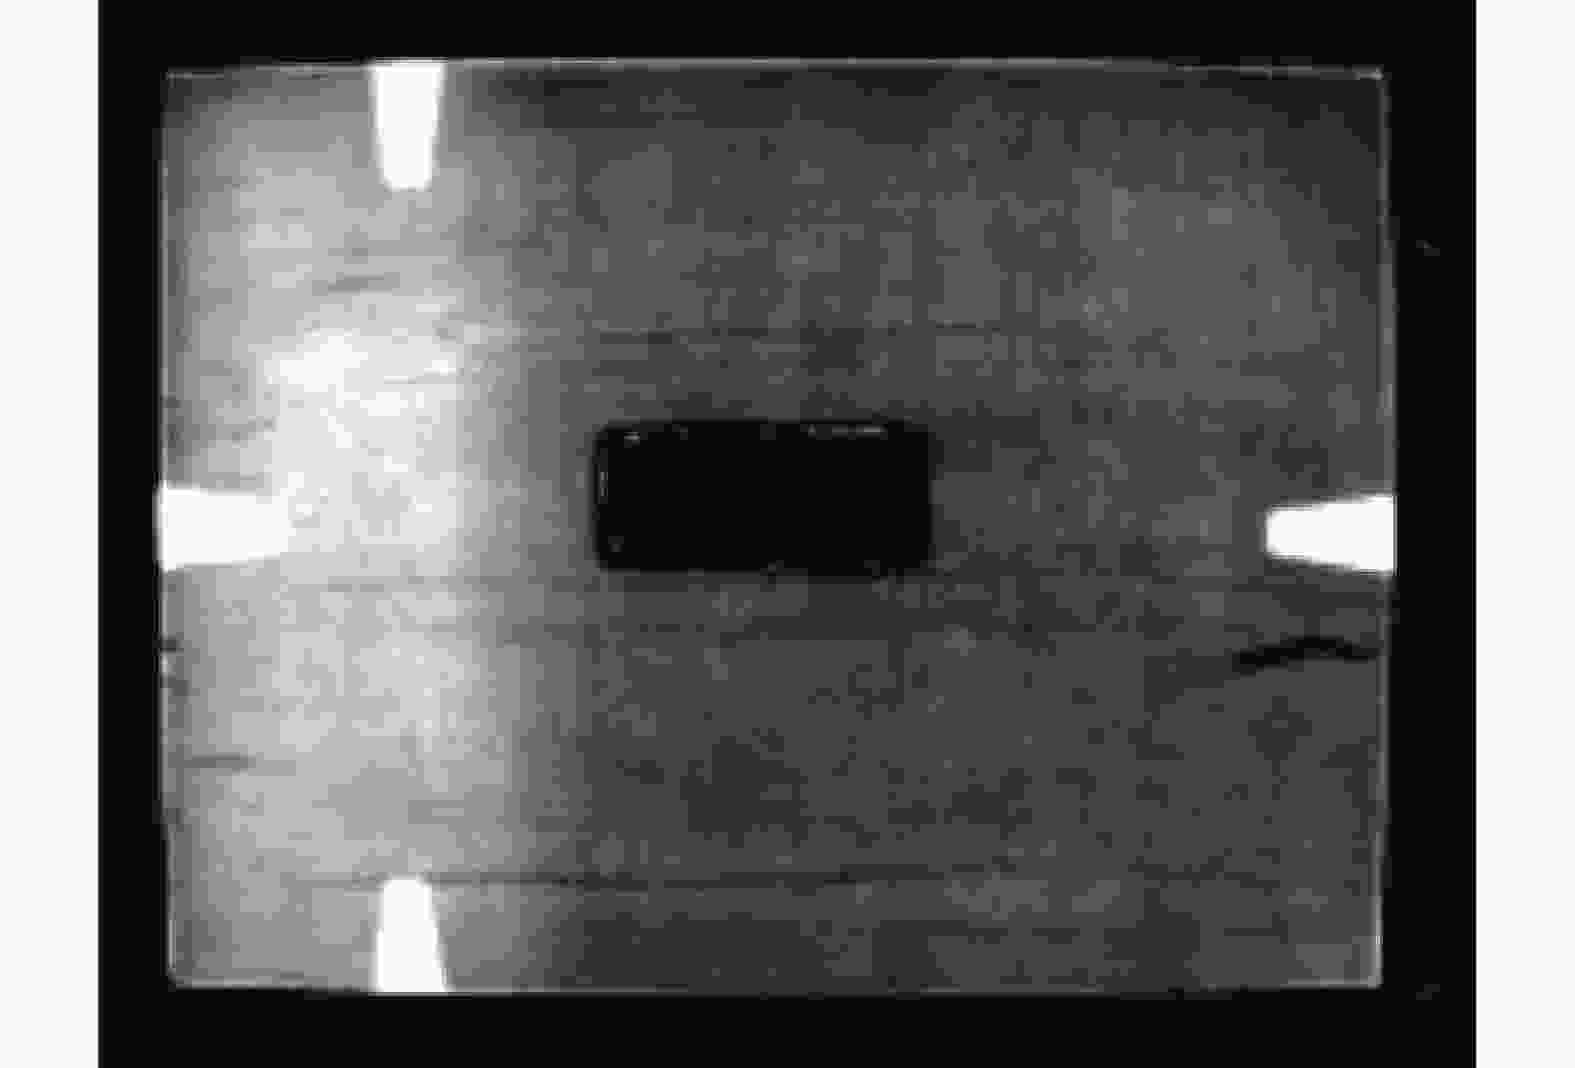
      Figure 12.  Thermal image t =1.102 s of the specimen in uneven sunshine before experiment

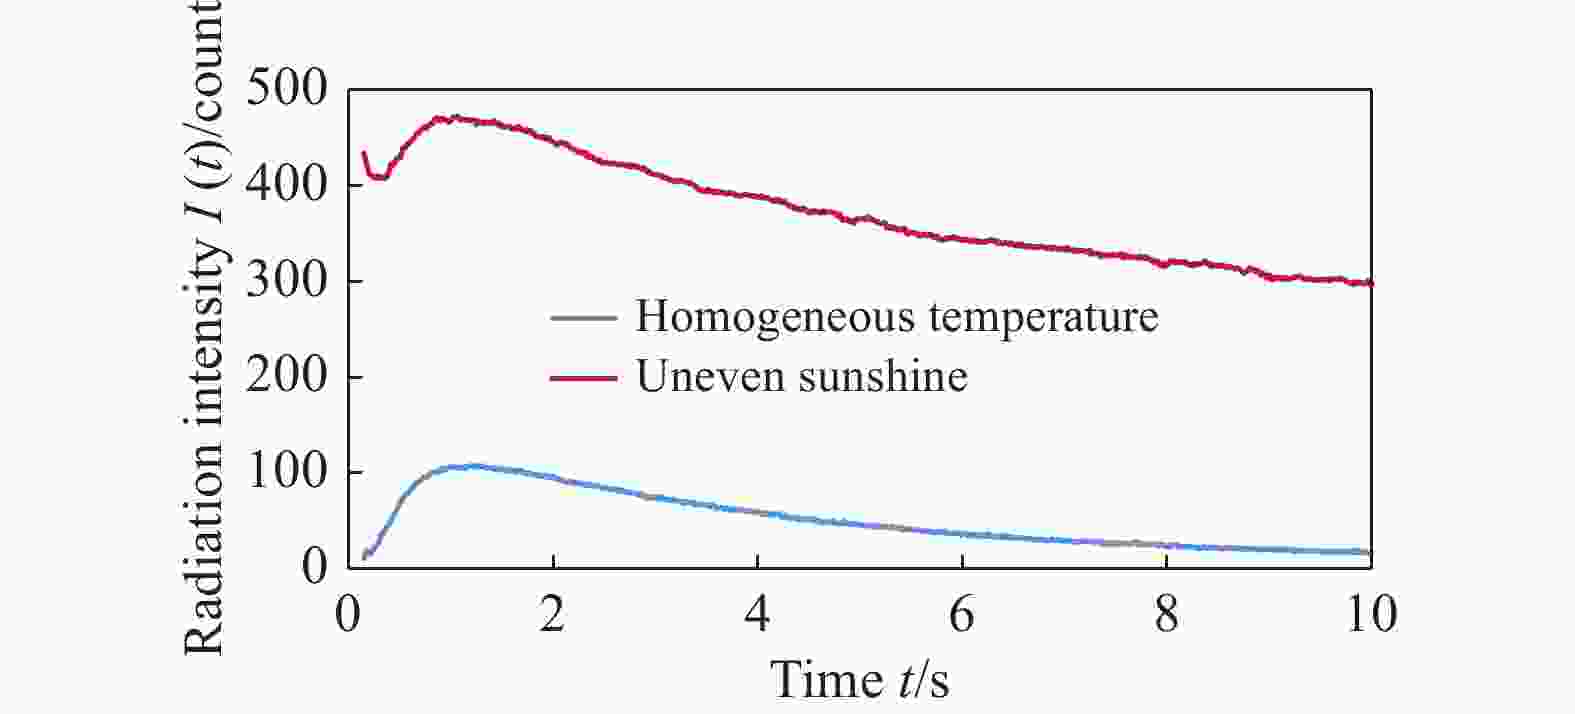
      Figure 13.  Experiment result of temperature difference ΔT(t) in uneven sunshine and in homogeneous temperature

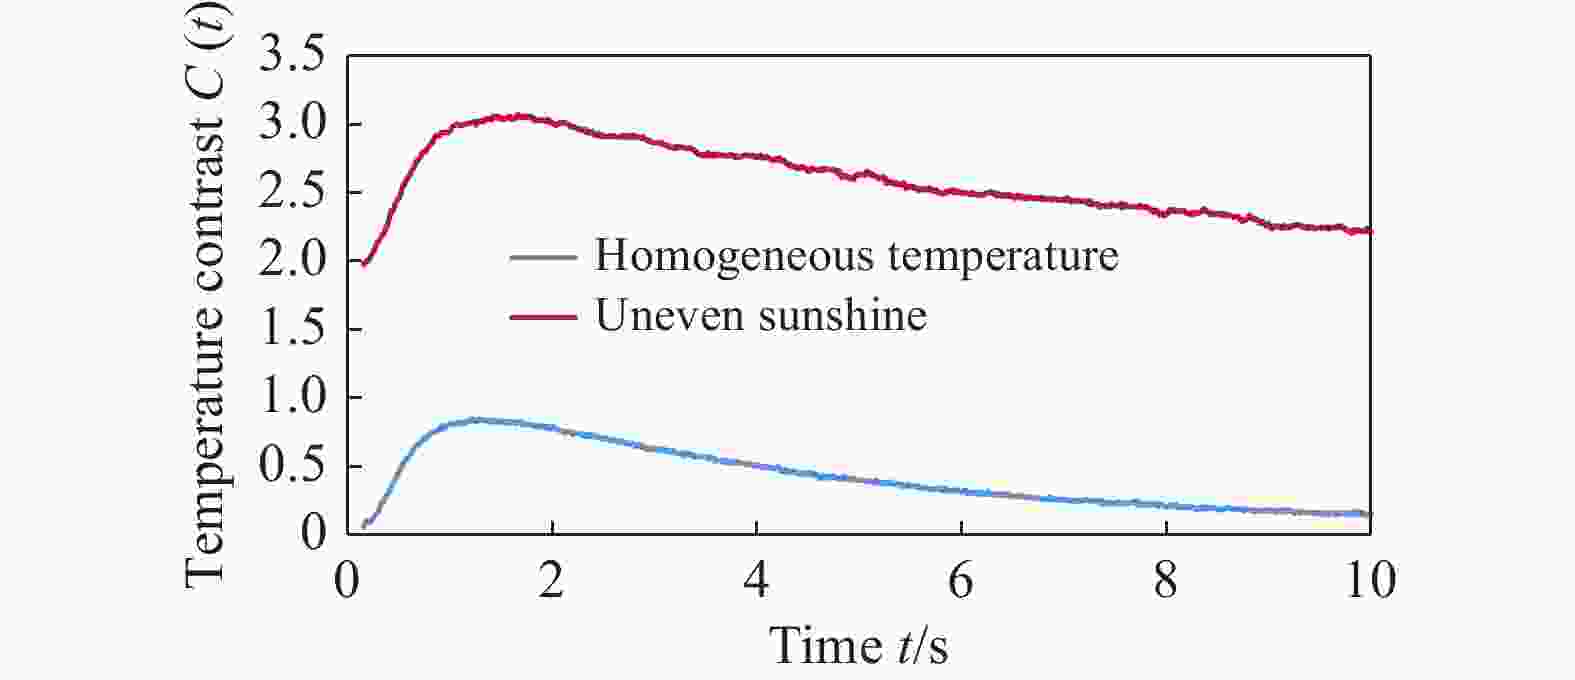
      Figure 14.  Experiment result of temperature contrast C(t) in uneven sunshine and in homogeneous temperature

      通过日照不均和均匀温度下实验结果对比,可见日照不均引起ΔTmCm明显增高,这与仿真结果得到的变化趋势相一致。这样的变化易造成太阳直射区域无缺陷区与参考的未被阳光加热的无缺陷区之间出现明显的ΔTmCm,易将该无缺陷区误判为缺陷。

      若被阳光直接照射的不是缺陷区,而是参考的无缺陷区,则ΔTmCm的变化趋势相反,都呈减小的趋势,从而降低了缺陷的可检性和清晰程度,易造成漏检。

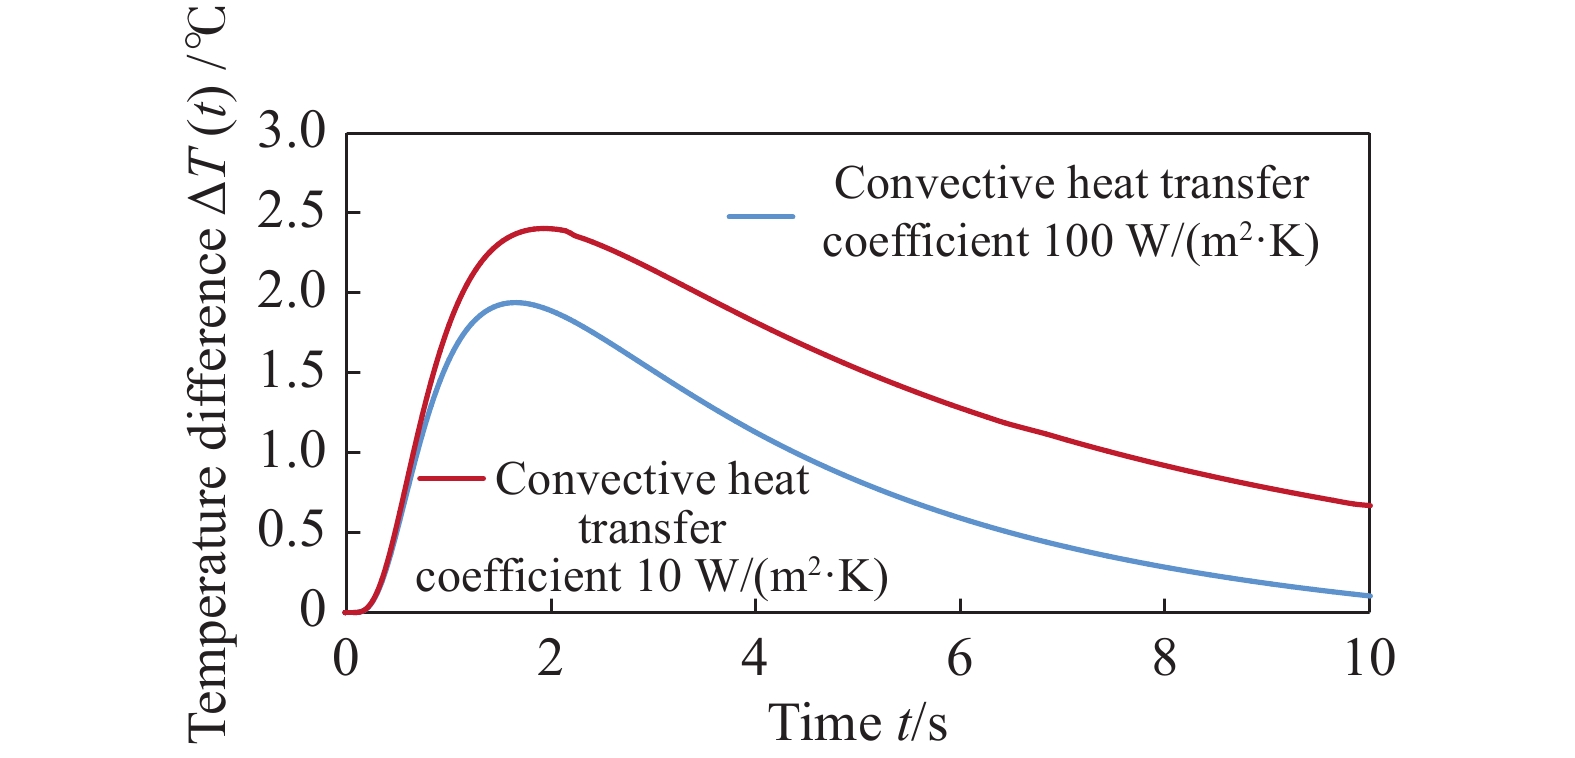
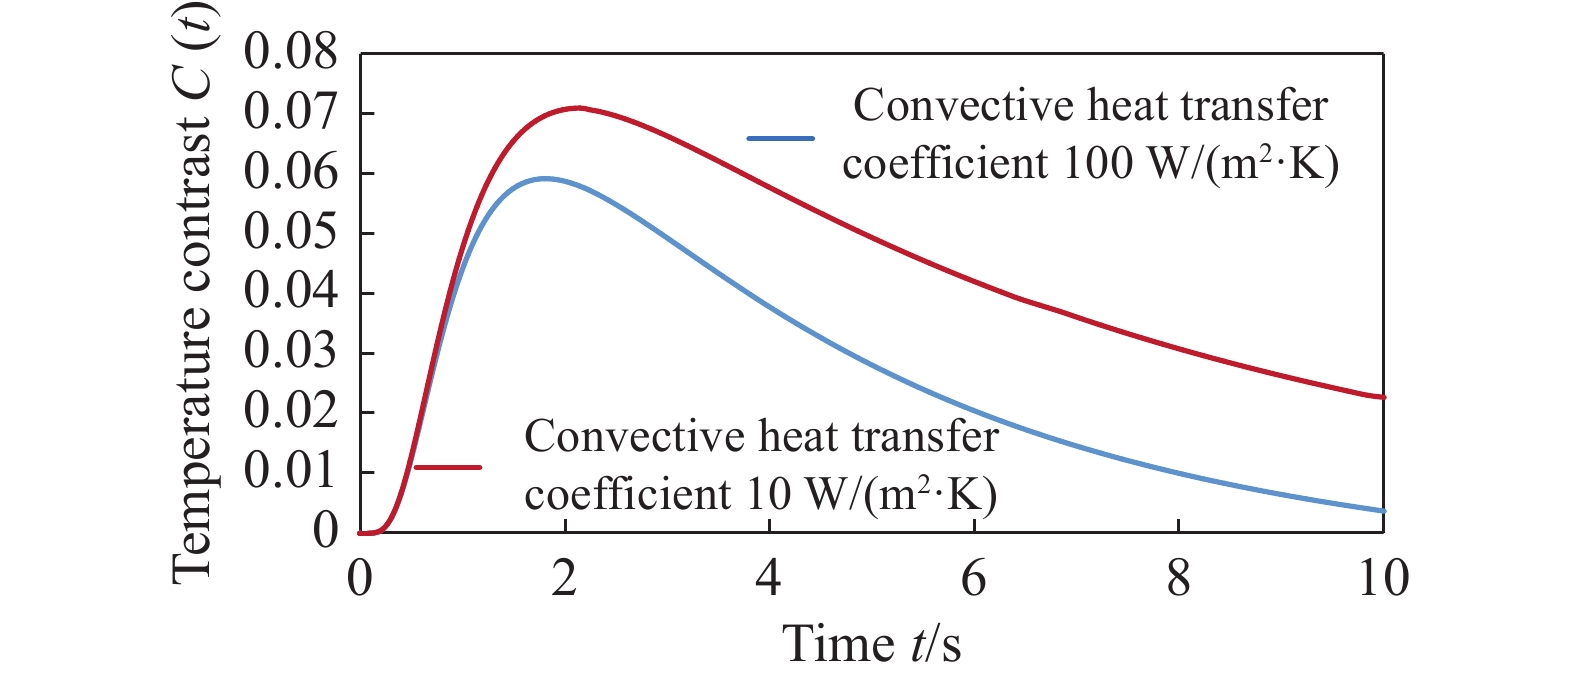
    • 为了考察外场检测时不同风速对红外热成像检测的影响,采取改变模型中冷却阶段对流换热系数的方式进行仿真。模型中对流换热系数分别设为10 W/(m2·K)和100 W/(m2·K),其他边界条件不变。不同对流换热条件下的仿真结果见图15图16

      Figure 15.  Simulation result of temperature difference ΔT(t) in different wind velocity

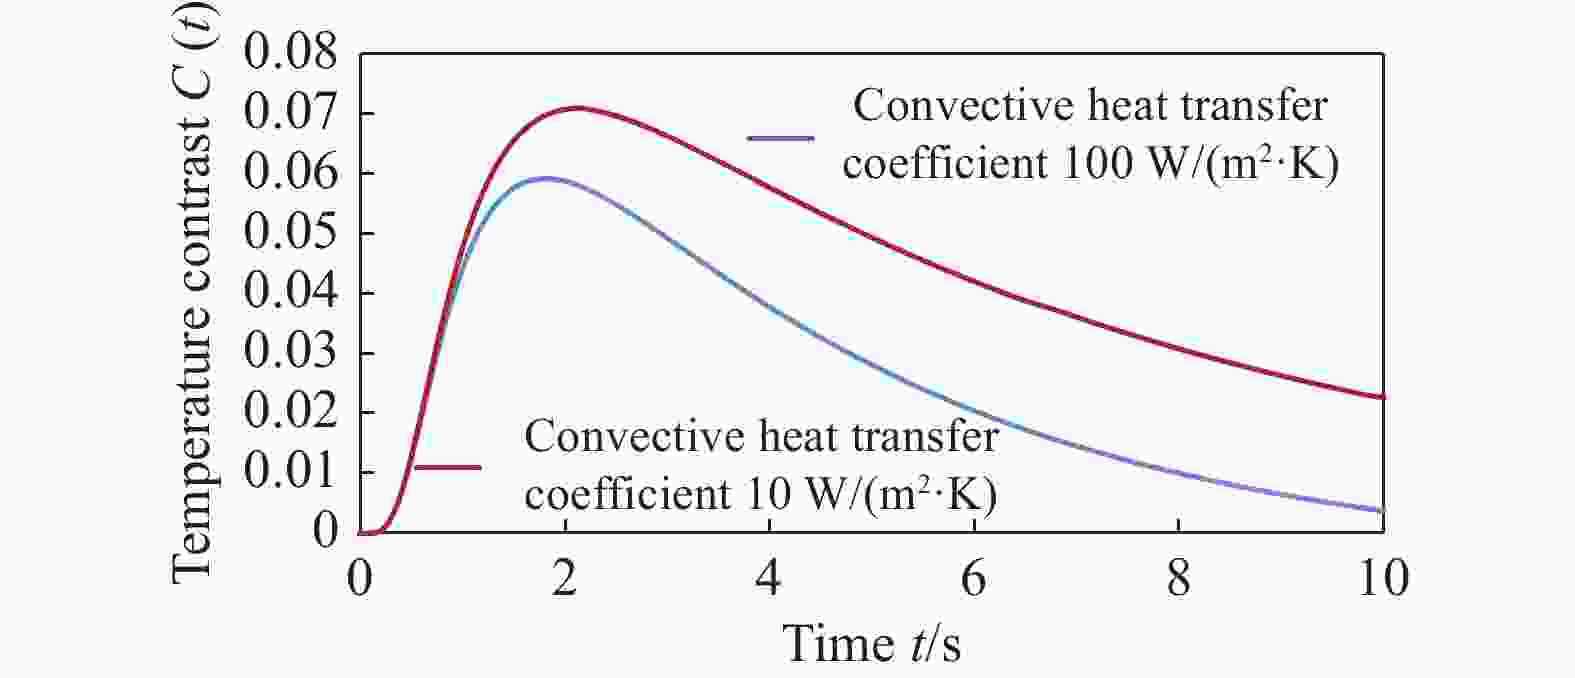
      Figure 16.  Simulation result of temperature contrast C(t) in different wind velocity

      从建模仿真的结果中可以发现,风速增大,对流换热系数提高,使得ΔTmCm明显下降。

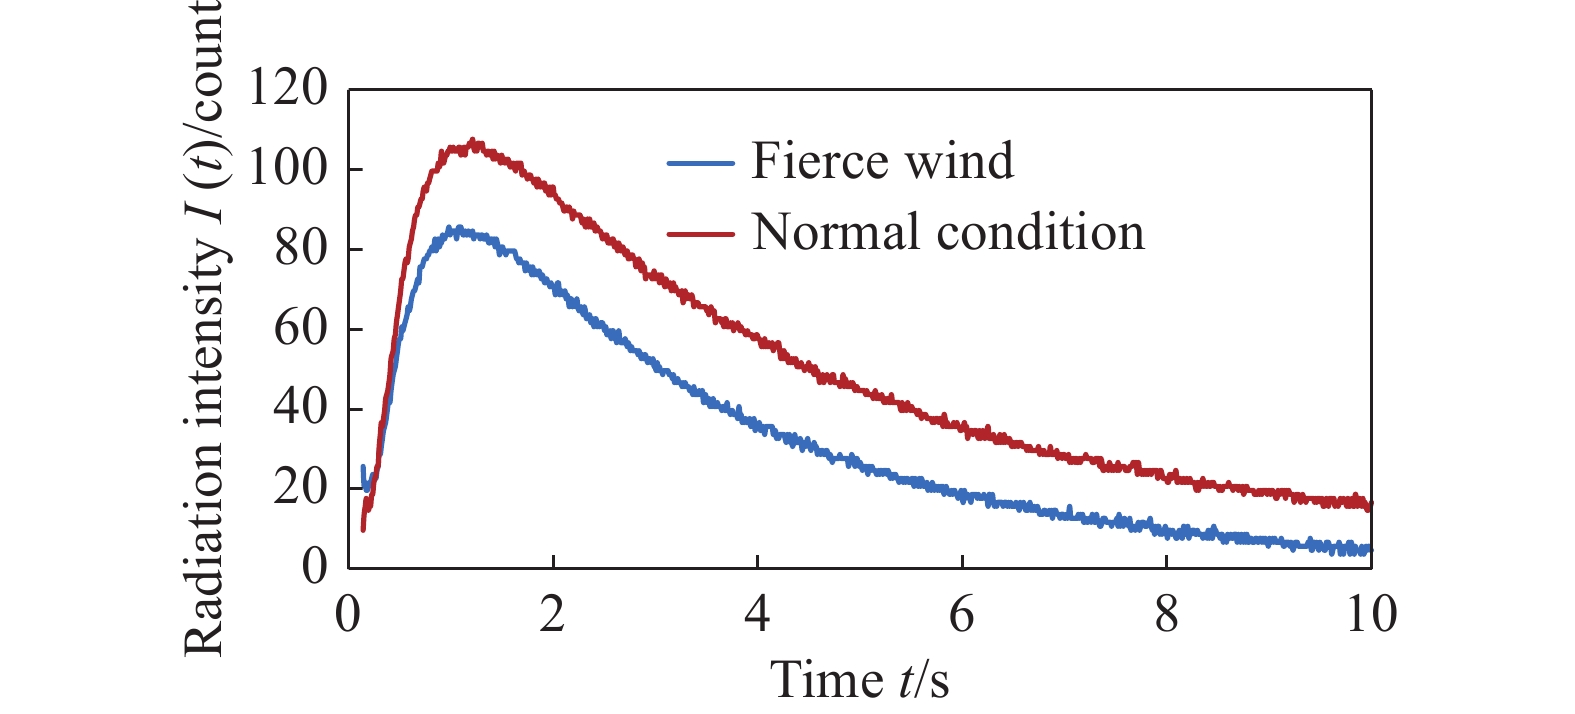
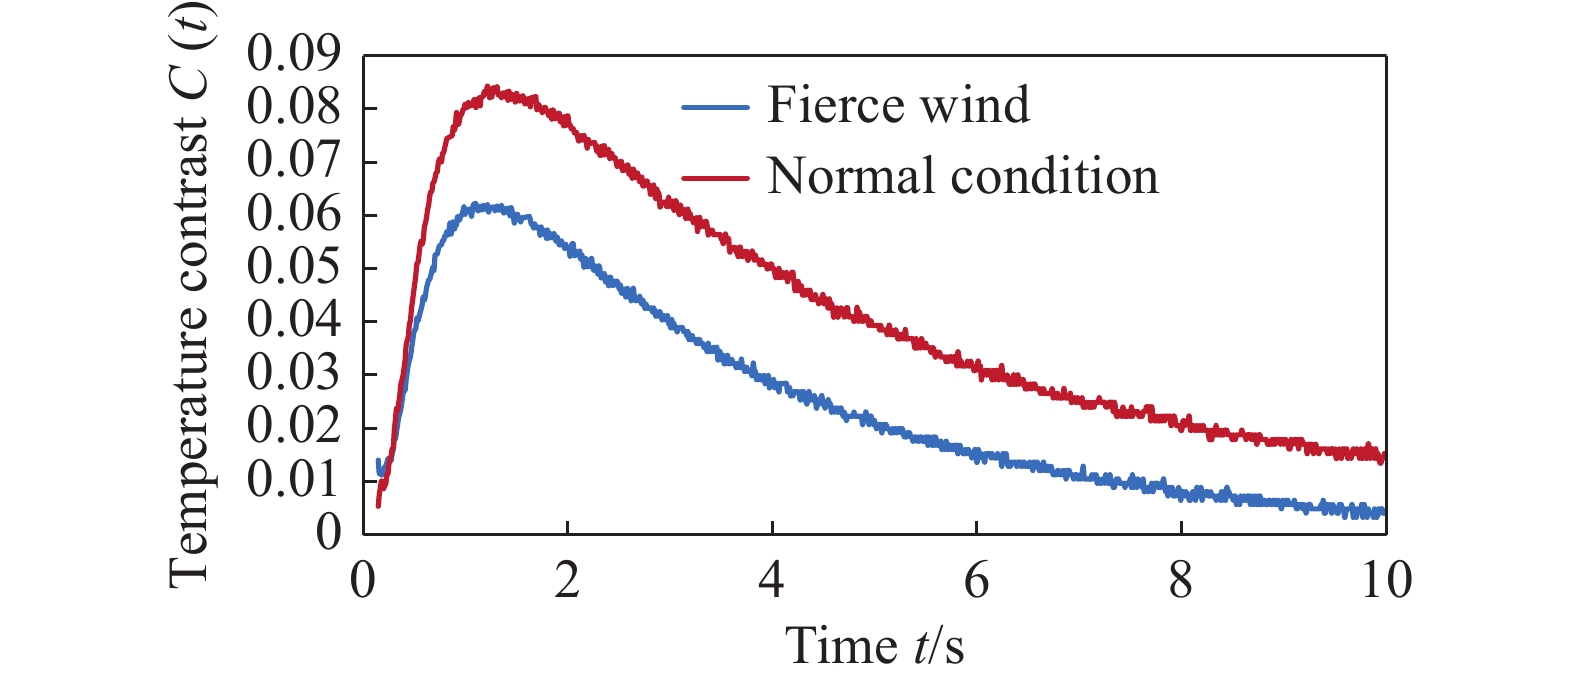
    • 为了模拟较高风速环境的实验条件,在试块检测过程中采用电吹风直吹被检测表面的方式。检测参数同前,截取0.15~10 s的数据进行分析,与仿真结果进行对比。埋深为0.5 mm的缺陷温差ΔT(t)和温度对比度C(t)变化见图17图18

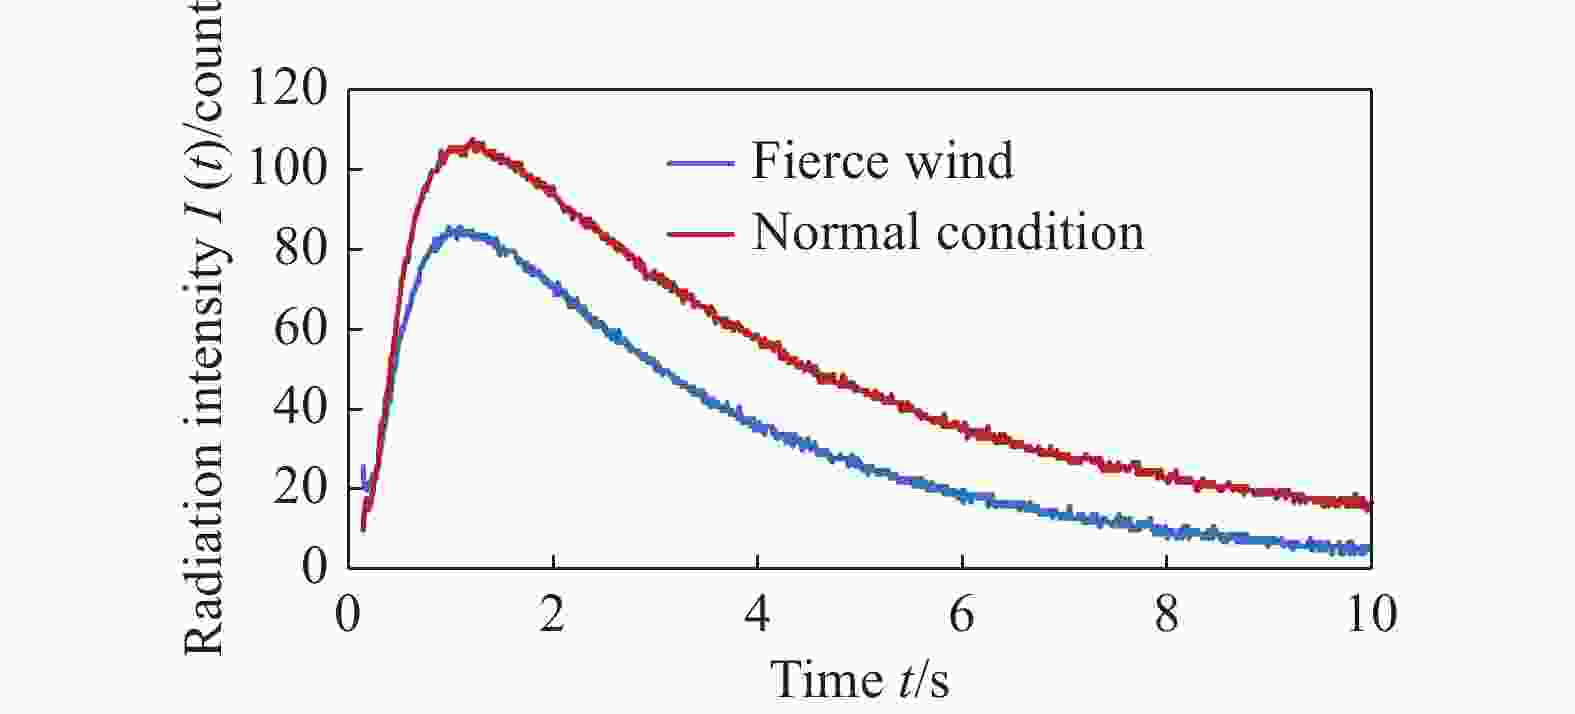
      Figure 17.  Experiment result of temperature difference ΔT(t) in different wind velocity

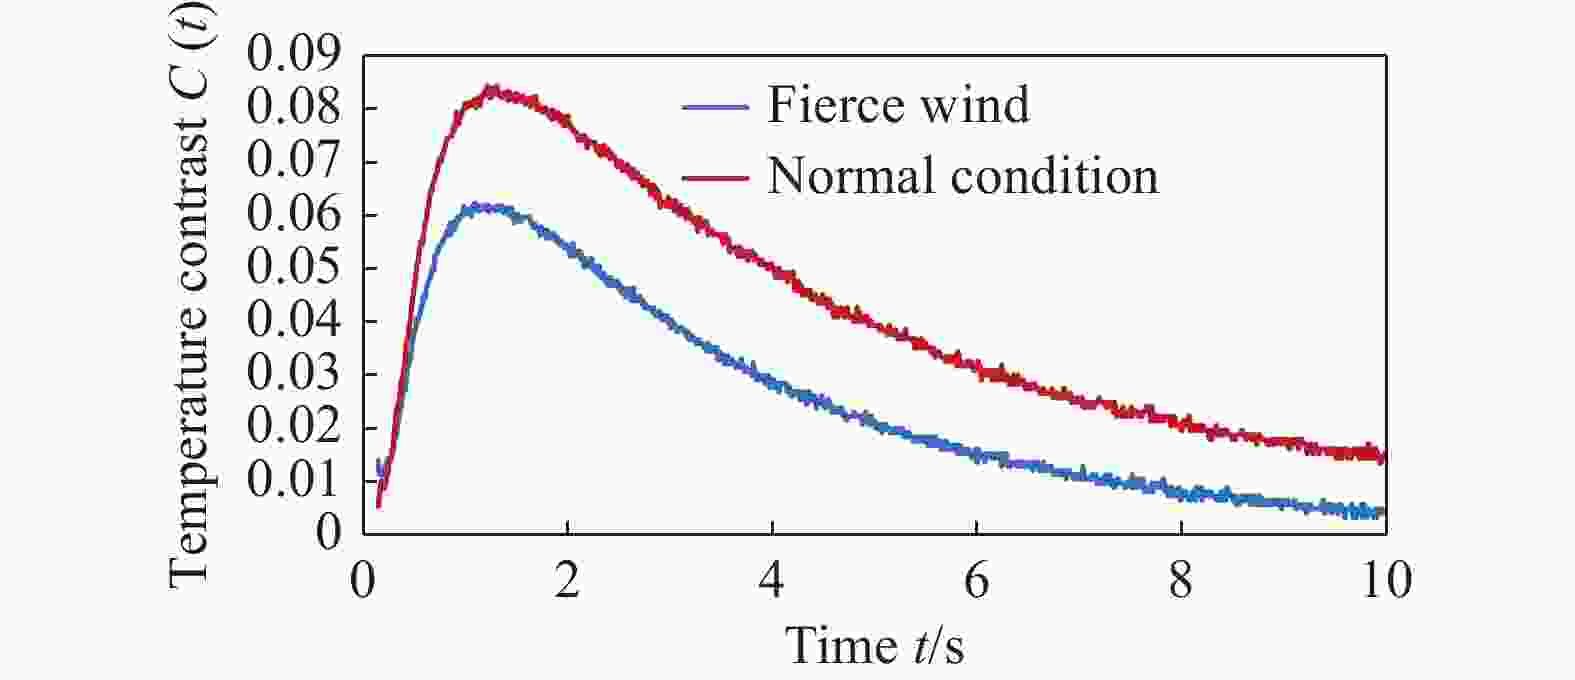
      Figure 18.  Experiment result of temperature contrast C(t) in different wind velocity

      实验结果中,强风条件下ΔTmCm明显减小,与仿真结果中的变化一致。ΔTmCm减小,反映了缺陷可检性降低,缺陷的清晰程度下降。

    • 基于仿真结果和试块实验结果,可以得出以下结论:

      (1)通过25 ℃和30 ℃两种不同环境温度下的分层缺陷建模分析和实验研究发现:不论是温差ΔT(t)还是温度对比度C(t)其后半段随着检测环境温度的升高,都有下降的趋势,尤其是温度对比度C(t)的最大值Cm随着检测环境温度的升高,明显变小。Cm的减小,反映的是缺陷清晰程度的下降,这一变化不利于缺陷的检出。因此检测环境温度较高对检测结果的评判有一定不利影响。

      (2)通过对日照不均和均匀温度(25 ℃)两种检测条件的建模分析和实验研究发现:若含缺陷的区域被太阳直射,而参考的无缺陷区未被直射,这种日照不均使得温差ΔT(t)和温度对比度C(t)的最大值ΔTmCm升高,而被直射的无缺陷区也会出现相对于参考的无缺陷区明显的ΔTmCm,易造成无缺陷区误判为缺陷;若参考的无缺陷区被直射,而含缺陷的区域未被直射,则这种日照不均使得温差ΔT(t)和温度对比度C(t)的最大值ΔTmCm降低,易造成缺陷漏检。因此,实际外场检测时日照不均需要避免。

      (3)通过对流换热系数分别设为10 W/(m2·K)和100 W/(m2·K)的建模仿真分析和利用电吹风强制散热模拟的强风条件与常规条件实验对比发现:随着风速的增加,温差ΔT(t)和温度对比度C(t)的最大值ΔTmCm会明显变小。ΔTmCm变小对检测不利,缺陷的可检性和缺陷的清晰程度都会下降。因此,不宜在较高风速的外场条件下进行检测。

      文中只是从红外热成像原始热图角度说明环境因素的影响,事实上有一些数据处理算法对个别环境因素有一定的抑制作用,该问题已经超出了文中研究范围,此处不做展开讨论。

Reference (15)

Catalog

    /

    DownLoad:  Full-Size Img  PowerPoint
    Return
    Return