Volume 51 Issue 8
Aug.  2022
Turn off MathJax
Article Contents

Zeng Qingwei, Liu Lei, Hu Shuai, Li Shulei, Chen Ming. Photoacoustic image reconstruction of femtosecond laser filaments based on multilinear array detection[J]. Infrared and Laser Engineering, 2022, 51(8): 20210774. doi: 10.3788/IRLA20210774
Citation: Zeng Qingwei, Liu Lei, Hu Shuai, Li Shulei, Chen Ming. Photoacoustic image reconstruction of femtosecond laser filaments based on multilinear array detection[J]. Infrared and Laser Engineering, 2022, 51(8): 20210774. doi: 10.3788/IRLA20210774

Photoacoustic image reconstruction of femtosecond laser filaments based on multilinear array detection

doi: 10.3788/IRLA20210774
Funds:  National Natural Science Foundation of China (42105176);Natural Science Foundation of Hunan Province(2020JJ4662, 2021JJ40664, 2021 JJ10047)
  • Received Date: 2021-10-22
  • Rev Recd Date: 2021-12-27
  • Accepted Date: 2022-01-21
  • Available Online: 2022-08-31
  • Publish Date: 2022-08-31
  • To finely describe the internal spatial structure characteristics of femtosecond laser filaments, the forward propagation process of ultrasound induced by optical filaments is first simulated in fine detail, and then different photoacoustic tomography image reconstruction algorithms, such as the universal back projection algorithm (UBP), delay and sum (DAS) and superiorized photo-acoustic nonnegative reconstruction algorithm (SPANNER), are used to perform reverse reconstruction image of filaments. The results theoretically verify the feasibility of using a multiple linear array detection to reconstruct the axial r-z section of a single filament and multiple filaments. The results show that the maximum frequency of the ultrasonic signal induced by a single filament and multiple filaments at a detection distance of 3 mm is approximately 5 MHz. Photoacoustic tomography can accurately retrieve the single filament position and r-z section profile, but the reconstruction effects of different image reconstruction algorithms are quite different. The UBP algorithm has obvious artifacts in the reconstruction of filaments; the DAS algorithm overestimates the diameter of light filaments due to the "finite aperture effect"; the SPANNER has the best effect on multiwire image reconstruction because it uses optimal theory to improve the nonlinear conjugate gradient operator and realize nonnegative and anisotropic total variational regularization, which can effectively avoid noise interference. The results of this study have certain reference value for revealing the structural characteristics of laser filaments and promoting the laser filamentation based atmospheric application research.
  • [1] Couairon A, Mysyrowicz A. Femtosecond filamentation in transparent media [J]. Physics Reports, 2007, 441(2-4): 47-189. doi:  https://doi.org/10.1016/j.physrep.2006.12.005.
    [2] 胡瑜泽, 聂劲松, 孙 可, 等. 不同能量背景的环形艾里飞秒激光光束大气成丝特性 [J]. 红外与激光工程, 2017(46): 0806005. doi:  10.3788/IRLA201746.0806005

    Hu Y, Nie J, Hu K, et al. Air filamentation characteristics of ring Airy femtosecond laser beam with different background energies [J]. Infrared and Laser Engineering, 2017, 46(8): 0806005. (in Chinese) doi:  10.3788/IRLA201746.0806005
    [3] Kasparian J, Rodriguez M, Mejean G, et al. White light filaments for atmospheric analysis [J]. Science, 2003, 301(5629): 61-64. doi:  10.1126/science.1085020
    [4] Point G, Arantchouk L, Thouin E, et al. Long-lived laser-induced arc discharges for energy channeling applications [J]. Scientific Reports, 2017, 7: 13801. doi:  https://doi.org/10.1038/s41598-017-14054-z
    [5] Produit T, Walch P, Schimmel G, et al. HV discharges triggered by dual- and triple-frequency laser filaments [J]. Optics Express, 2019, 27(8): 11339-11347. doi:  10.1364/OE.27.011339
    [6] Sun H Y, Liu Y L, Ju J J, et al. Picosecond laser-induced water condensation in a cloud chamber [J]. Optics Express, 2016, 24(18): 20494-20506. doi:  https://doi.org/10.1364/OE.24.020494
    [7] Rohwetter P, Kasparian J, Stelmaszczyk K, et al. Laser-induced water condensation in air [J]. Nature Photonics, 2010, 4(7): 451-456. doi:  10.1038/nphoton.2010.115
    [8] 曾庆伟, 高太长, 刘磊, 等. 飞秒激光成丝诱导形成水凝物的机理研究进展 [J]. 红外与激光工程, 2019(48): 0406002. doi:  10.3788/IRLA201948.0406002

    Zeng Qingwei, Gao Taichang, Liu Lei, et al. Advances in mechanism research of femtosecond laser filamentation induced hydrometeors formation [J]. Infrared and Laser Engineering, 2019, 48(4): 0406002. (in Chinese) doi:  10.3788/IRLA201948.0406002
    [9] Chin S L, Wang T J, Marceau C, et al. Advances in intense femtosecond laser filamentation in air [J]. Laser Physics, 2012, 22(1): 1-53. doi:  10.1134/S1054660X11190054
    [10] Wolf J P. Short pulse lasers for weather control [J]. Reports on Progress in Physics Physical Society, 2018, 81(2): 026001. doi:  10.1088/1361-6633/aa8488
    [11] Zeng Q W, Liu L, Ju J J, et al. Numerical investigation on the heat deposition characteristics of femtosecond laser pulses undergoing multiple filaments [J]. Physica Scripta, 2020, 95(8): 085605. doi:  10.1088/1402-4896/aba0fa
    [12] Ma C L, Jia M Z, Lin W B, et al. Extending optical filaments of annular beams via square root spatial phase modulation [J]. Optics Communications, 2020, 458: 124828. doi:  https://doi.org/10.1016/j.optcom.2019.124828
    [13] Feng Z F, Li W, Yu X C, et al. Influence of the external focusing and the pulse parameters on the propagation of femtosecond annular Gaussian filaments in air [J]. Optics Express, 2016, 24(6): 6381-6390. doi:  https://doi.org/10.1364/OE.24.006381
    [14] Geints Y E, Zemlyanov A A. Single and multiple filamentation of multiterawatt CO2-laser pulses in air: Numerical simulations [J]. Journal of the Optical Society of America B, 2014, 31(4): 788-797. doi:  https://doi.org/10.1364/JOSAB.31.000788
    [15] 俞进, 郝作强, 张杰. 用声学诊断方法测量激光等离子体通道的长度与电子密度 [J]. 物理学报, 2005(54): 1290-1294. doi:  10.7498/aps.54.1290

    Hao Zuoqiang, Yu Jin, Zhang Jie, et al. Acoustic diagnostics of plasma channels in air induced by intense femtosecond laser pulses [J]. Acta Phys Sin, 2005, 54(3): 1290-1294. (in Chinese) doi:  10.7498/aps.54.1290
    [16] Velten A, Andreas S S, Diels J C, et al. Videos of light filamentation in air [J]. Journal of Physics B: Atomic, Molecular and Optical Physics, 2015, 48(9): 094020. doi:  10.1088/0953-4075/48/9/094020/pdf
    [17] Zhou B, Akturk S, Prade B, et al. Revival of femtosecond laser plasma filaments in air by a nanosecond laser [J]. Optics Express, 2009, 17(14): 11450-11456. doi:  https://doi.org/10.1364/OE.17.011450
    [18] 郝作强, 张杰, 俞进, 等. 空气中激光等离子体通道的荧光探测和声学诊断两种方法的比较实验研究 [J]. 物理学报, 2006(55): 299-302. doi:  10.3321/j.issn:1000-3290.2006.01.053

    Hao Zuoqiang, Zhang Jie, Yu Jin, et al. Fluorescence measure-ment and acoustic diagnostics of plasma channels in air [J]. Acta Phys Sin, 2006, 55(1): 299-302. (in Chinese) doi:  10.3321/j.issn:1000-3290.2006.01.053
    [19] Rumiantsev B, Mareev E I, Bychkov A, et al. Photoacoustic and optical imaging of the femtosecond filament in water [C]//Proceedings of SPIE, 2019, 11026: 1102606.
    [20] Point G, Brelet Y, Houard A, et al. Superfilamentation in air [J]. Physical Review Letters, 2014(112): 223902.
    [21] Chen Y H, Varma S, Antonsen T M, et al. Direct measurement of the electron density of extended femtosecond laser pulse-induced filaments [J]. Physical Review Letters, 2010, 105(21): 215005. doi:  10.1103/PhysRevLett.105.215005
    [22] Tzortzokis S, Méchain G, Patalano G, et al. Coherent subterahertz radiation from femtosecond infrared filaments in air [J]. Optics Letters, 2002, 27(21): 1944-1946. doi:  10.1364/OL.27.001944
    [23] Mareeva E I, Migal E A, Potemkin F V. Ultrafast third harmonic generation imaging of microplasma at the threshold of laser-induced plasma formation in solids [J]. Applied Physics Letters, 2019, 114(3): 031106. doi:  https://doi.org/10.1063/1.5080660
    [24] Rumiantsev B V, Mareev E I, Bychkov A S, et al. Three-dimensional hybrid optoacoustic imaging of the laser-induced plasma and deposited energy density under optical breakdown in water [J]. Applied Physics Letters, 2021, 118(1): 011109. doi:  https://doi.org/10.1063/5.0032513
    [25] Yu J, Mondelain D, Kasparian J, et al. Sonographic probing of laser filaments in air [J]. Applied Optics, 2003, 42(36): 7117-7120. doi:  https://doi.org/10.1364/AO.42.007117
    [26] Jukna V, Jarnac A, Milián C, et al. Underwater acoustic wave generation by flamentation of terawatt ultrashort laser pulses [J]. Physical Review E, 2016, 93(6): 063106. doi:  10.1103/physreve.93.063106
    [27] Rosenthal E W, Palastro J P, Jhajj N, et al. Sensitivity of propagation and energy deposition in femtosecond filamentation to the nonlinear refractive index [J]. Journal of Physics B:Atomic, Molecular and Optical Physics, 2015, 48(9): 094011-094019. doi:  10.1088/0953-4075/48/9/094011
    [28] Point G, Thouin E, Mysyrowicz A, et al. Energy deposition from focused terawatt laser pulses in air undergoing multiflamentation [J]. Optics Express, 2016, 24(6): 6271-6282. doi:  https://doi.org/10.1364/OE.24.006271
    [29] Bychkov A S, Cherepetskaya E B, Karabutov A A, et al. Laser optoacoustic tomography for the study of femtosecond laser filaments in air [J]. Laser Physics Letters, 2016, 13(8): 085401. doi:  10.1088/1612-2011/13/8/085401
    [30] Mareev E I, Lvov K V, Rumiantsev B V, et al. Effect of pulse duration on the energy delivery under nonlinear propagation of tightly focused Cr: forsterite laser radiation in bulk silicon [J]. Laser Physics Letters, 2020, 17(1): 015402. doi:  10.1088/1612-202X/ab5d23
    [31] Potemkin F V, Mareev E I, Rumiantsev B V, et al. Two-dimensional photoacoustic imaging of femtosecond filament in water [J]. Laser Physics Letters, 2018, 15(7): 075403. doi:  10.1088/1612-202X/aabc99
    [32] Treeby B E, Wise E S, Kuklis F, et al. Nonlinear ultrasound simulation in an axisymmetric coordinate system using a k-space pseudospectral method [J]. The Journal of the Acoustical Society of America, 2020, 148(4): 2288-2300. doi:  https://doi.org/10.1121/10.0002177
    [33] Tabei M, Mast T D, Waag R C. A k-space method for coupled first-order acoustic propagation equations [J]. The Journal of the Acoustical Society of America, 2002, 111(1): 53-63. doi:  10.1121/1.1421344
    [34] Treeby B E, Wise E S, Cox B T. Nonstandard Fourier pseudospectral time domain (PSTD) schemes for partial differential equations [J]. Communications in Computational Physics, 2017, 24(3): 623-634. doi:  10.4208/cicp.OA-2017-0192
    [35] Treeby B E, Jaros J, Rendell A P, et al. Modeling nonlinear ultrasound propagation in heterogeneous media with power law absorption using a k-space pseudospectral method [J]. Journal of the Acoustical Society of America, 2012, 131(6): 4324-4336. doi:  10.1121/1.4712021
    [36] Xu M H, Wang L V. Universal back-projection algorithm for photoacoustic computed tomography [J]. Physical Review E, 2005, 71(1 Pt 2): 016706. doi:  10.1103/PhysRevE.71.016706
    [37] Steinberg I, Kim J, Schneider M K, et al. Superiorized photo-acoustic non-negative reconstruction (SPANNER) for clinical photoacoustic imaging [J]. IEEE Transactions on Medical Imaging, 2021, 40(7): 1888-1897. doi:  10.1109/TMI.2021.3068181
    [38] Zhou W, Bovik A C, Sheikh H R, et al. Image quality assess-ment: from error visibility to structural similarity [J]. IEEE Transactions on Image Processing, 2004, 13(4): 600-612. doi:  10.1109/TIP.2003.819861
  • 加载中
通讯作者: 陈斌, bchen63@163.com
  • 1. 

    沈阳化工大学材料科学与工程学院 沈阳 110142

  1. 本站搜索
  2. 百度学术搜索
  3. 万方数据库搜索
  4. CNKI搜索

Figures(9)

Article Metrics

Article views(218) PDF downloads(36) Cited by()

Related
Proportional views

Photoacoustic image reconstruction of femtosecond laser filaments based on multilinear array detection

doi: 10.3788/IRLA20210774
  • 1. College of Meteorology and Oceanography, National University of Defense Technology, Changsha 410073, China
  • 2. 31110 Troops of PLA, Nanjing 211101, China
Fund Project:  National Natural Science Foundation of China (42105176);Natural Science Foundation of Hunan Province(2020JJ4662, 2021JJ40664, 2021 JJ10047)

Abstract: To finely describe the internal spatial structure characteristics of femtosecond laser filaments, the forward propagation process of ultrasound induced by optical filaments is first simulated in fine detail, and then different photoacoustic tomography image reconstruction algorithms, such as the universal back projection algorithm (UBP), delay and sum (DAS) and superiorized photo-acoustic nonnegative reconstruction algorithm (SPANNER), are used to perform reverse reconstruction image of filaments. The results theoretically verify the feasibility of using a multiple linear array detection to reconstruct the axial r-z section of a single filament and multiple filaments. The results show that the maximum frequency of the ultrasonic signal induced by a single filament and multiple filaments at a detection distance of 3 mm is approximately 5 MHz. Photoacoustic tomography can accurately retrieve the single filament position and r-z section profile, but the reconstruction effects of different image reconstruction algorithms are quite different. The UBP algorithm has obvious artifacts in the reconstruction of filaments; the DAS algorithm overestimates the diameter of light filaments due to the "finite aperture effect"; the SPANNER has the best effect on multiwire image reconstruction because it uses optimal theory to improve the nonlinear conjugate gradient operator and realize nonnegative and anisotropic total variational regularization, which can effectively avoid noise interference. The results of this study have certain reference value for revealing the structural characteristics of laser filaments and promoting the laser filamentation based atmospheric application research.

    • 当入射峰值功率高于自聚焦临界功率数倍的飞秒激光脉冲在光学介质中传输时,由于光学克尔自聚焦效应和等离子体散焦效应相互竞争,当二者达到动态平衡时会形成一种自导引传输的等离子体结构,即激光成丝(laser filamentation)[1-2]。近年来,强飞秒激光脉冲在大气中长距离传输成丝现象,在远程遥感大气成分[3]、引导放电[4-5]和诱导水汽凝结[6-8]等方面展现出重要的潜在应用价值,引起了广泛关注[9-10]

      飞秒激光成丝大气传输特性是其诸多应用的重要基础之一。目前,利用数值模拟和实验测量的方法,研究者们对光丝的形成过程和传输特性进行了大量研究[11-14]。在实验测量中,光丝初始成丝位置、传输长度、强度和光斑轮廓等总体特征参量较容易获得[15-17]。然而,由于光丝的直径很小(~100 μm量级),并且光丝内部的强度极高,如何获得光丝内部空间结构的定量结果难度较大[18-19]。目前,也有一些获取光丝内部空间结构的方法,比如等离子体荧光法[20]、光学干涉法[21]、THz探测法[22]和三次谐波辐射法[23]等。但是,这些方法的具体实施过程相对复杂,灵敏度和分辨率也比较有限[24]

      在光丝形成过程中,部分脉冲能量以热量的形式沉积,并通过热脉冲的形式激发形成“尖锐”的超声信号[25]。该信号携带了其内部丰富的特征信息[25-26]。Rosenthal等人[27]和Point等人[28]利用高频微麦克风采集光丝传输方向上不同位置处的声信号强度信息,间接实现了对光丝线性能量沉积率特征量的估算,但是测量结果分辨率有限且无法给出光丝内部空间能量分布信息。Bychkov等人[29]将医学成像中的光声层析法(Photo-Acoustic Tomography,PAT)引入到光丝内部结构的研究中,并理论验证了该方法重建光丝横截面的可行性。随后,光声层析的方法又被用于飞秒激光在水中和固体中形成光丝的实验测量中[24,30-31]。该方法不仅能够有效重建出光丝的轮廓信息,而且可以反演得到光丝核心和周围能量池的能量沉积密度信息。在传统的光声层析成像中,光声信号的采集主要利用一个超声换能器阵元旋转扫描的方式实现。为了减少信号采集时间和提高测量分辨率,又逐渐出现了多个探测阵元按照环形、平面和球形等形式排列成阵列进行扫描的方式。在现有研究中,已出现利用环形阵列扫描的方式探测光丝声信号,最终获得的是光丝的横截面图像。为了能够获得光丝空间结构的三维信息,就需要通过移动换能器阵列的方式,在不同传输位置处进行多次测量,这样会增加测量系统的复杂度和大大降低其灵敏度。相比于横截面图像重建,由于典型的单条光丝在空间上呈“钟形”结构,因此沿激光传输轴方向(z方向)的图像重建,对于获取光丝的三维空间结构更具意义。为此,文中理论验证了利用多元线性阵列探测的方式来重建飞秒光丝轴向r-z截面图像的可行性,并对比研究了不同图像重建算法对单丝和多丝的轴向截面结构进行重建的影响。研究结果对于定量分析光丝结构特征,促进光丝大气应用发展具有一定参考价值。

    • 为了能够描述空间环境场中非均匀声学特性变化和介质热黏性吸收作用对超声传播的影响,声场传播仿真采用如下形式的轴对称坐标系中全波模型[32]

      式中:p为气压;${\boldsymbol{u}} = {u_{\textit{z}}}{\boldsymbol{\hat z}} + {u_r}{\boldsymbol{\hat r}}$为声学粒子速度;${\boldsymbol{\hat z}}$${\boldsymbol{\hat r}}$分别表示传输轴方向和径向方向上的单位矢量;ρ为声学密度;ρ0为空气质量密度;c0为空气速度;B/A=0.4(无量纲)为空气非线性参数;α0=1.85×10−11 dB/(m·Hz),为吸收系数[29]

      采用k-space时域伪谱法(Pseudospectral Time Domain,PSTD)求解该超声传播模型[33-34]。该方法利用傅里叶谱配置方法(Fourier collocation spectral method)计算空间梯度项,采用k-space有限差分格式在时间上进行积分求解[35]。与其他非线性波在非均匀和有损介质中传播的方法相比,该计算方法在均匀和无损耗介质中线性波传播的极限内是精确和无条件稳定的,并且可以显著减小数值色散。

      为了减小出射波到达计算域边缘发生反射造成的误差,采用分裂场PML边界条件对出射波进行吸收处理[33],形式如下:

      式中:M=20为PML的格点数,m=1,2,3,···, M,表示由内边界向外的PML网格格点位置;ϕ=2表示PML格点内部的吸收系数,单位为Np/s。在轴向方向上,PML应用于计算域两端;在径向上,PML仅用于外边界上。具体计算方案可参见参考文献[32]。

    • 利用多元线性阵列探测器模拟对光丝侧面光声信号扫描采集过程,并通过图像重建算法重构光丝轴向图像。重建算法在光声成像中起着至关重要的作用,目前已有多种图像重建算法提出。文中采用常见的通用反投影算法(Universal Back-Projection,UBP[36])和延迟叠加算法(Delay and Sum,DAS),以及最新发展的SPANNER算法(Superiorized Photo-Acoustic Non-Negative Reconstruction,SPANNER[37])对图像进行重建。其中,UBP算法通常由于其计算高效性,稳定性和兼容任意换能器分布的优势而广泛被采用;DAS算法具有重建速度快、重建图像精度高等优点,是当前光声层析成像的主流成像算法之一;SPANNER算法是在快速叠加共轭梯度算法基础上发展起来的新方法,它基于最优化原理,通过迭代实现图像的重建,具有鲁棒性好、实时重建和在有限视角以及低信噪比情况下减少伪影等优点。为了对光声重建结果进行评估,文中引入均方误差(MSE)和结构相似度(SSIM)两个指标来衡量原始图像和重建图像的相似度。

      (1) MSE

      MSE的计算公式为:

      式中:$I\left( {i,j} \right)$$I'\left( {i,j} \right)$分别为参考标准值和重建结果;mn分别为图像的宽度和高度。MSE的值越小,说明重建后的图像和参考图像越接近。

      (2) SSIM

      SSIM是一种全参考的图像质量评价指标,在对比图像轮廓、细节等相似度方面具有一定参考价值。SSIM的计算公式为[38]

      式中:xy分别为参考标准图像和重建反演图像;${\mu _y}$${\sigma _x}$分别为二者图像的均值;${\sigma _y}$${\sigma _{xy}}$分别为两幅图像的方差;${c_1} = {\left( {{k_1}L} \right)^2}$表示两幅图像的协方差;${c_2} = {\left( {{k_2}L} \right)^2}$$ c_{2}=\left(k_{2} L\right)^{2} $是用来维持稳定的常数,L是像素值的动态范围,k1=0.01,k2=0.03。通常,SSIM的值越接近1,表示图像相似度越高。

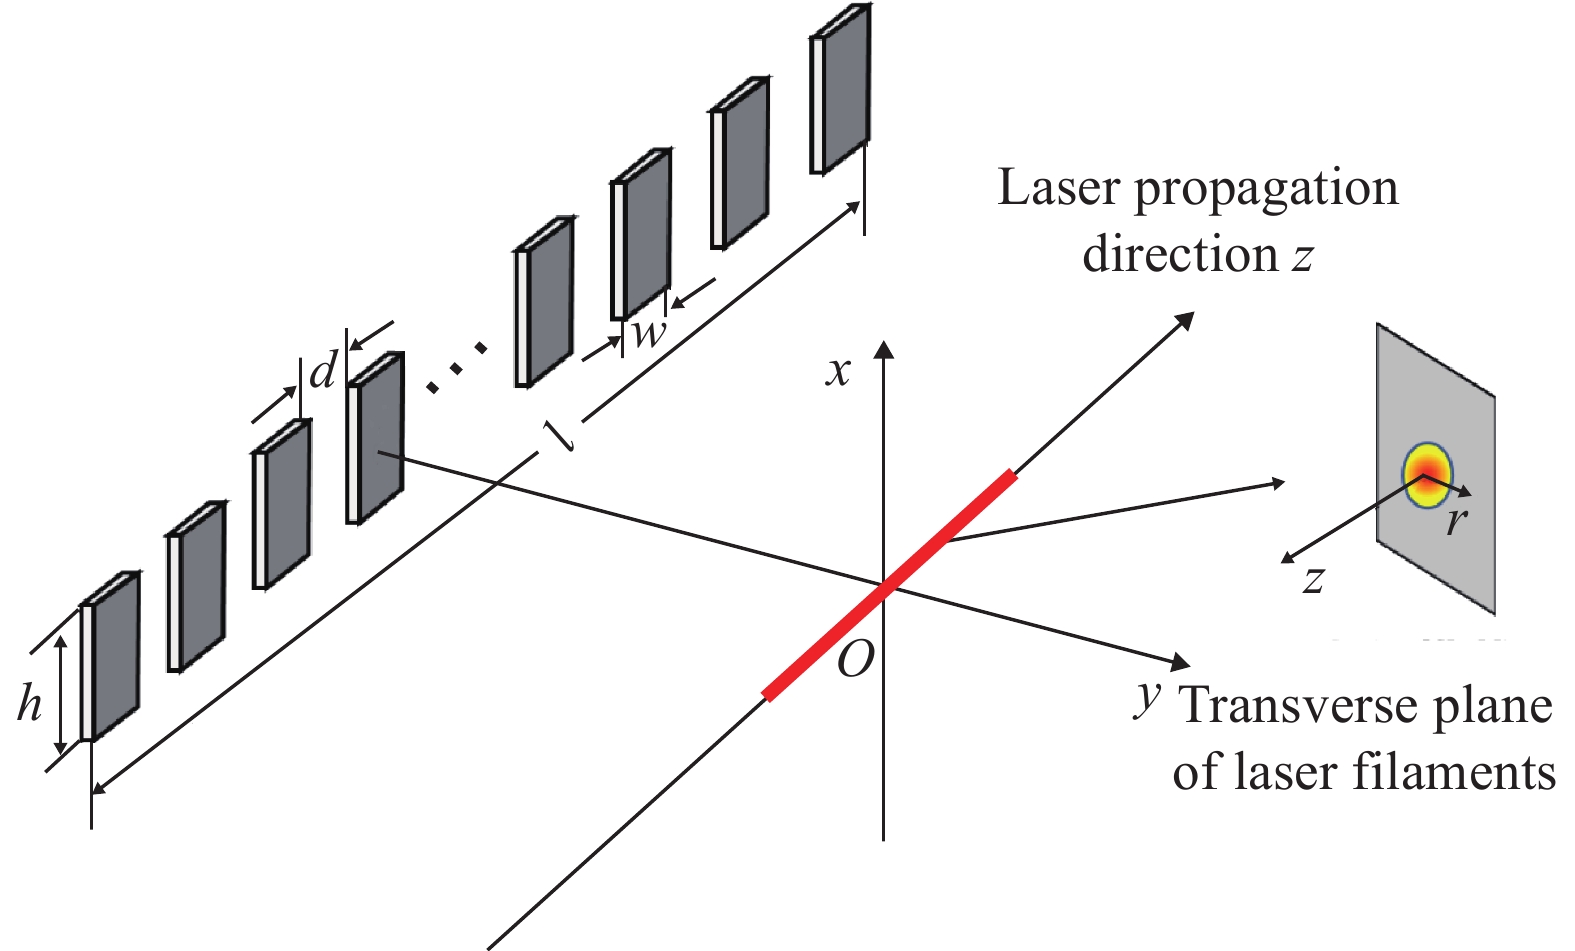
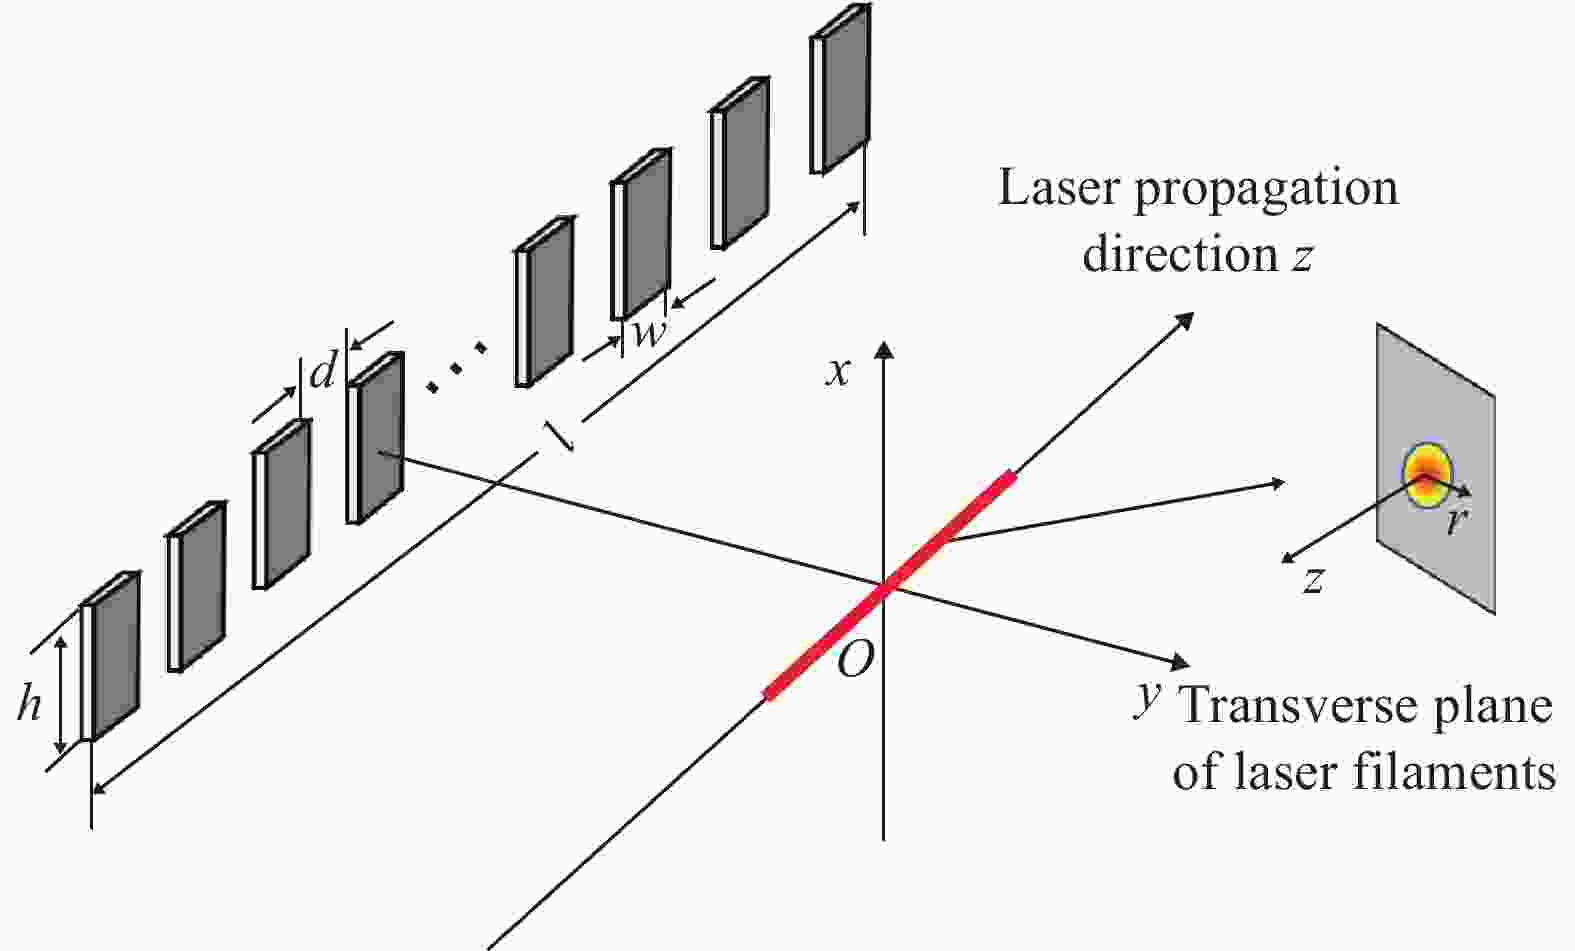
    • 假设空气介质中超声信号传播速度为c0=330 m/s,空气质量密度ρ0=1.27 kg/m3。线性扫描探测器阵列的阵元个数为128,与光丝传输轴z的相对位置如图1所示。单个探测阵元高h=4 mm,宽w=200 μm,探测阵元之间间距为d=200 μm。探测阵列与光丝热源中心距离为D

      Figure 1.  Positional relationship between the linear array detector and the femtosecond filament

    • 为了简化问题,假设光丝诱导形成的轴向热源分布满足如下形式的高斯分布:

      式中:H0=30 kJ/m3表示单位体积内沉积的最大脉冲能量;${r_c}$${{{z}}_c}$分别为高斯中心位置坐标;${w_1} = 150/\left( {2\sqrt {\ln 2} } \right)$ μm;${w_2} = 8/\left( {2\sqrt {\ln 2} } \right)$ mm。光声层析的前向问题则是根据初始热源分布得到压力信号的时空分布$p\left( {\vec r,t} \right)$。取${r_c} = 0$${{\textit{z}}_c} = 0$,高斯热源与换能器阵列表面的垂直距离为D=3 mm,将公式(7)代入超声传播模型公式(1)~(3)中,计算得到声场的时空分布。

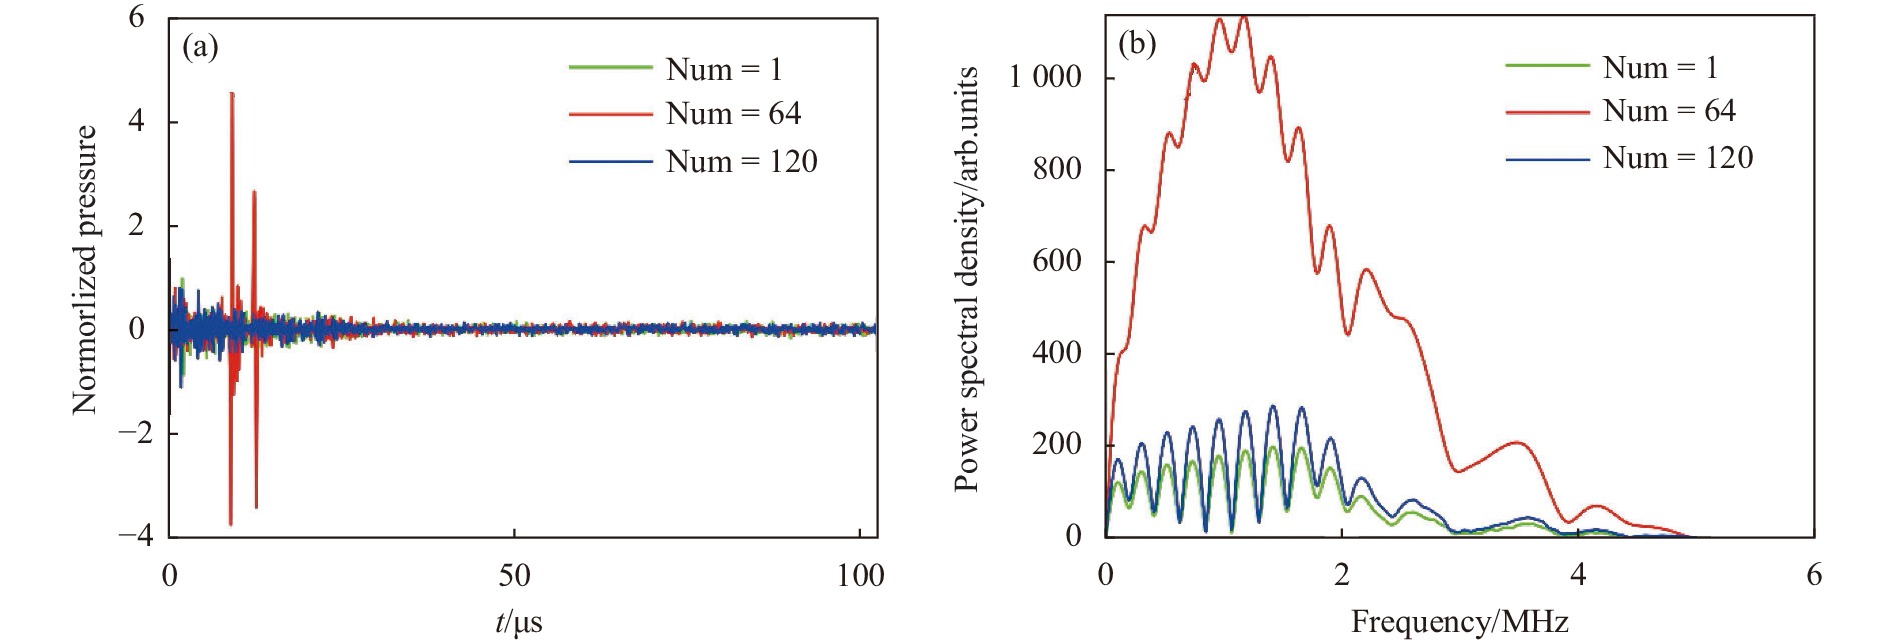
      图2所示分别为第1个换能器(Num=1)、第64个换能器(Num=64)和第120个换能器(Num=120)接收到的光声压信号变化。从图2(a)所示的时域波形变化结果可见,第64个换能器接收到的声信号峰值最大,信噪比更好,这主要是由于在该位置最为靠近光丝声源,同一时间内接收的超声信号更强。图2(b)为声信号的频谱分布,它表示对图2(a)所示的光声压信号进行傅里叶变换得到的幅值谱。为了便于比较,将第1个换能器(Num=1)和第120个换能器(Num=120)频谱信号放大了100倍。从图中可见,光丝诱导形成的超声信号频段峰值主要集中在1 MHz附近。在距离3 mm位置处,换能器接收到的光丝诱导超声信号的最大频率在5 MHz左右。当探测器的带宽范围与光声压频谱范围基本吻合时,这样损失的频率成分较少,成像效果比较好。因此,文中选用的探测器中心频率为6 MHz,采集卡采样频率设置为10 MHz。

      Figure 2.  Photoacoustic pressure signals induced by single filament received by transducers at different positions. (a) Time domain waveform; (b) Frequency spectrum

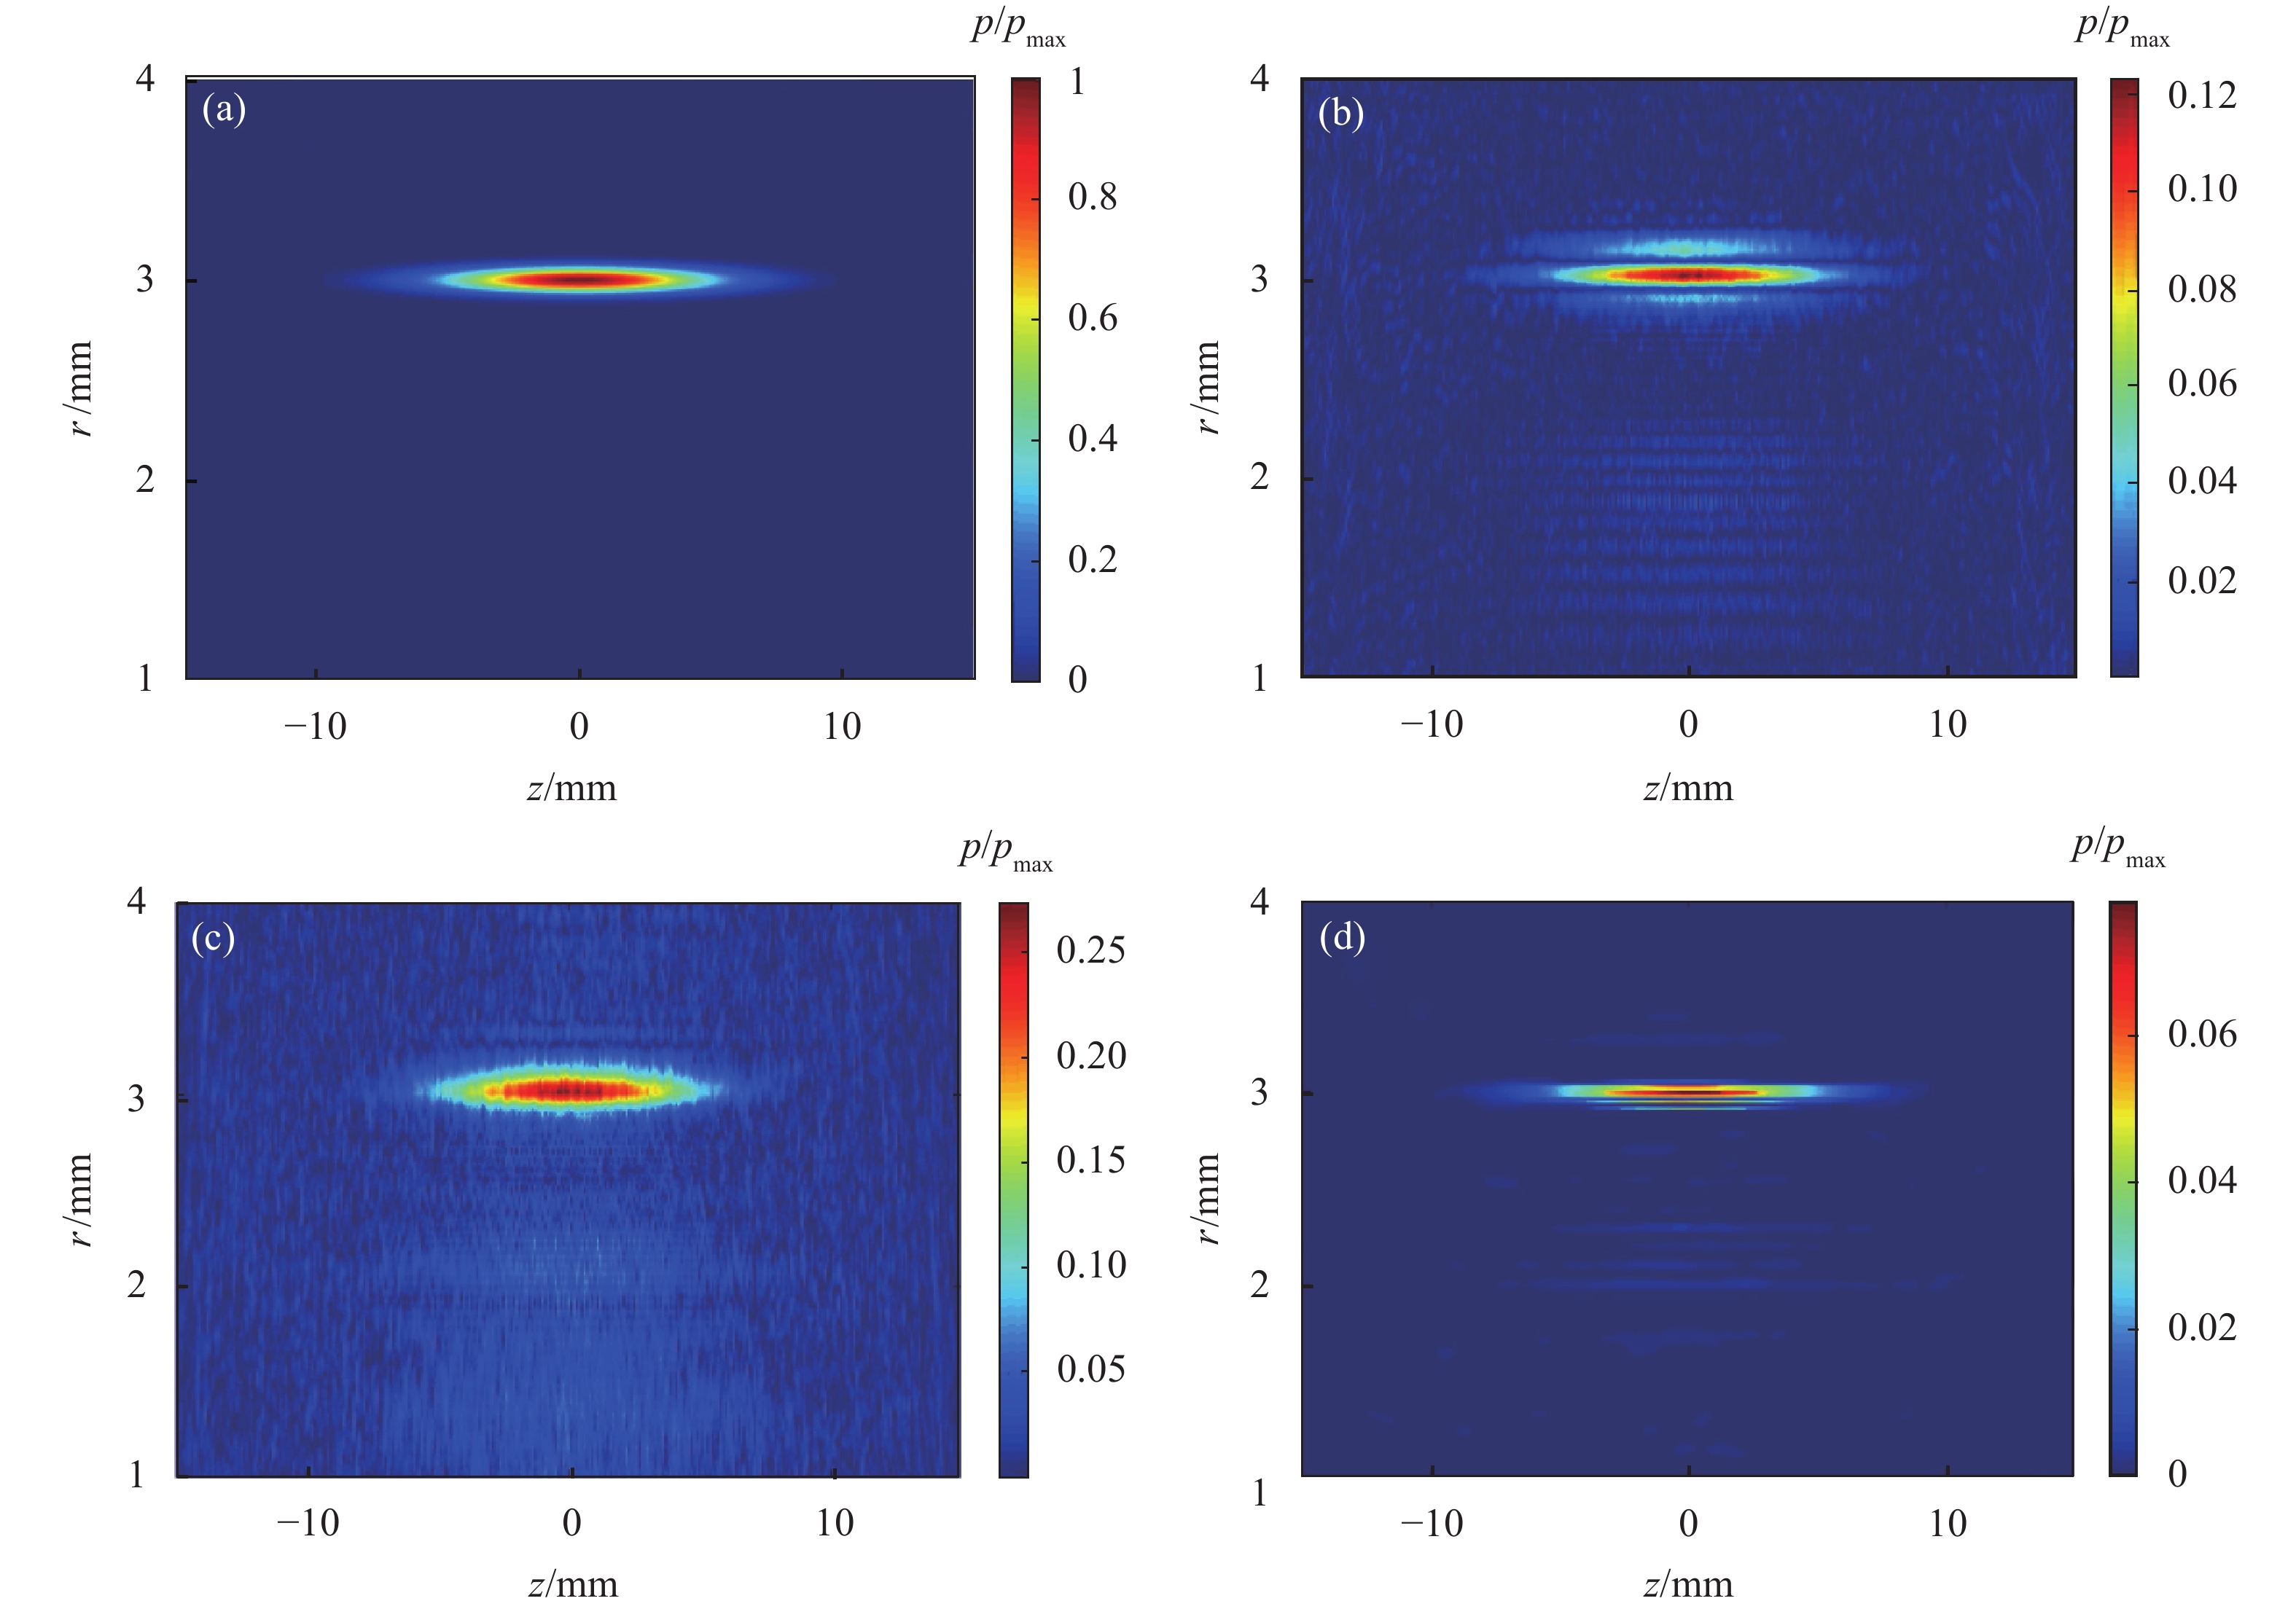
      图3所示为单丝图像重建结果,其中图3(a)为原始图像,对图像进行了归一化处理。图3(b)所示为采用UBP算法对线性换能器阵列采样结果进行图像重建的结果,图3(c)所示为采用DAS算法重建的结果,图3(d)所示为采用SPANNER算法重建的结果。对比原始图像和重建图像可见,光声层析重建的图像基本上能够较为准确地再现光丝的位置,而且光丝的轮廓依然保持高斯形状,说明该方法在重建光丝结构上的可行性。对比反演重建图像与原始图像,图3(b)图3(a)相比,二者的MSE为303.22,SSIM为0.69;图3(c)图3(a)相比,二者的MSE为350.01,SSIM为0.65;图3(d)图3(a)相比,二者的MSE为216.79,SSIM为0.96。不同算法重建的效果差异较大,UBP重建结果在径向上出现了明显的伪影,这是由于该算法反投影是沿着圆弧进行,圆弧的中心是测量点位置,会使原像上像素值为零的点在重建图像上的像素值不为零,从而产生伪迹阴影;DAS反演的光丝直径要略大于实际光丝直径,这是由于“有限孔径效应”的存在,使得检测到的信号中出现时间拖尾,之后在重建图像中转化为空间拖尾,从而导致了图像横向分辨率将被拉长,光丝的横向直径变大;SPANNER算法重建的图像与原始图像的相似度高达0.96,重建效果最好。这是由于该算法在实施过程中,使用最优理论来改进非线性共轭梯度算子的计算,这可以提高迭代算法的有效性,实现非负性和各向异性总变分正则化,从而对噪声和物理精确图像具有鲁棒性,有效避免噪声干扰。但是,从图中也可以看出,SPANNER算法重建出的光丝,其中间核心部分周围的能量背景池,并没有很好地显示出来。从反演声压的峰值大小来看,DAS算法的重建结果要更接近于原始结果。

      Figure 3.  Reconstructed photoacoustic axial images of single filament. (a) Original image; (b) Reconstruction result of UBP algorithm; (c) Reconstruction result of DAS algorithm; (d) Reconstruction result of SPANNER algorithm

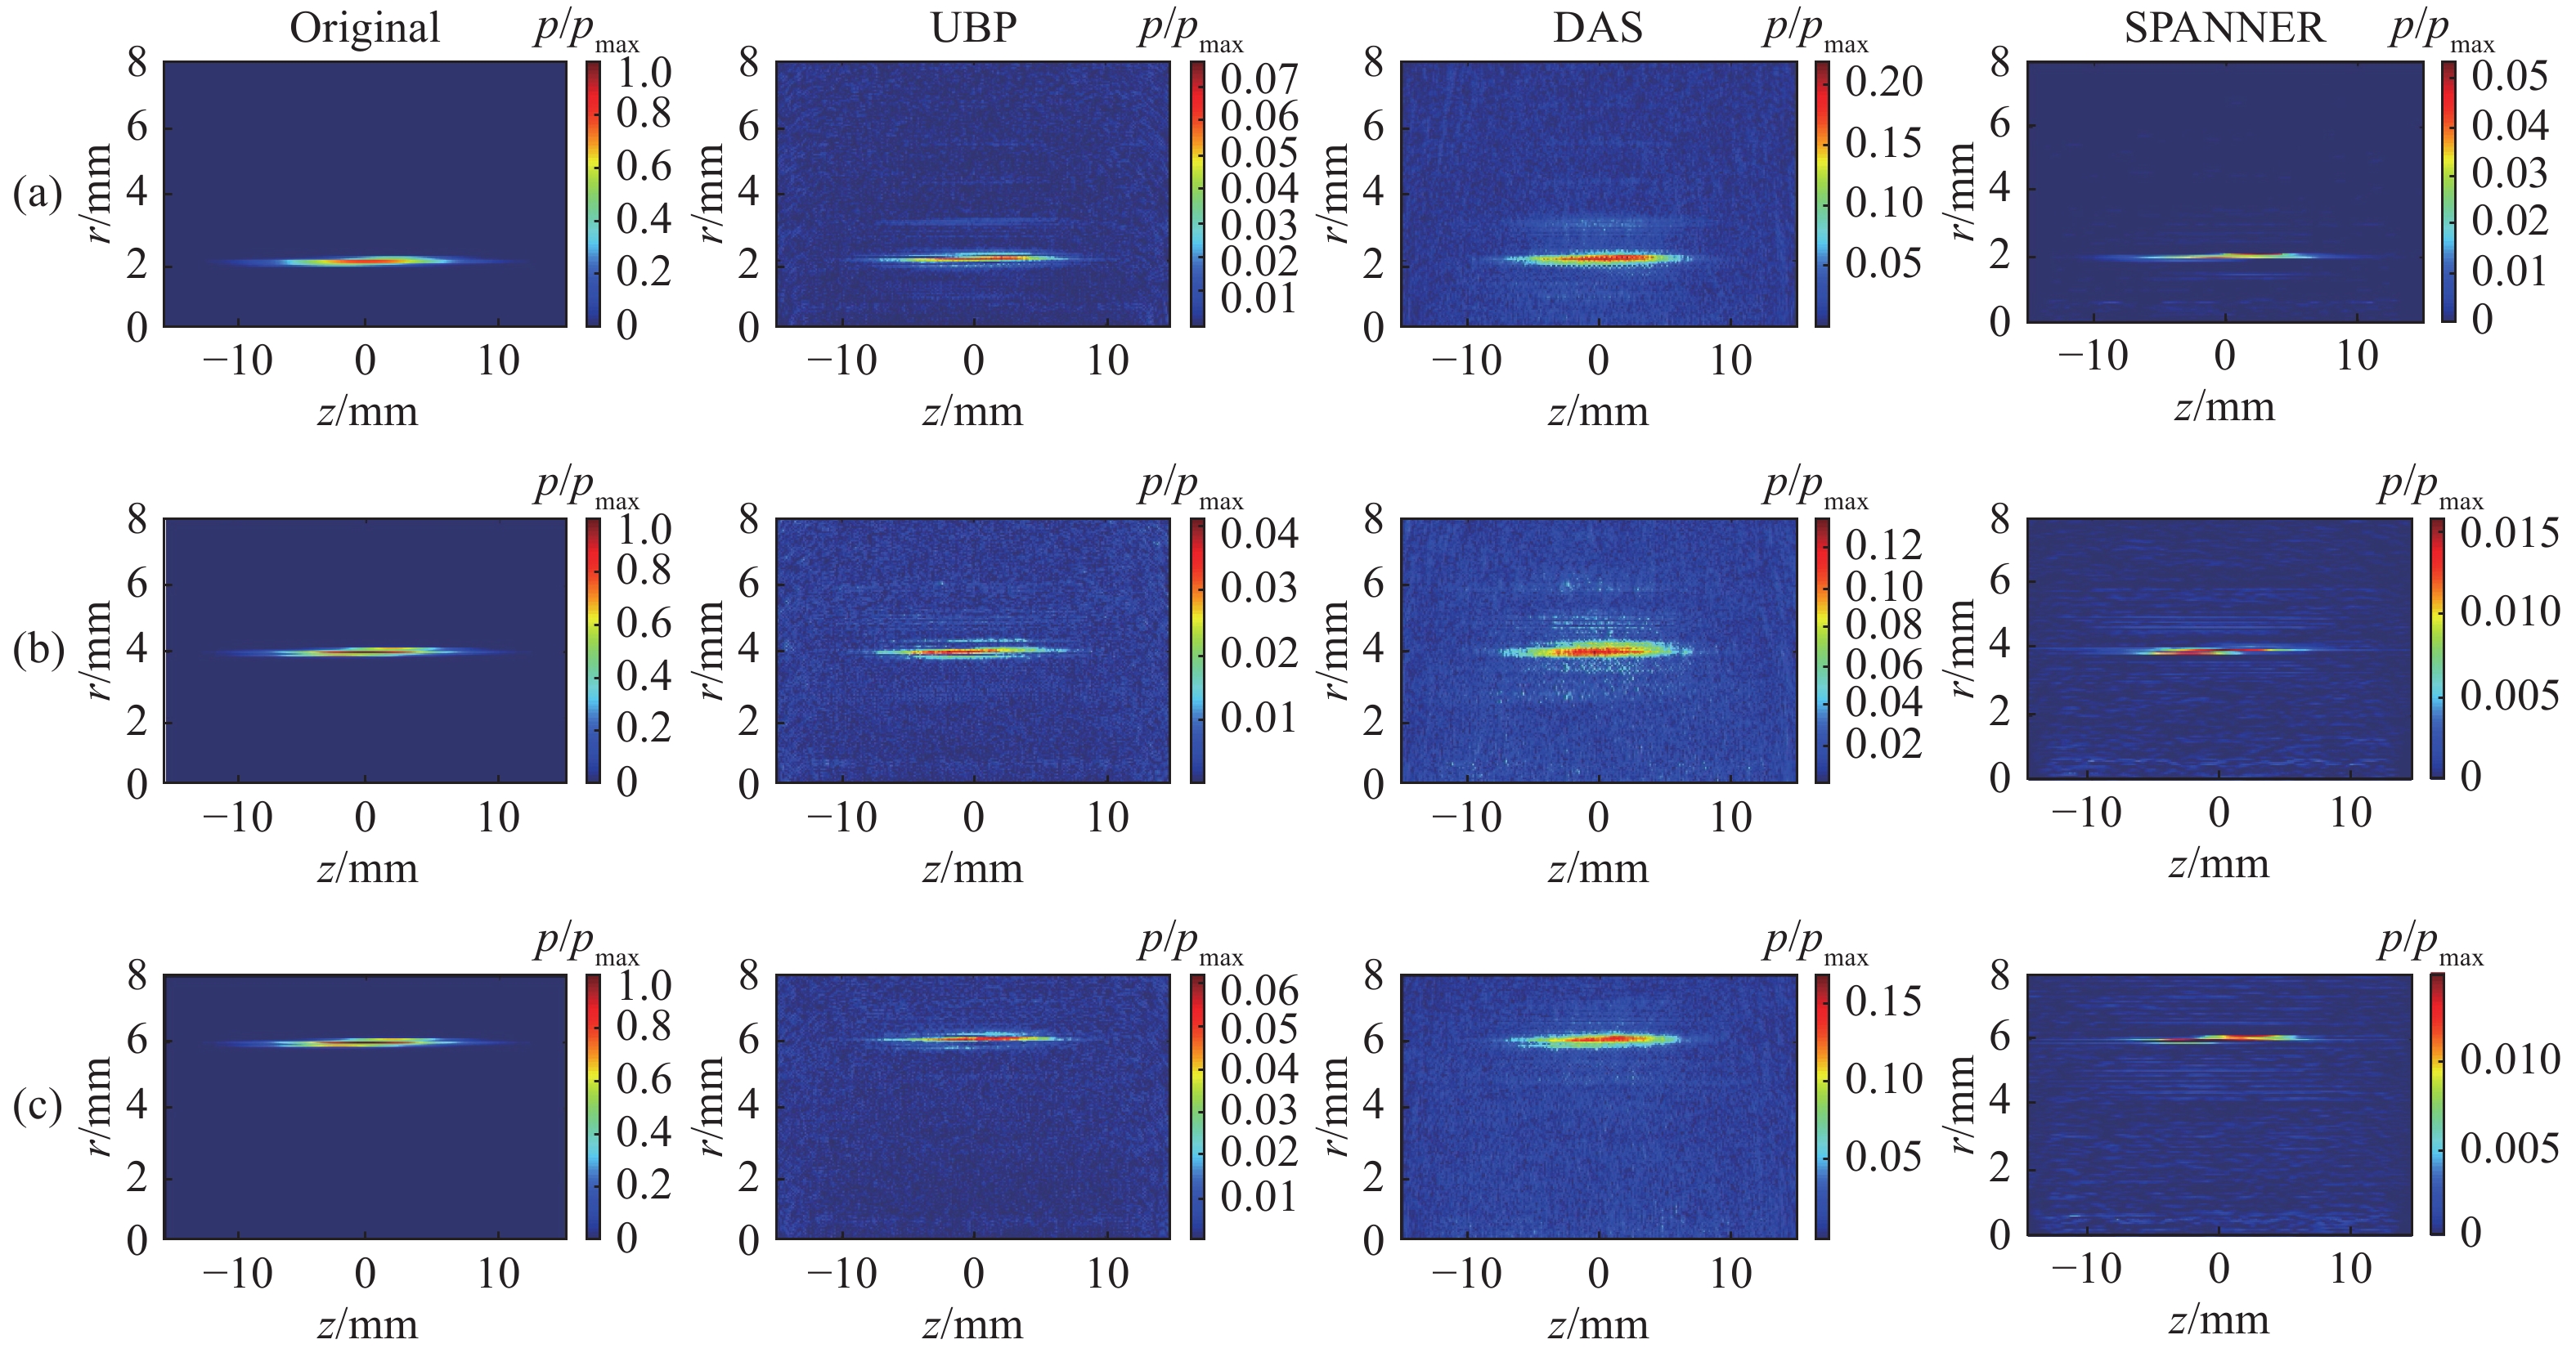
      图4所示为改变线性探测器与光丝中心之间距离D后,得到的光丝重建图像。从图中可见,在不同距离处放置换能器阵列进行测量,均能利用光声层析法较为准确地再现光丝的位置,而且光丝的轮廓依然保持高斯形状。不同图像重建算法在不同距离重建的结果效果存在差异。在不同距离探测,UBP和DAS重建的图像均存在明显的伪影。随着探测距离的增大,SPANNER算法重建的效果越来越接近实际光丝图像。这说明,通过调节探测距离,SPANNER算法能够较好地实现单丝图像的重建。

      Figure 4.  Effect of different detection distances D on single filament reconstruction results. (a) D= 2 mm; (b) D= 4 mm; (c) D= 6 mm

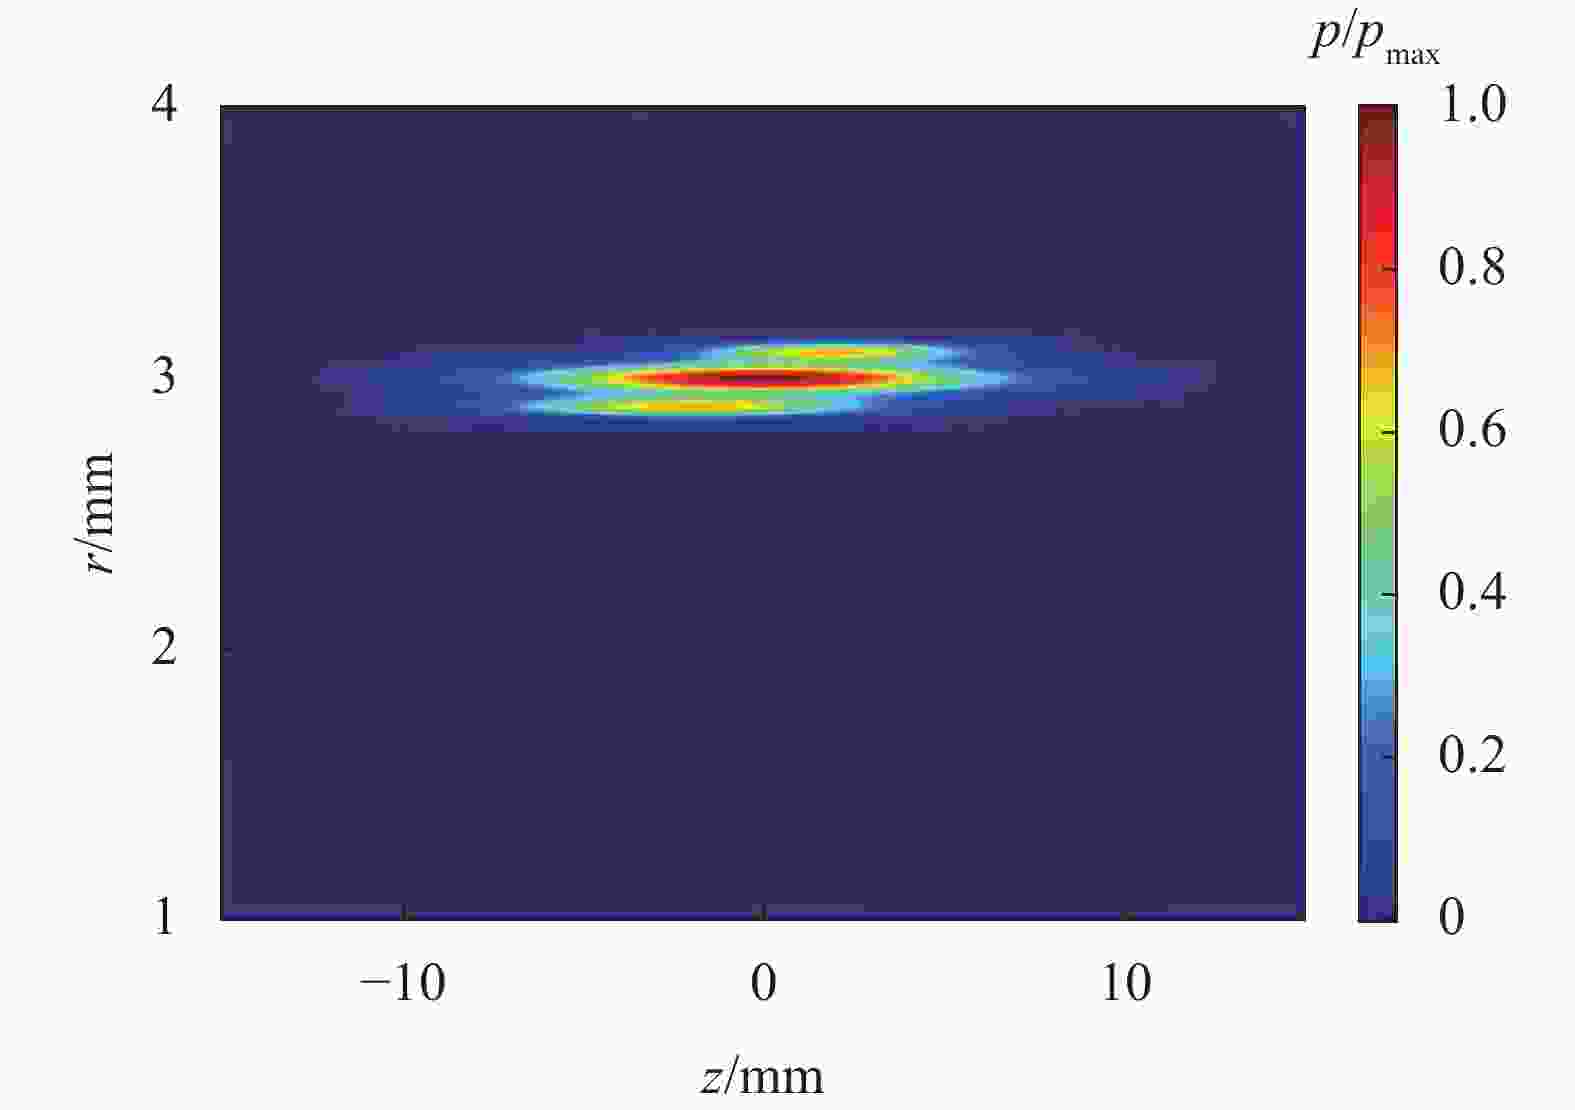
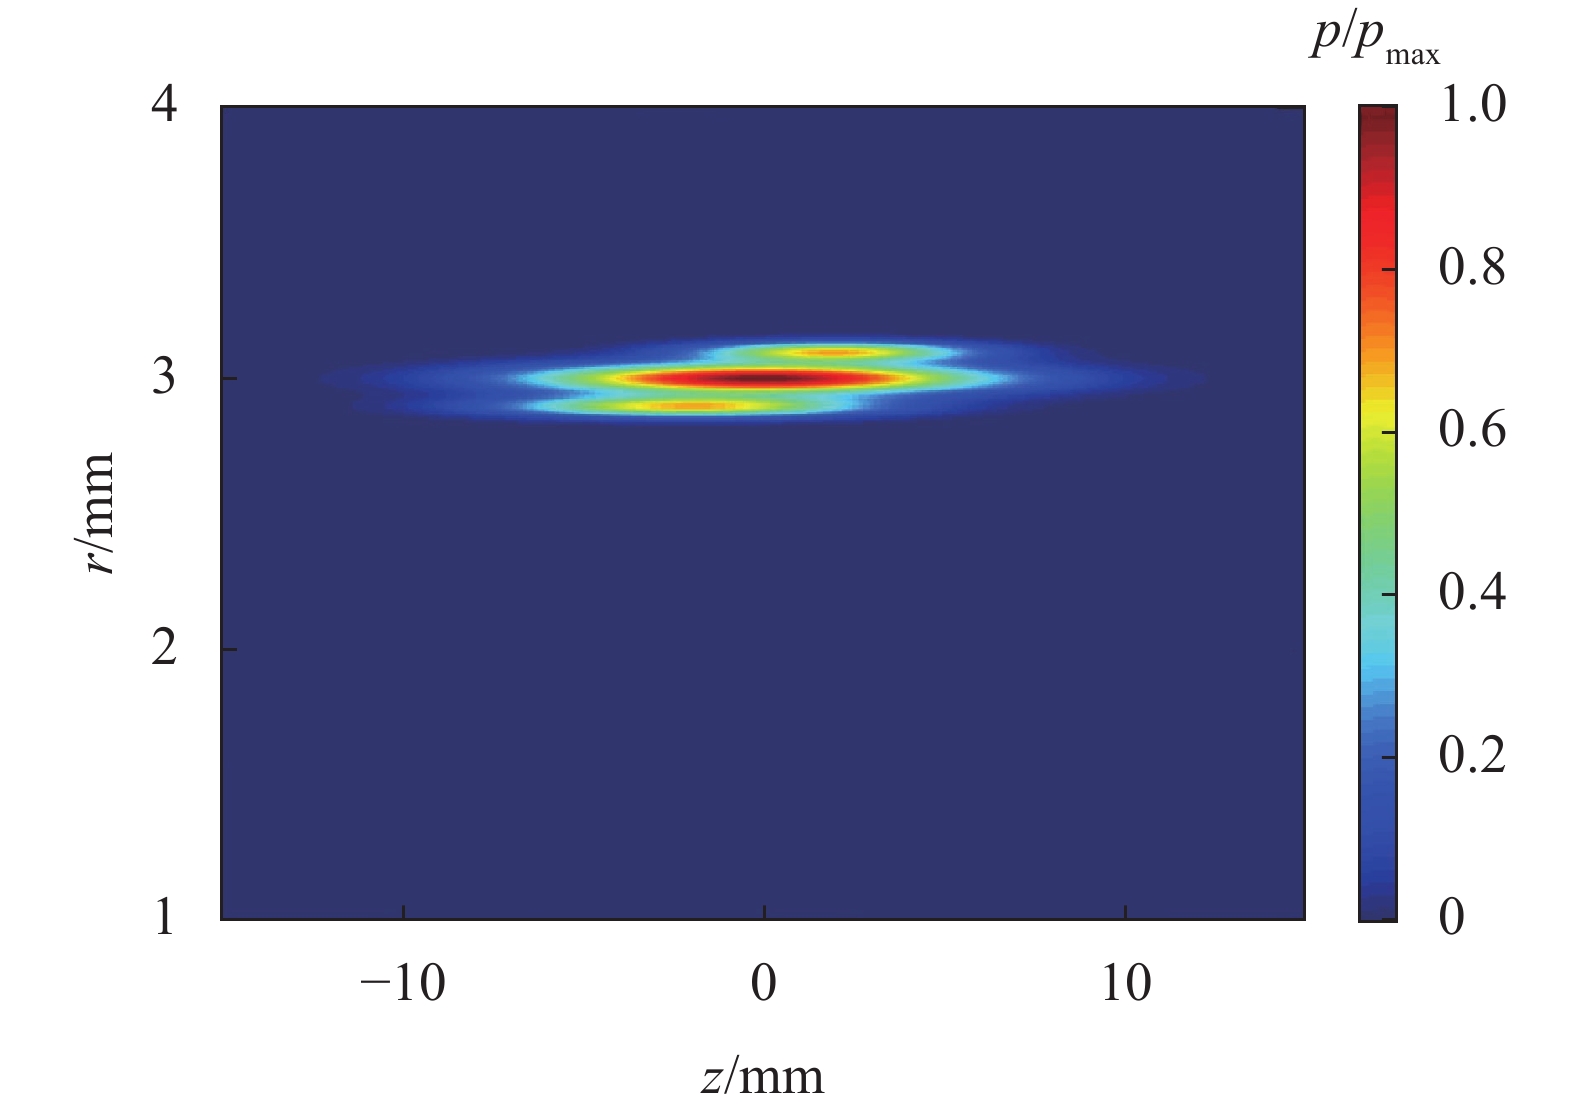
    • 为了实现对多丝图像的重建,构建如图5所示的多丝排列分布图。

      Figure 5.  Distribution of original multi-filament arrangement

      假设每根光丝均满足公式(7)形式。其中,中间主光丝参数为:H0=30 kJ/m3${w_1} = 90/\left( {2\sqrt {\ln 2} } \right)$ μm,${w_2} = 10/ \ \left( {2\sqrt {\ln 2} } \right)$ mm;上侧的副光丝参数为:H0=20 kJ/m3${w_1} = 60/\left( {2\sqrt {\ln 2} } \right)$ μm,${w_2} = 6/\left( {2\sqrt {\ln 2} } \right)$ mm;下侧的副光丝参数为:H0=20 kJ/m3${w_1} = 60/\left( {2\sqrt {\ln 2} } \right)$ μm,${w_2} = 8/ \left( {2\sqrt {\ln 2} } \right)$ mm。主光丝与副光丝中心之间距离都是100 μm。

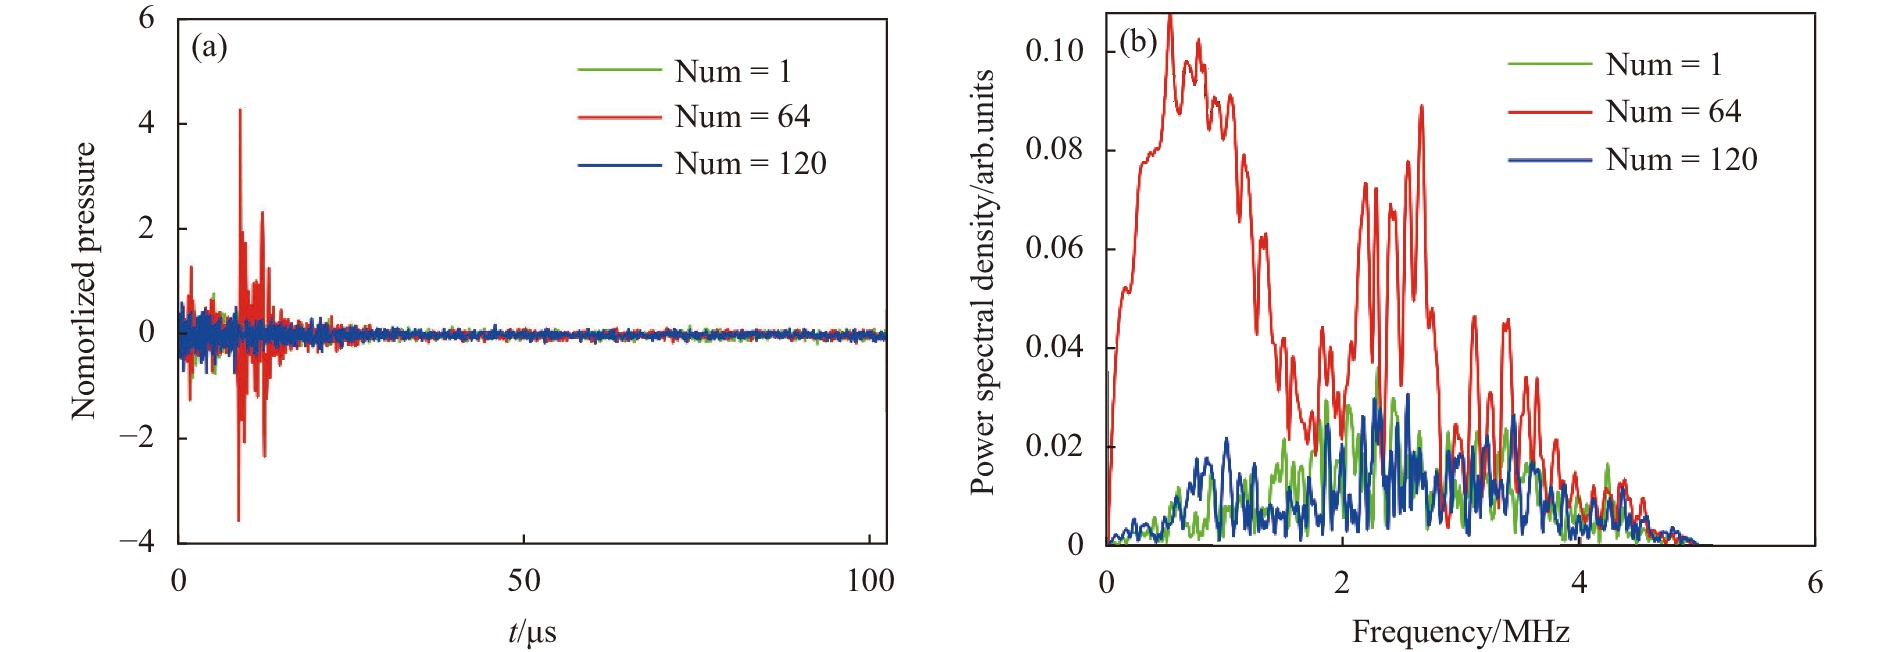
      图6所示分别为第1个换能器(Num=1)、第64个换能器(Num=64)和第120个换能器(Num=120)接收到的声信号变化。从图6(a)时域波形变化可见,对于多丝情况,中间换能器接收到的声信号峰值也最大,信噪比更好。从图6(b)所示的声信号频谱分布来看,第64个换能器(Num=64)接收到的声信号存在两处明显的频率峰值区,其他两处位置换能器以单峰为主。总的来看,在距离3 mm位置处,换能器接收到的多丝诱导超声信号的最大频率也在5 MHz左右。
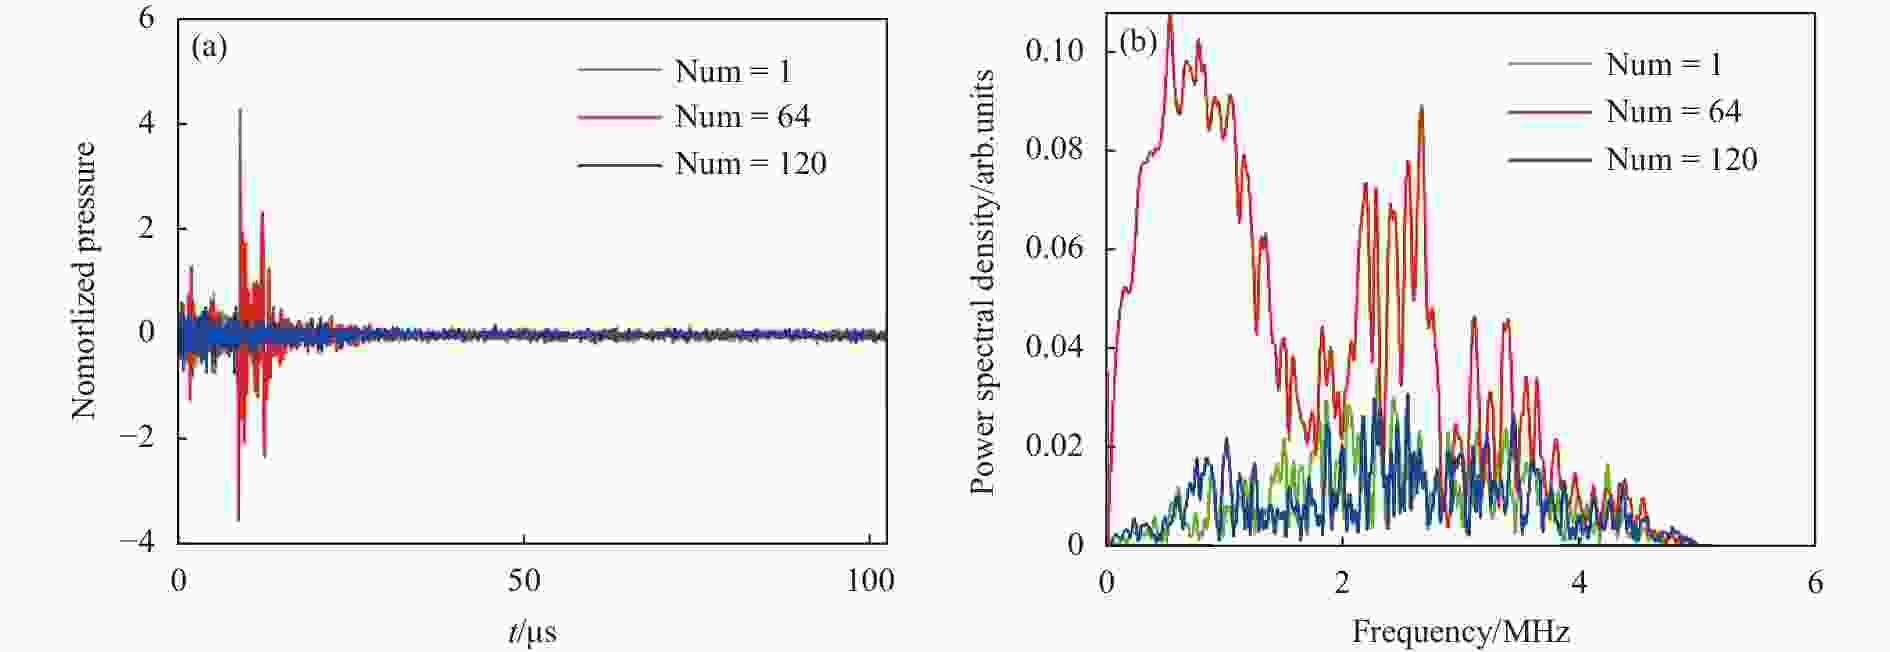
      Figure 6.  Photoacoustic pressure signals induced by multi-filament received by transducers at different positions. (a) Time domain waveform; (b) Frequency spectrum

      图7所示为多丝图像重建结果,其中图7(a)表示采用UBP算法进行图像重建的结果,图7(b)表示采用DAS算法进行图像重建的结果,图7(c)表示采用SPANNER算法进行图像重建的结果。对比原始图像(图5)和重建图像可见,光声层析能够较好地重建主丝的侧向图像。UBP算法和DAS算法对于多丝副丝的图像重建效果较差,尤其是下侧的副丝基本没有重建出来。相对而言,SPANNER算法可以较为清楚地重建出上下两侧副光丝的图像。对比反演重建图像与原始图像的差异,图7(a)图5相比,二者的MSE为379.17,SSIM为0.67;图7(b)图5相比,二者的MSE为455.80,SSIM为0.65。图7(c)图5相比,二者的MSE为297.39,SSIM为0.94。前两种算法重建结果的SSIM比较接近,SPANNER算法重建的图像与原始图像SSIM最高。

      Figure 7.  Reconstructed photoacoustic axial images of multiple filament. (a) Reconstructed results of UBP algorithm; (b) Reconstructed results of DAS algorithm; (c) Reconstructed results of SPANNER algorithm

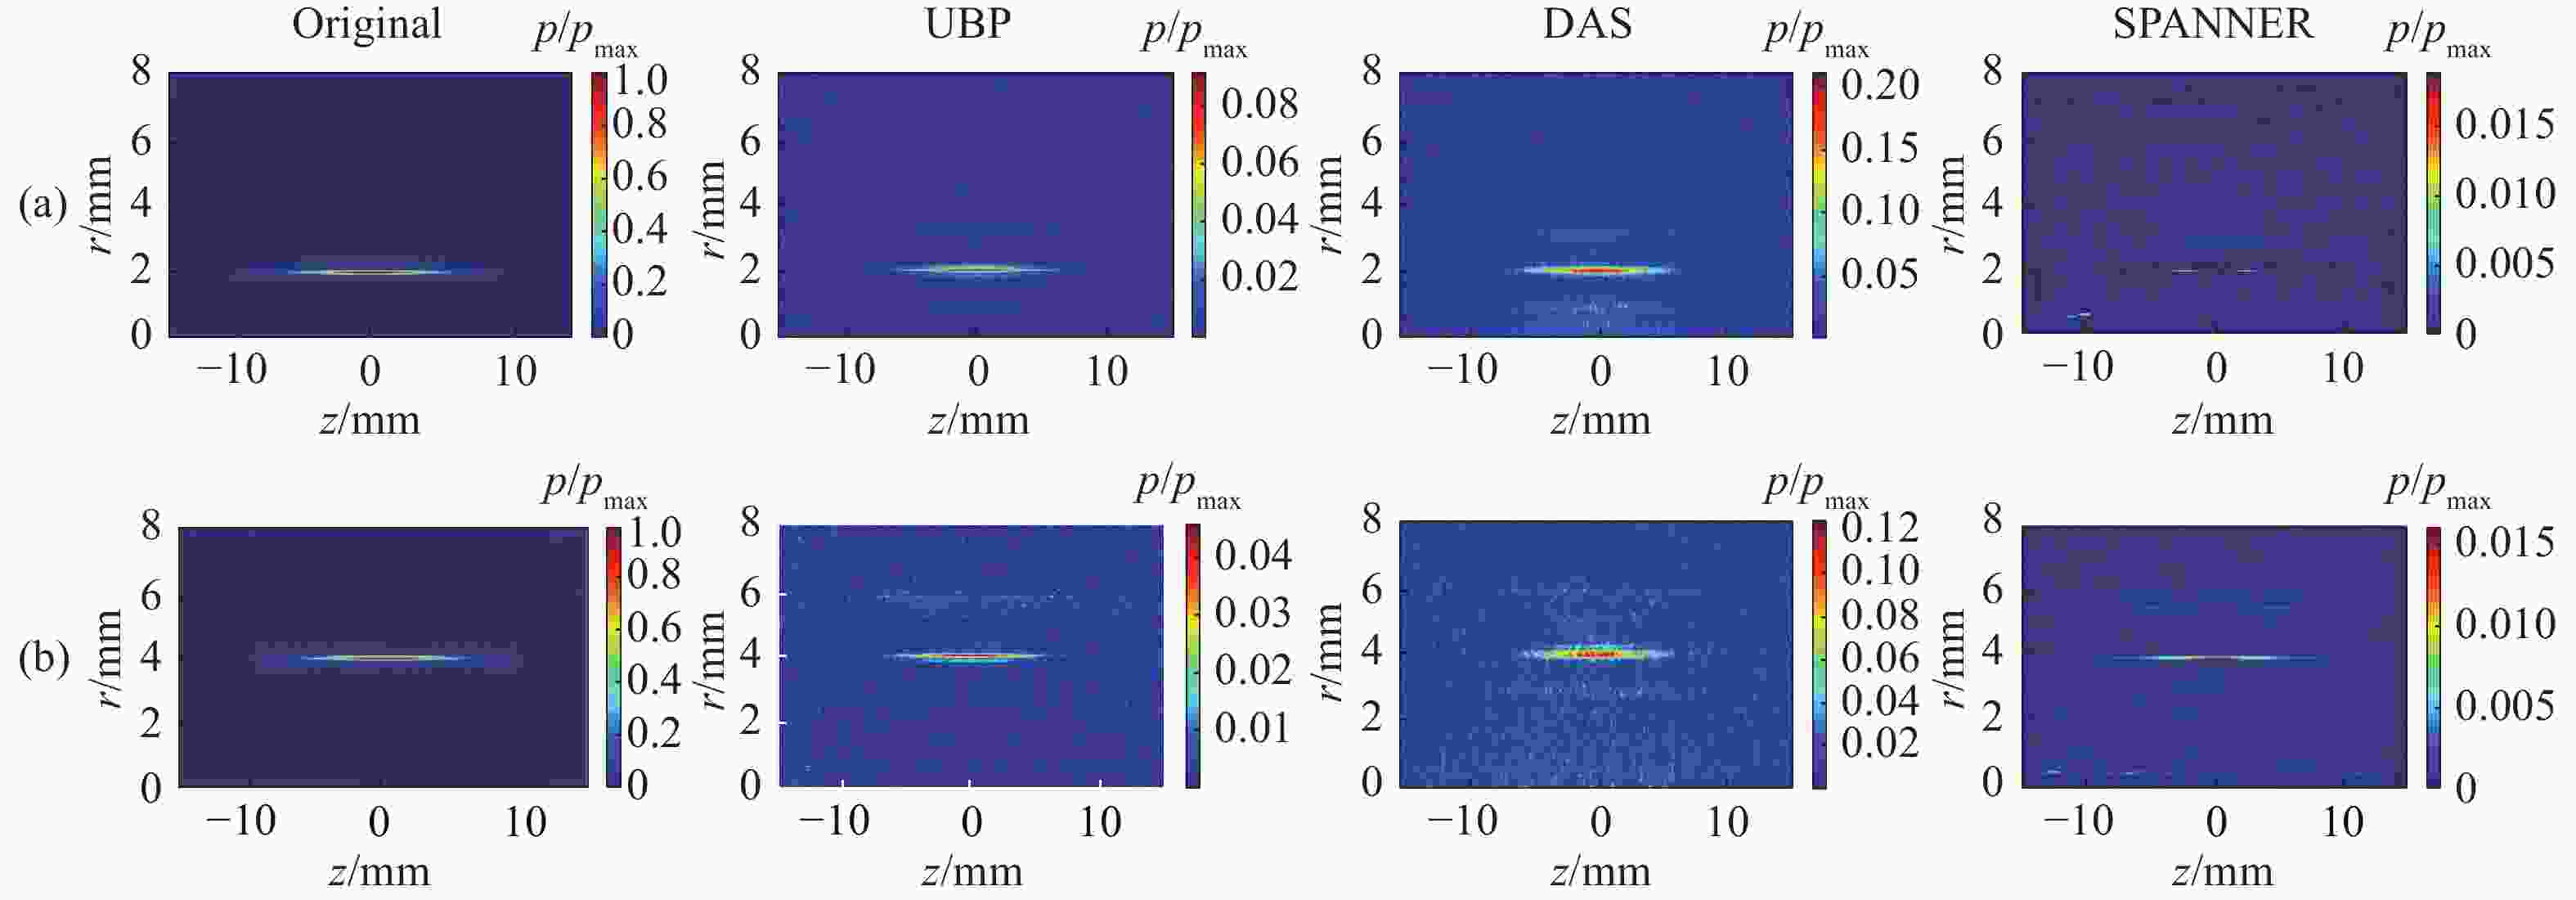
      图8所示为改变线性探测器与主丝中心之间距离D后,使用不同的重建算法得到的多丝结构图。从图中可见,在不同距离处放置换能器阵列进行探测,光声层析法能够较好地重建主丝的侧向图像,但是副丝轮廓较为模糊。相对而言,基于最优化理论建立的SPANNER算法能够较好地重建出副光丝的图像,因此该方法适用于对多丝图像的重建。

      Figure 8.  Effect of different detection distances D on reconstruction results of multi-filament. (a) D= 2 mm; (b) D= 4 mm; (c) D= 6 mm

    • 为了研究飞秒激光成丝的空间结构特征,文中理论研究了利用多元线性阵列探测器实现对飞秒激光轴向截面图像进行光声重建的可行性。基于轴对称坐标系中的全波模型,理论模拟了单丝和多丝诱导形成超声信号的正向传播过程,发现在两种情况下,在距离光丝中心3 mm位置处,形成的超声信号最大频率约为5 MHz。根据多元线性阵列探测器获得的声信号,利用通用UBP、DAS和SPANNER等图像重建算法对单丝和多丝轴向图像进行了重建,结果发现三种图像重建算法均能够较为准确地实现对单丝位置、r-z截面轮廓等信息的反演。但是,UBP结果在径向上出现了明显的伪影,DAS反演的光丝直径要略大于原始光丝直径大小,SPANNER算法重建的图像与原始图像的相似度高达0.96,重建效果最好。对于多丝情况,UBP和DAS能较好地再现主丝的轮廓,但是对于主丝周围副丝的重建效果并不理想。基于最优化理论建立的SPANNER算法,能够较好地重建出副光丝的图像。综合来看,SPANNER算法更适用于对飞秒光丝图像的重建。后续将通过进一步实验测量来验证光声层析法重建光丝空间结构的可行性。

Reference (38)

Catalog

    /

    DownLoad:  Full-Size Img  PowerPoint
    Return
    Return