


-
深孔类零件在机械结构中应用广泛,如各种类型的管道、枪炮管、泵体管道等[1]。在很多领域中,管体内壁面型结构、损伤程度等对结构体应用效果具有很大影响,故对深孔结构内壁的检测成为了一项研究热点[2]。针对深孔内壁几何尺寸、表面状态等的检测值成为了深孔加工结果的重要评价指标。
目前,常见的深孔内壁检测方法包括:接触点测法、涡流法、超声成像法、激光扫描法等。接触法精度高,可实现高精度空间点位置分析,但需要接触测量检测容易造成结构损伤,同时,接触法在深孔孔径较小时无法测量[3];涡流法可以实现快速非接触测量,但对深孔深度大的结构体而言,其精度低,易受干扰,且该种方法仅适用于电导体[4];超声成像法可以获取较完整的面型分布信息,但是其精度较低[5]。激光扫描法精度高且可获取三维面型分布数据,但传统方法速度慢,并且对于深度大且孔径小的深孔无法探测[6-7]。
综上所述,在非接触测量与保证高精度的前提下,对激光扫描的测量方法进行改进是较为理想的设计意思。故国内外很多研究团队将激光扫描、结构光检测、多图像拼接等技术应用于深孔内壁测试,Yokota等[8]人利用全息技术获取了深孔零件的内壁信息,速度快、精度高,但对测试结构内壁的平滑程度有一定要求,即主要适用于较为具有较高反光性能的内壁结构,测试精度可达0.0387 mm,但由于全息技术对光学条件的比较苛刻,只能适用于精密表面结构。Almaraz等[9]人通过条纹投影技术获取不同相位的数据,再通过数据融合实现对孔径内壁的三维重构,相比点扫描式系统其测试速度大幅提升,绝对误差为0.78 mm,但由于其系统结构较大只能应用于大孔径深孔结构。王颖[10]等人通过机器视觉设计了多角度图像融合算法,实现了圆柱结构管道内壁面型结构测量。丁超[11]等人采用线激光器配合CCD获得了深孔凹槽结构的三维信息,合理的角度分布得到了更高的测量精度。张振友[12]等人采用数字式图像分析系统完成了高炮炮管内壁裂纹的定量分析。
在此基础上,文中设计了一种可深入深孔内部的激光扫描结构,并提出采用谐波计算的方式抑制信号混叠。该系统通过线扫描提高检测速度,通过谐波计算降低内壁干扰,并且由于其探测结构的伸缩性,可以适用于深度大、孔径小的深孔结构。
-
由于系统需要应用于深孔结构探测,所以传统的激光扫描无法照射,该系统硬件上采用单振镜与45°反射镜联用的形式实现对深孔内壁加工质量的测量与分析。由于探头段仅固定反射镜,所以其结构可以做的比较小巧,从而适用于小孔径深孔结构。同时,由于反射镜固定,所以近轴条件有限,扫描振镜范围即使偏大也会由于反射镜位置固定,而导致仅有近轴光线可以成像。算法上通过谐波测距的方式抑制混叠信号的干扰。系统总体设计结构如图1所示。
图1中,处理系统通过调制模块控制激光器产生谐波信号,激光经过半透半反振镜入射至深孔内的45°反射镜上,同时,处理模块还通过伺服电机控制振镜扫描,扫描方向与深孔内反射镜的深度方向一致。与振镜配合的反射镜是可以根据深孔深度进行伸缩调节的,为了保证测量精度,另反射镜中心位置经过激光器光轴,所以采用工装台进行固定。激光从光源发射后在反射镜位置发生反射,反射光照射在需要测试的深孔内壁位置上,内壁上的反射光会延反射镜照射到振镜上,由于振镜右侧有反射镀膜,所以会将反射信号照射在柱面镜上,最终成像于CCD。CCD1和CCD2分别通过柱面镜完成对近轴位置光信号的汇聚,从而得到能量集中的内壁表面反射信号。CCD通过采集模块将数据发送给处理模块,同时,经解调模块计算回波的距离信息量,从而为消除内壁多次折射的噪声信号提供距离信息分量。最终,处理系统根据三维重建算法完成对深孔内壁三维面型的分析。
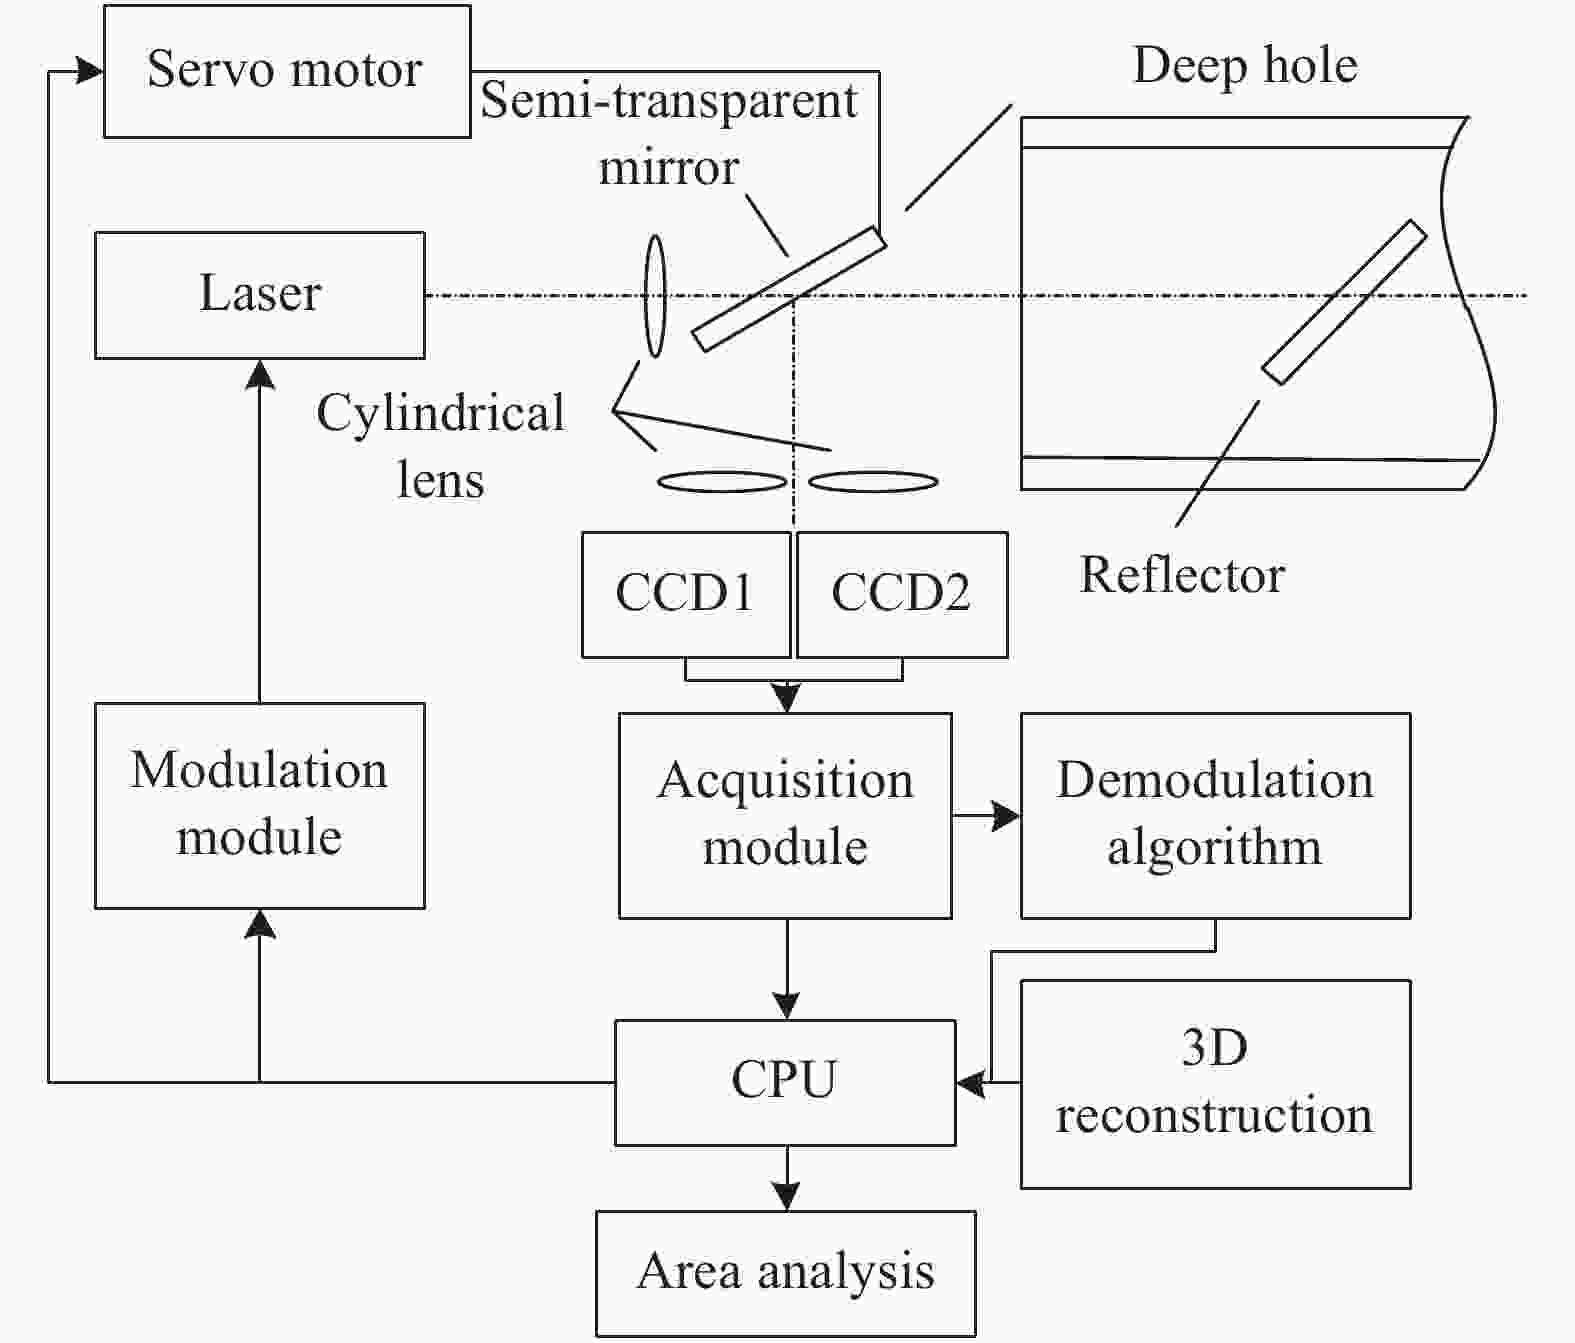
Figure 1. Three-dimensional surface profile detection system for the inner wall of a deep hole
-
激光照射到深孔内壁后[13],由于内壁不是平面,所以反射光变成了受内壁曲率及反射率影响的漫反射光,但可以看出,只有和入射光角度相近的角度范围才能直接通过反射镜反射至振镜,从而被CCD1和CCD2采集得到,而角度超过该阈值时必然会在管内形成多次漫反射,即使能够最终达到振镜面,其达到时间也明显慢于测试位置的光信号,所以采用谐波调制的方式可以通过回波信号相位信息将不再时间窗函数中的数据剔除,从而提升检测信噪比。
设CCD1的坐标系O1(x1, y1, z1),CCD2的坐标系O2(x2, y2, z2),与之对应的像面可表示为OL1(xL1, yL1)和OL2(xL2, yL2)。则深孔内壁上测试区域中任意点P(xP, yP, zP)可以通过两个CCD的测试数据进行联合求解。
式中:R为两个CCD的旋转矩阵;T为两个CCD的平移矩阵。在R和T中,参数r11~r33和t1、t2、t3是根据两个CCD的预设位置和两个CCD空间坐标系的关系计算得到的。由此可见,将CCD1中的数据统一到CCD2中后,就能将目标位置的点数据进行解算。对于待测点P而言,对于CCD1可表示为:
CCD2可表示为:
式中:c1和c2表示坐标转换系数。
将公式(2)代入公式(3)和公式(4)可以得到P点的坐标表达式为:
其中,c1和c2表示坐标转换系数,k1和k2为解算系数,则:
由于测试深孔内壁前,系统可以通过标定获取旋转矩阵和平移矩阵的参数值,故P点的坐标值变成通过两组已知测量量求解一组未知量的计算。
-
采用柱面镜获取线激光,从而对深孔内壁进行线扫描可以大幅提升系统采集速度,相比于传统单点采集成像具有更广泛的应用前景[14]。但其面临的问题也是很明显的,深孔不同位置都会对激光束产生漫反射回波,这些激光叠加在一起后难以被分离,从而造成测试点计算误差大和出现虚假点的问题。由此,文中提出了一种谐波匹配的点云优化算法,核心思想是先对光源进行谐波调制,从而使入射激光随相位变化而具有预设的调制强度,故只有在相位差相近的区域其才能与光源的相位值匹配,达到对回波信号滤波的效果。该滤波相当于为测试区域提供了一个关于距离信息的时间窗函数T,该时间窗的最大值Tmin和最下值Tmax分别对应着近轴条件下谐波函数调制范围中的最大值和最下值,即延深孔孔轴方向符合近轴扫描的两个极限位置。该函数可以将符合近轴条件的成像点提取,并根据孔深D、孔径R及CCD间距L完成二维坐标(x, y)到三维目标点(x, y, z)的映射计算。当遍历所有点后就能获取优化后的三维重建图像。
算法实现步骤如下:
(1)根据孔深D和孔径R设置谐波参数T,计算符合线激光扫描近轴条件的区域,并将该区域的像面调整至CCD1和CCD2的感光面位置;
(2)依据近轴光范围计算时间窗阈值Tmin和Tmax,并将其导入数据存储单元;
(3)将所有CCD1和CCD2的测试数据导入数据存储单元;
(4)通过时间阈值窗函数对所有数据点进行判断,剔除不符合时间窗的数据点,将符合的数据点重新整理形成有效二维数据集合;
(5)采用三维重建算法完成(x, y)~(x, y, z)的解算,实现三维目标成像。
整体过程的程序流程如图2所示。
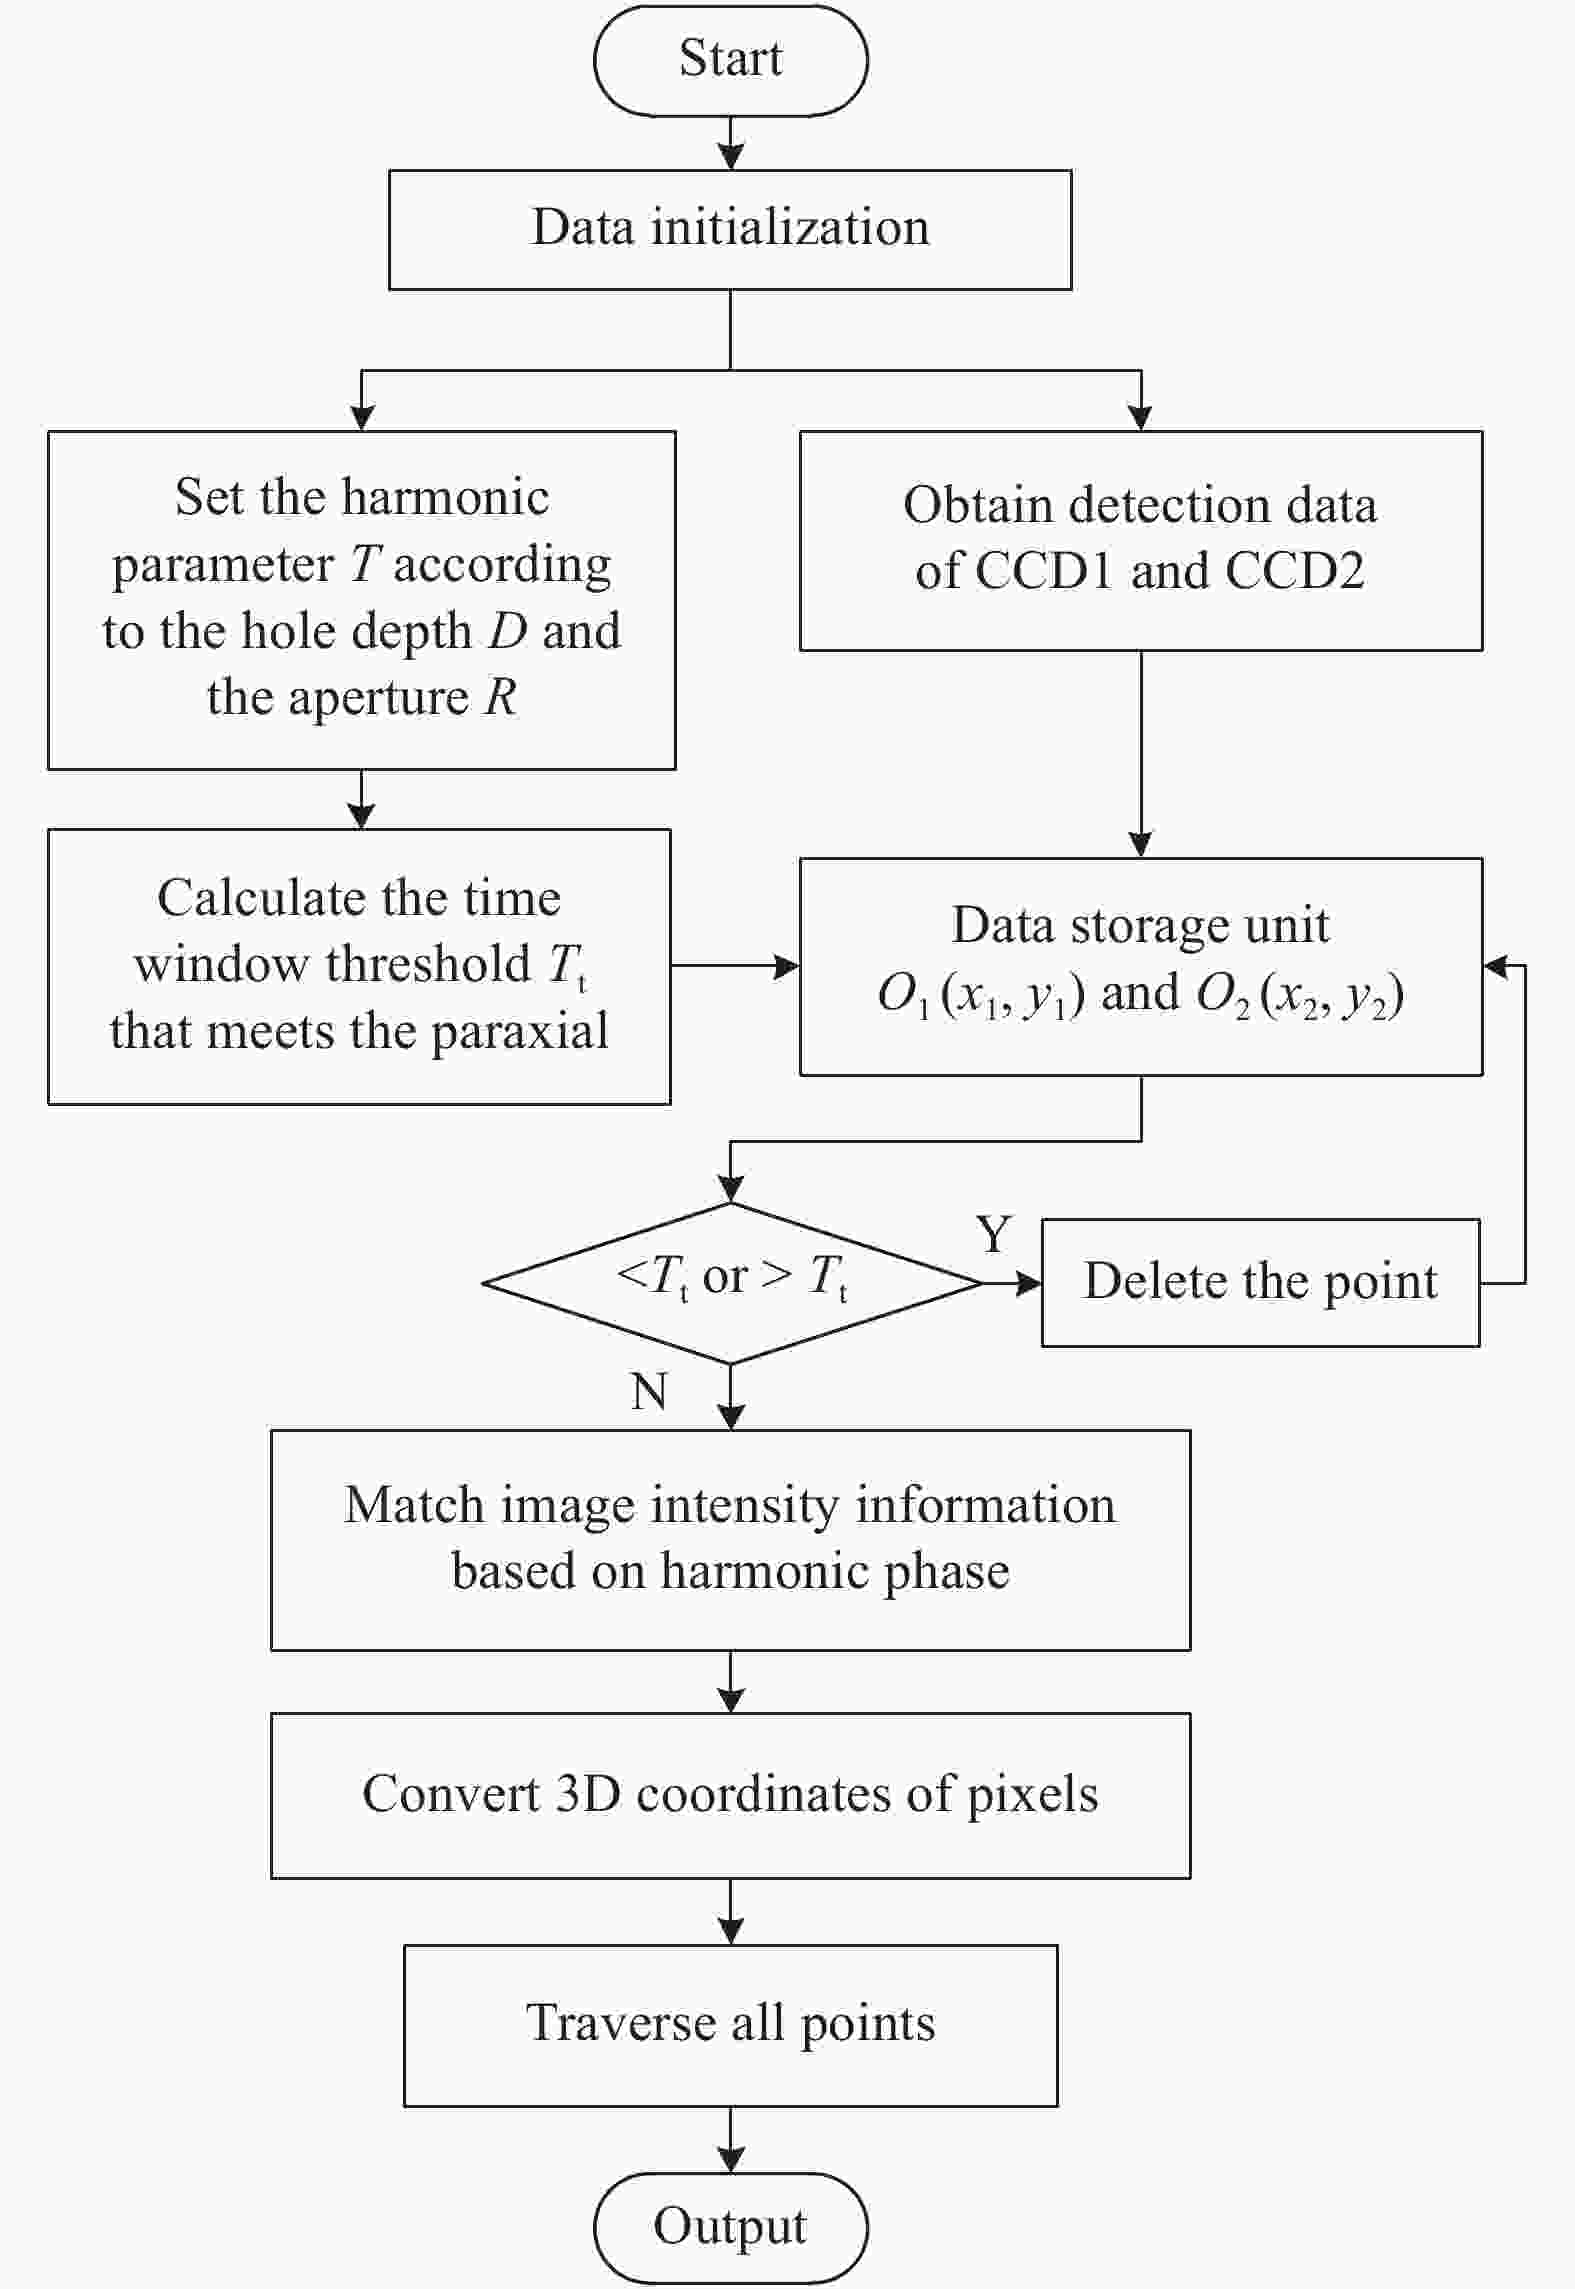
Figure 2. Harmonic matching point cloud optimization algorithm program flow chart
-
为了对比不同深孔的光学检测效果,分别选用了三种深孔类型:(1) 孔深5 cm,孔径5 cm;(2) 孔深15 cm,孔径9 cm;(3) 孔深50 cm,孔径15 cm。通过该系统获取孔内壁点云信息,然后将重建的内壁三维面型与理想深孔数模点云位置进行对比,分析深孔加工偏差程度。
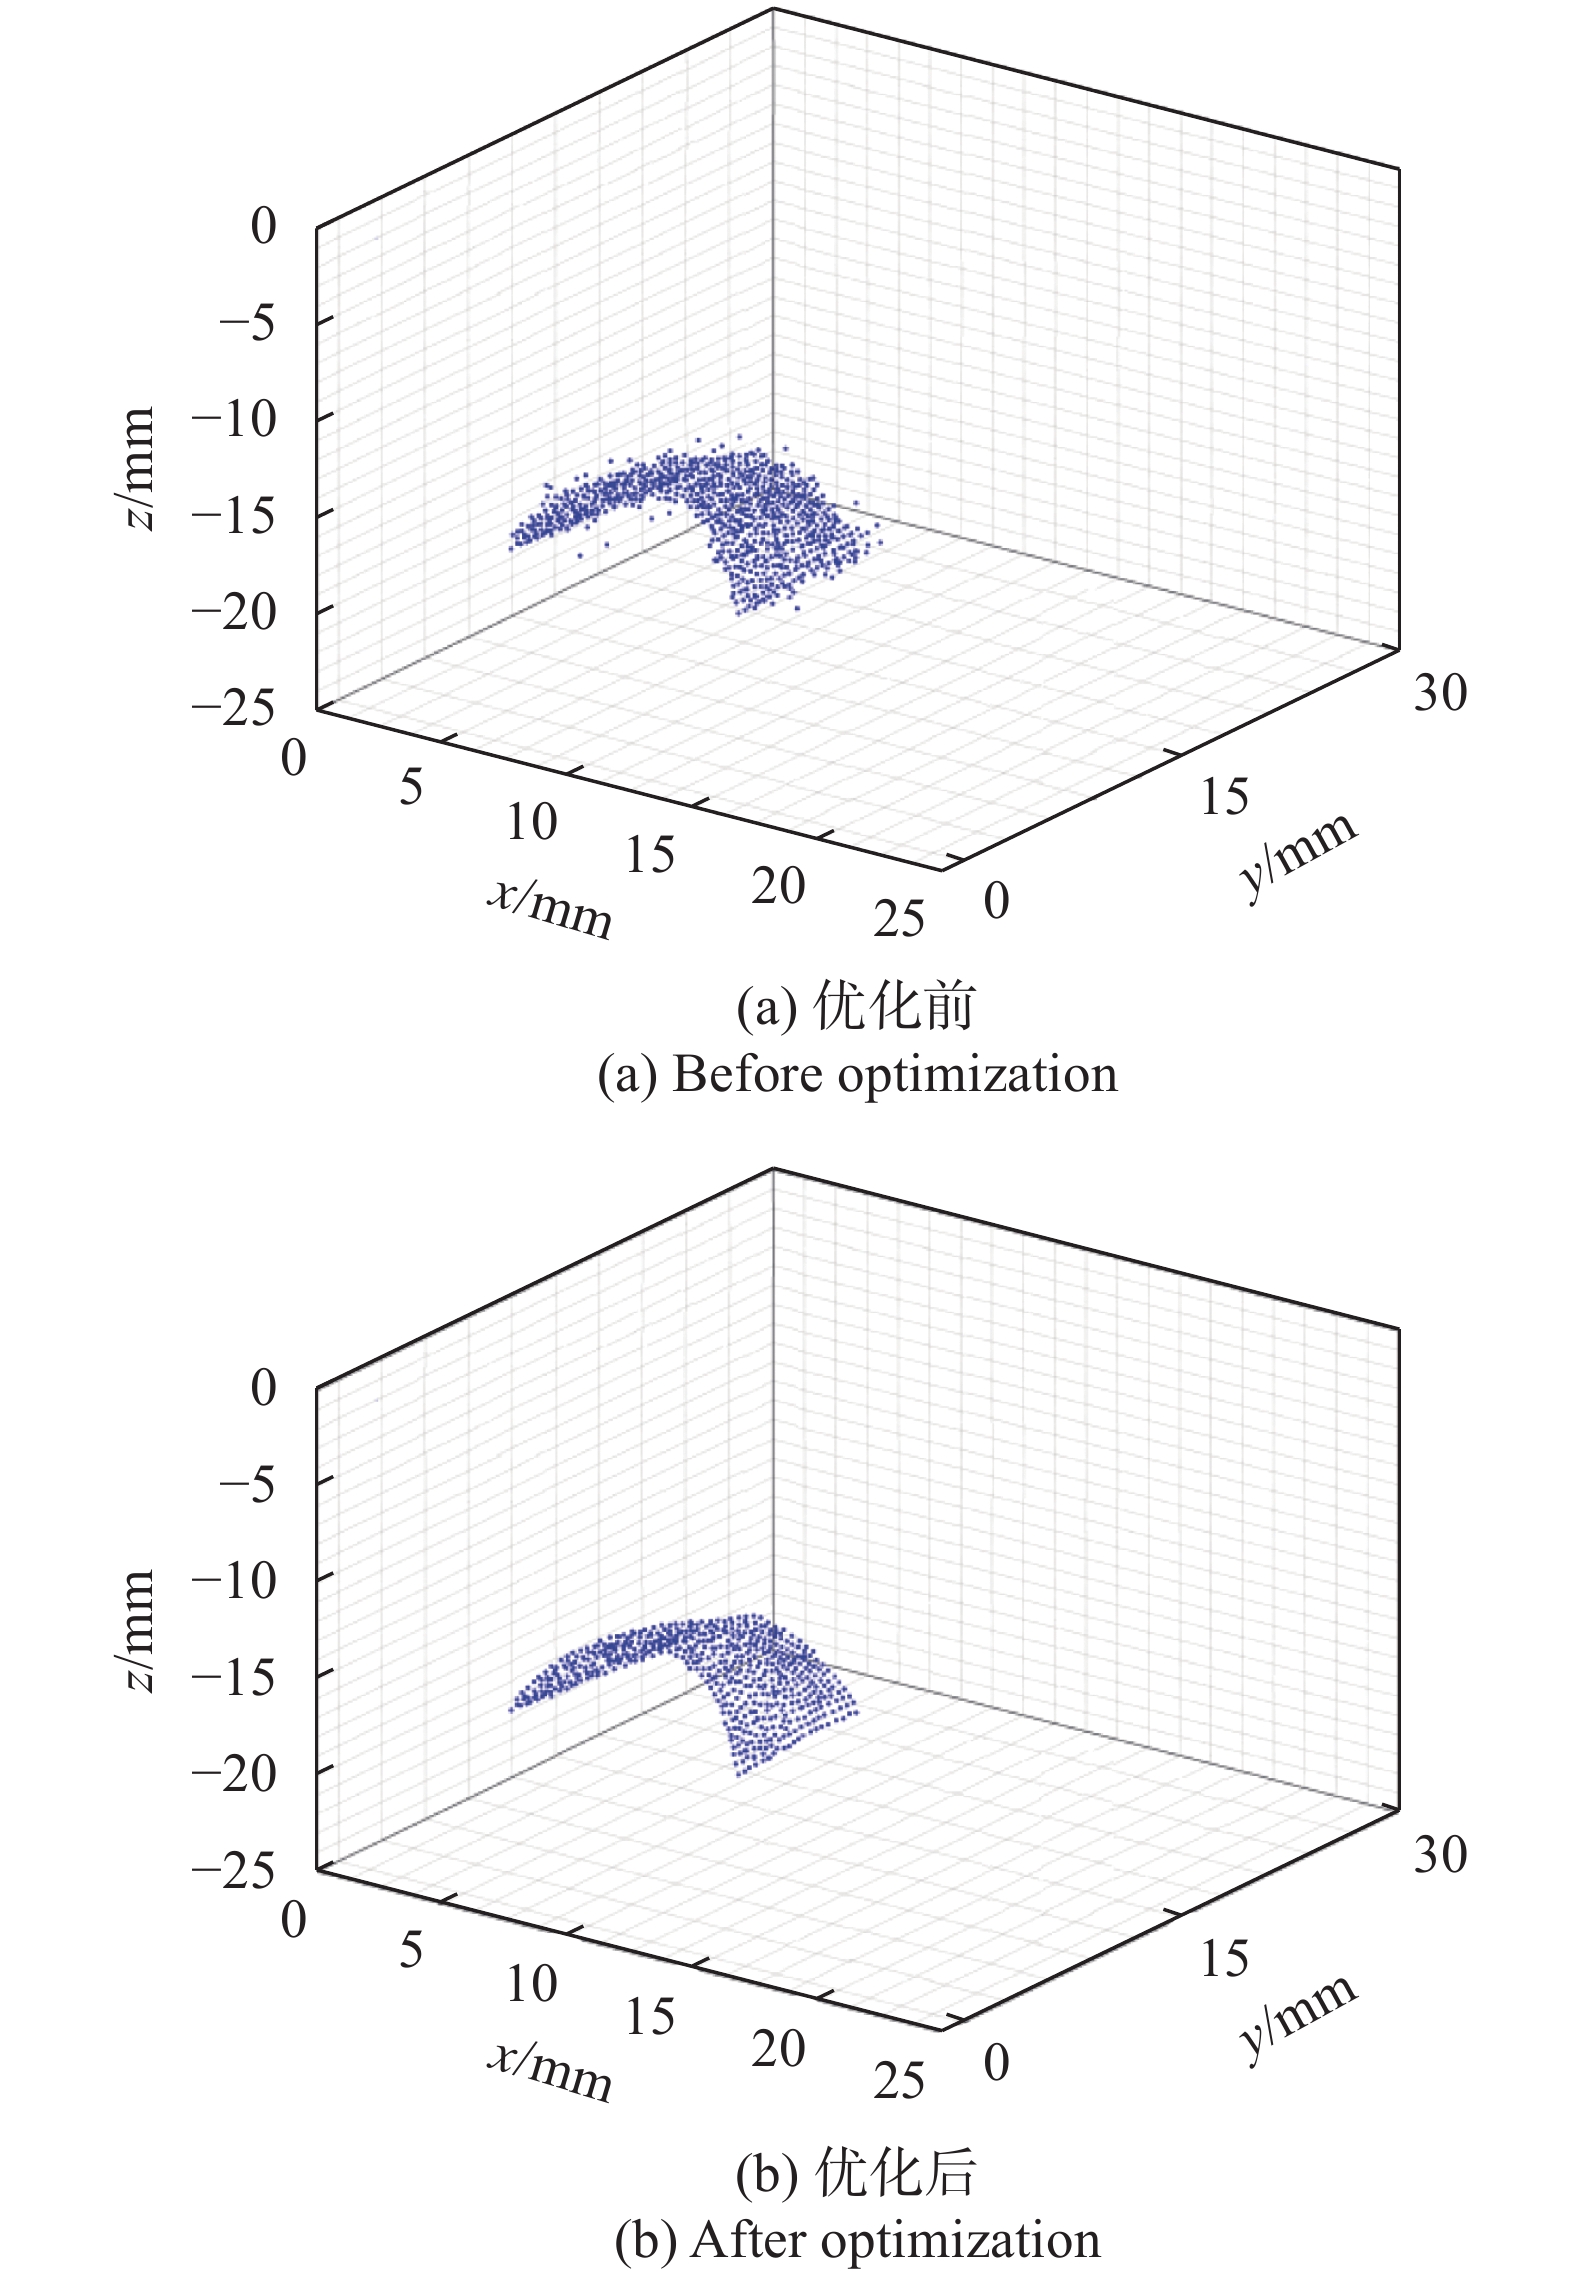
插入深孔的反射镜直径为4 cm,对光轴近轴范围的线激光反射并成像于两个固定位置CCD上,振镜扫描速度为10次/s,采集得到的点云通过MATLAB进行滤波。滤波函数与谐波信号匹配,对光程不符合测试范围的测试点进行剔除,然后对剩余有效点云进行三维重建,一个谐振调制周期的重建结果见图3。

Figure 3. Comparison of point cloud distribution
由图3 (a)和(b)可以看出,在采用谐波匹配点云优化算法前,点云总量大,但有很多点的位置偏差明显较大,分析认为这些点很多是由于在深孔内壁进行一次或多次反射叠加产生的,所以已经无法反映真实的深孔内壁位置信息。而通过与谐波频率匹配的闸门信号对CCD采集信号进行滤波,就能将非一次反射的回波信号屏蔽,从而仅获取扫描线激光近轴条件的回波信号。平均偏差从0.53 mm降低至0.12 mm。可见,采用优化算法对于提升深孔内壁点云获取速度和抑制杂散点具有很好的效果。
-
为了验证该系统计算的内壁点坐标位置精确程度,采用切割机将深孔从中间切开,从而获得一个内半圆柱表面,该表面就是深孔内壁的一次。若该表面测试结果符合设计要求,则可认为在反射镜测试区域对称的深孔中,三维面型的获取是一致的。采用Handyscan对相同测试区域的内壁面进行扫描,然后对比两组数据之间位置偏差,从而分析系统的位置计算精度。位置偏差如图4所示。
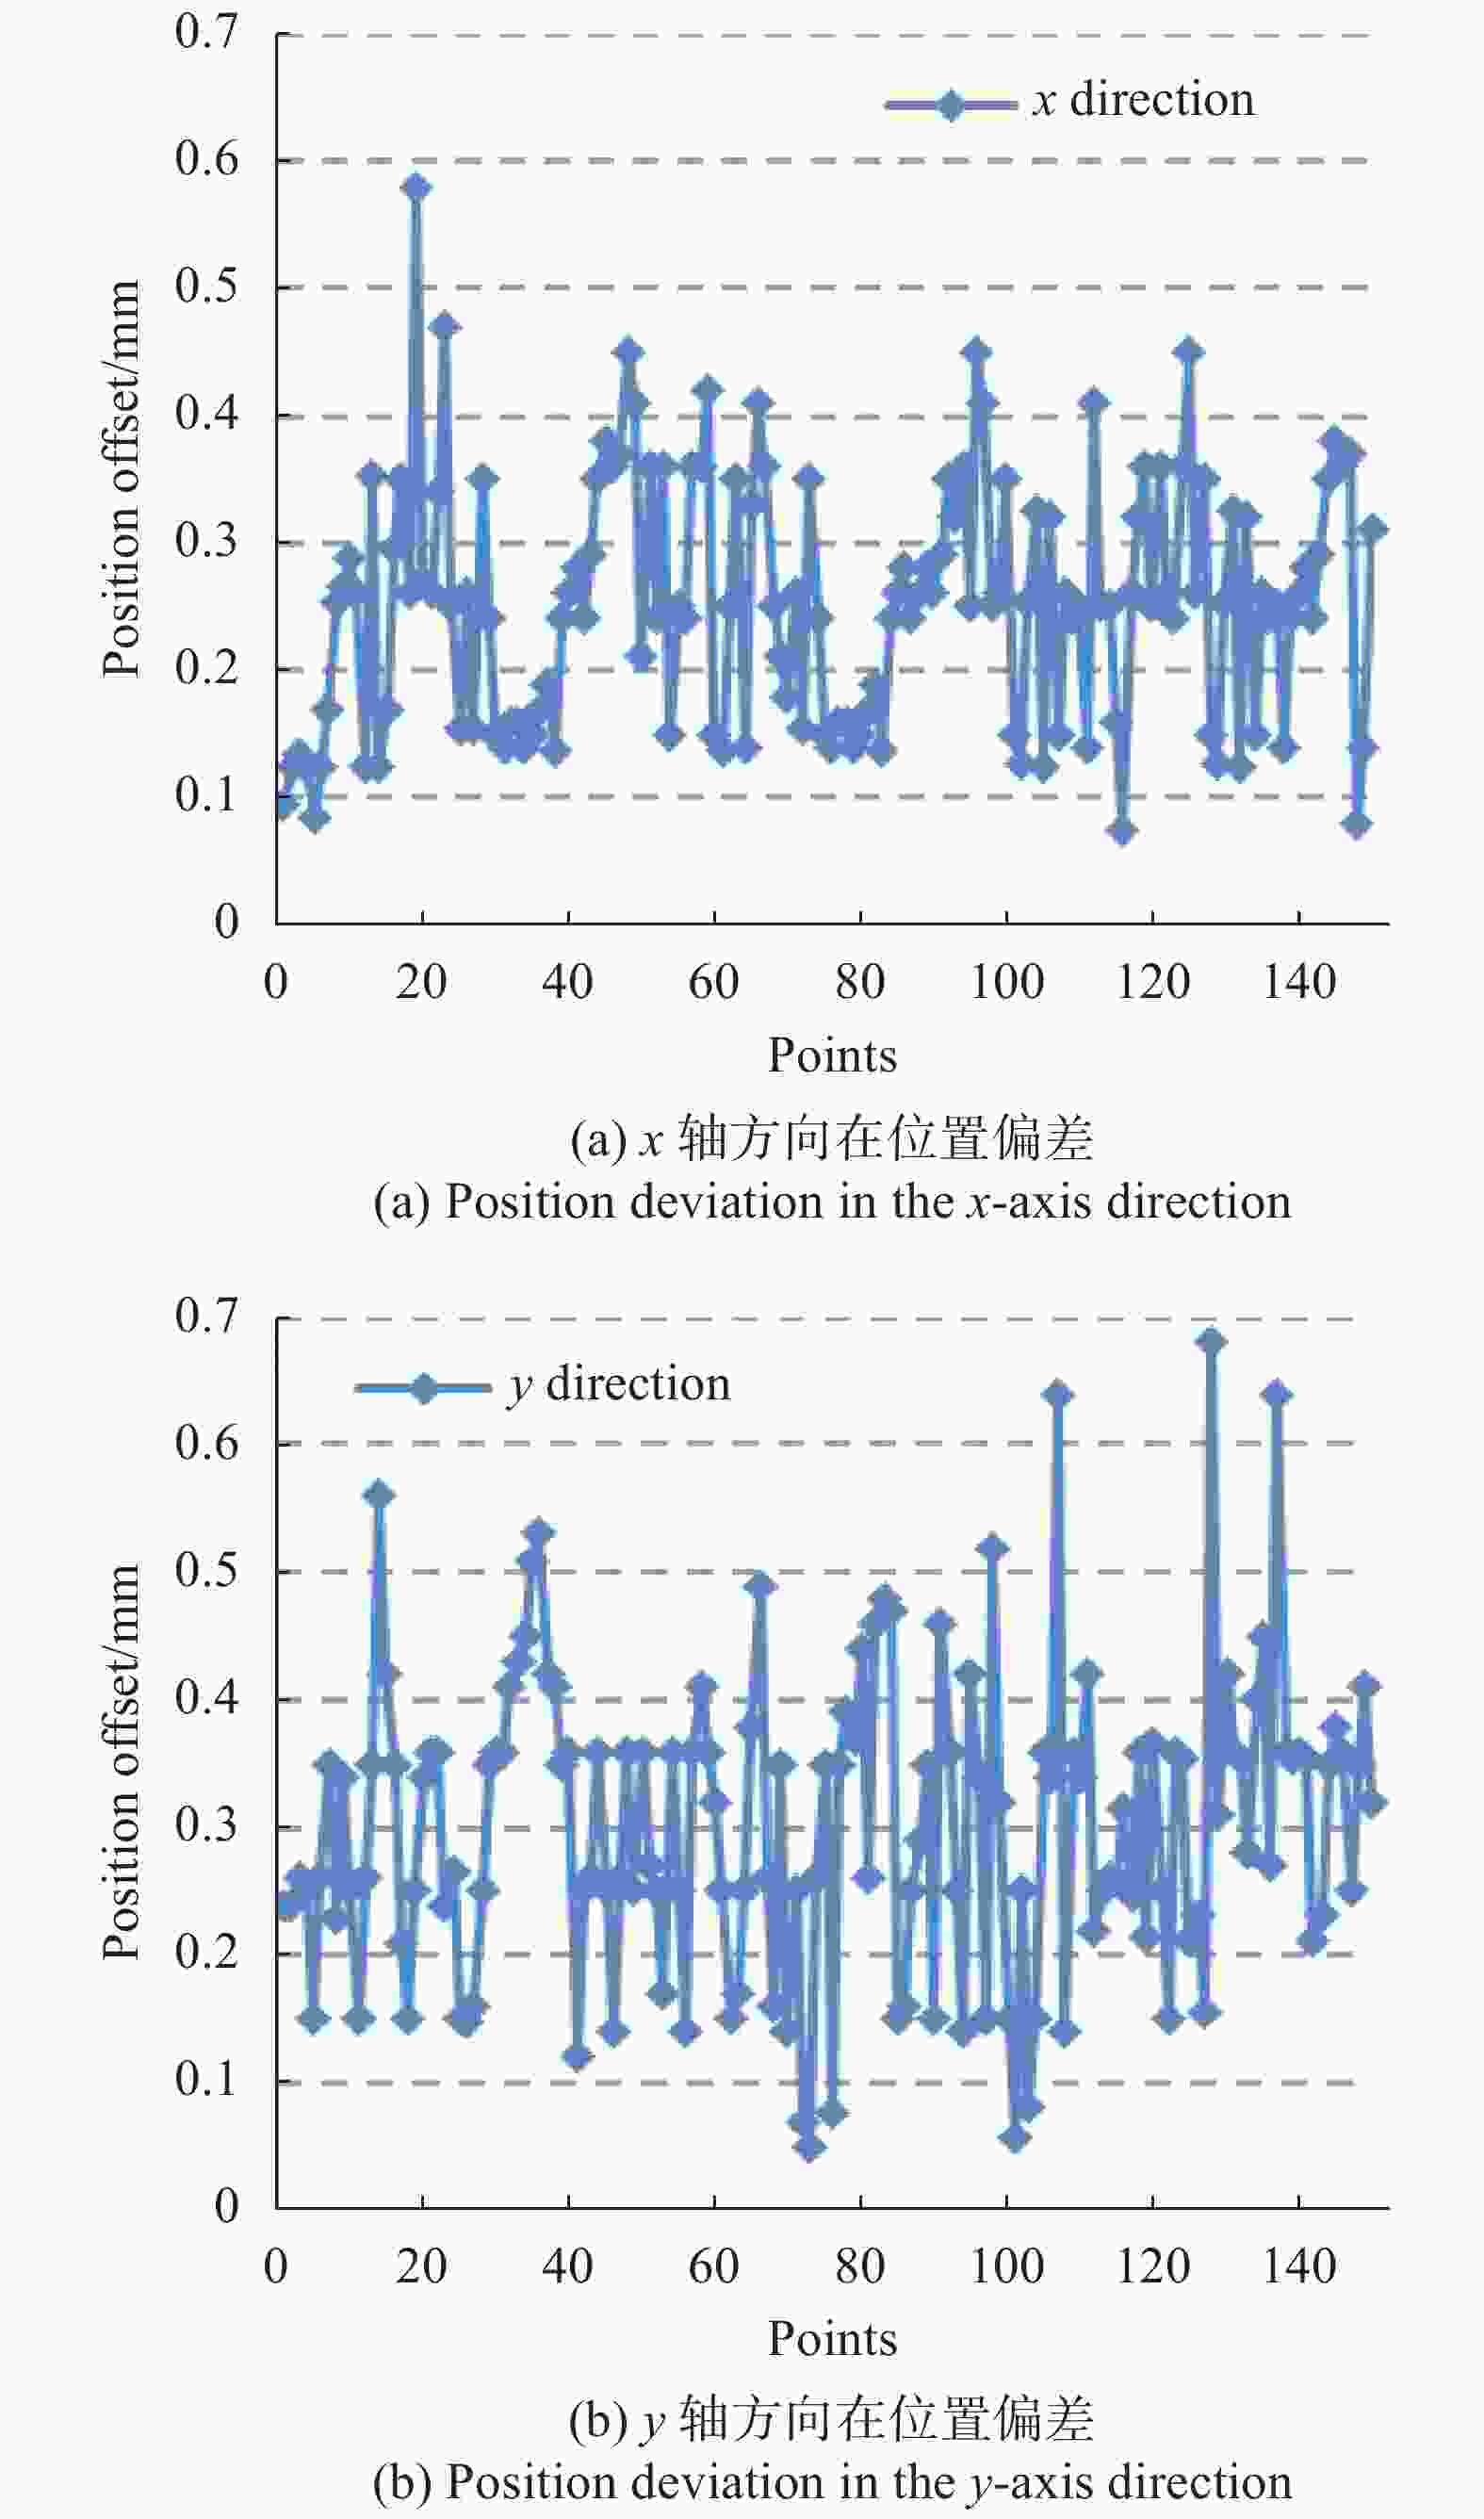
Figure 4. Comparison of position deviations in different directions
由图4 (a)和(b)可以看出,系统计算得到的点位置在x轴和y轴上与Handyscan的测试数据相近。x轴上绝大多数测试点位置偏差在0.1~0.4 mm之间,均值为0.240 mm;y轴上绝大多数测试点位置偏差在0.1~0.4 mm之间,均值为0.228 mm。其截面距离关系有:
故两个方向上的综合测试精度均值为0.234 mm。总体上看,系统对深孔内壁三维面型检测的精度优于引言中较通用的内壁面型检测方法。
-
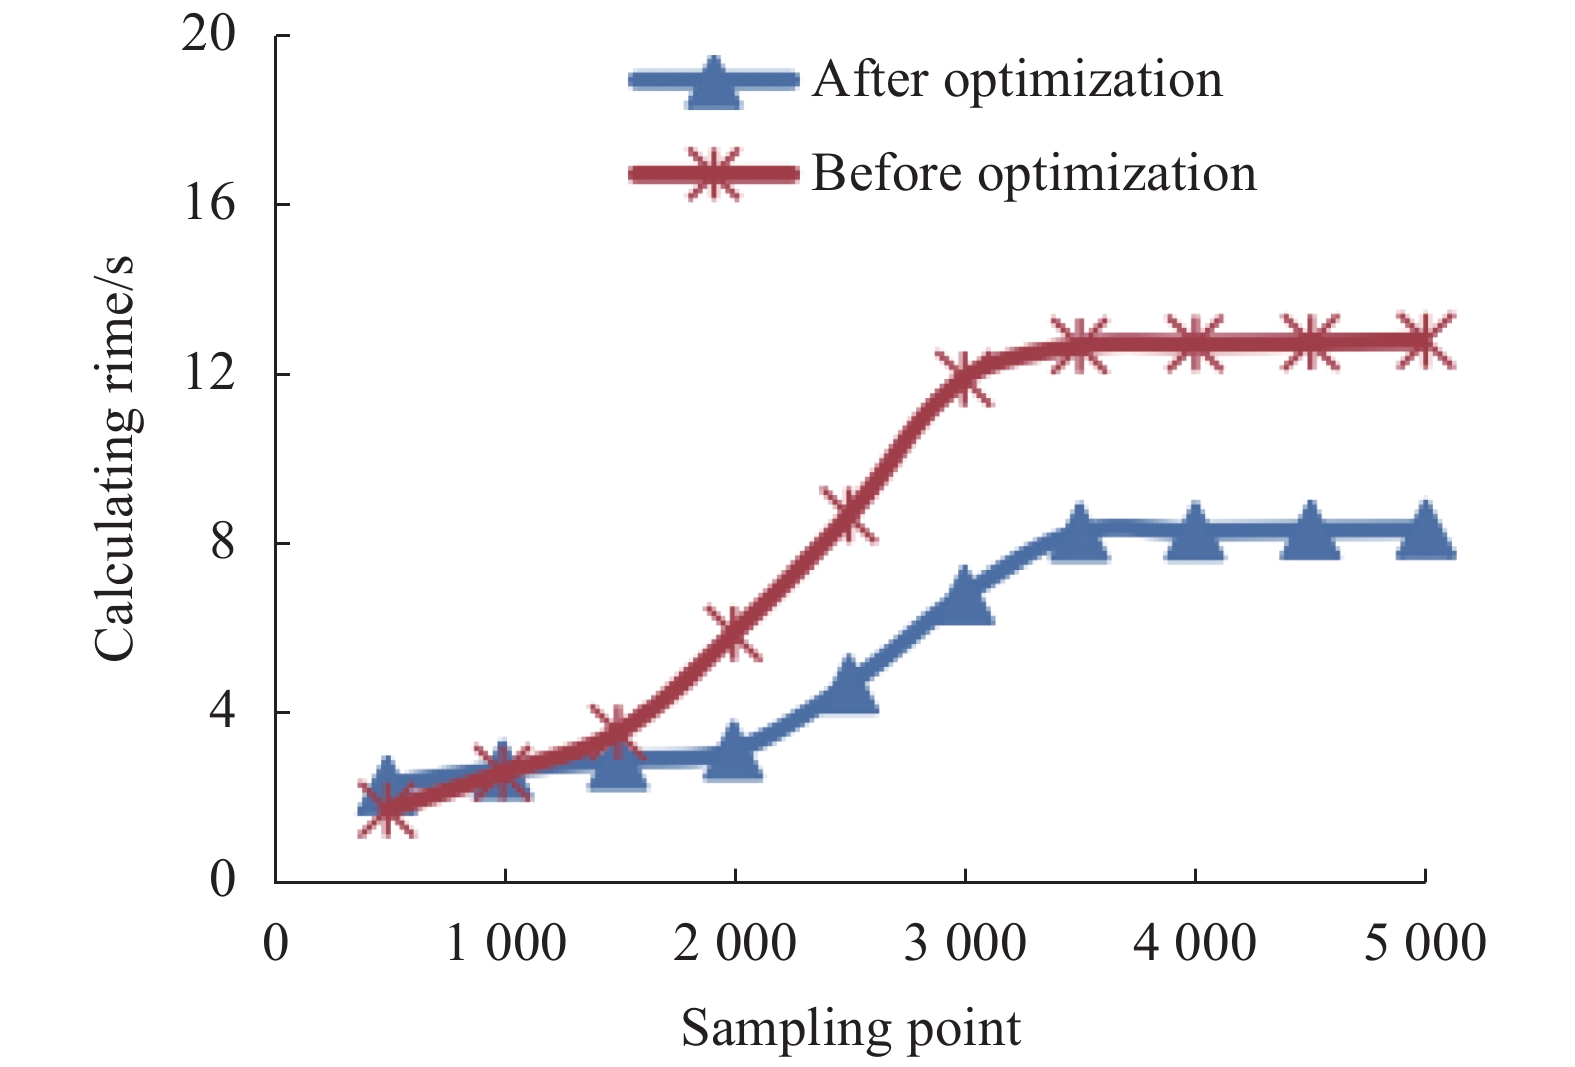
通过对比相同范围深孔内壁的三维面型数据获取时间,分析讨论了算法优化前后的用时,并对5 cm×5 cm范围的三维重建进行分析,以在固定范围内递增采样点数的方式对比算法的收敛速度,测试结果如图5所示。

Figure 5. Operation time consumption under different number of sampling points
根据不同采样点数对应的计算时间可以看出,当总采样点数较小的时候,优化前后的差异不大,基本都是在2.4 s左右完成三维点云数据的重建。但是当固定测试区域中的采样点逐渐增加时,优化算法的效果就逐渐明显了,当采样点超过2000个时,两种算法的用时曲线发生分离,当达到3500点左右时,优化后算法基本保持在12.4 s,而优化后仅为7.9 s。由于测试限定范围区间,所以采样点数设定在5000个以下,由此可以看出采用谐波匹配滤波算法进行优化可以有效降低系统的运算时间成本。
-
文中设计了一种基于激光谐波调制的深孔内壁三维面型检测系统。该系统通过深入孔内的反射镜实现深孔内壁任意位置的点云采集,通过谐波相位匹配算法实现杂散信号的抑制。实验结果显示,优化后点云总量降低、位置检测精度提高并且收敛用时减少,相比Handyscan设备的测试结果而言,该系统的测试偏差符合设计要求,在深孔内壁三维面型检测领域具有很好的应用前景。
Three-dimensional surface profile analysis system of deep hole inner wall based on laser harmonic modulation
doi: 10.3788/IRLA20210862
- Received Date: 2021-11-15
- Rev Recd Date: 2021-12-20
- Accepted Date: 2021-12-16
- Publish Date: 2022-04-07
Fund Project:
Foundation of Equipment Pre-research Area, grant number 80923010401, the Research Project Supported by Shanxi Scholarship Council of China, grant number 2021109 and 2021118; Fund Program for the Scientific Activities of Selected Returned Overseas Professionals in Shanxi Province, grant number 20200022 and 20210040; Shanxi Province Science Foundation for Youths, grant number 201901D211203
-
Key words:
- laser imaging /
- deep hole testing /
- harmonic modulation /
- threshold noise reduction
Abstract: In order to quickly and accurately obtain the three-dimensional surface profile of the inner wall of the deep hole structure and analyze the quality of the deep hole processing, a line scanning system based on laser harmonic modulation was proposed, and a reflective optical system that can penetrate deep into the deep hole structure was designed. The point cloud optimization algorithm for harmonic matching through time window filtering was studied. The algorithm used the harmonic modulation phase range to threshold the near-axis scanning area, thereby completing the point cloud data filtering. Experiments were conducted on three different types of deep holes, and the point cloud data was compared with the Handyscan three-dimensional imager. In this paper, the inner wall area of 5 cm×5 cm was quantitatively analyzed, and the three-dimensional point cloud images before and after optimization were compared. The point cloud before optimization obviously contained many stray points, and the comprehensive average deviation was 0.53 mm. After optimization, the noise was effectively suppressed, and the comprehensive average deviation was reduced to 0.12 mm. In the x-axis direction, the average value of the system position deviation was 0.240 mm, and in the y-axis direction, the average value of the system position deviation was 0.228 mm. Since the total amount of point cloud that needs to be calculated was reduced after optimization, the convergence speed had also been improved to a certain extent, and it stabilized above 3000 points, which was about 65.8% of the time before optimization. It can be seen that the system is suitable for the three-dimensional surface inspection of the inner wall of deep holes, and it provided a new idea for deep hole testing and data noise reduction.


 DownLoad: