


-
随着现代工业的快速发展,涂层和薄膜扮演着越来越重要的角色。涂层厚度直接影响涂层的光学性能、热学性能等,因此,现代工业对涂层厚度的测量提出了更高的要求。涂层厚度测量技术可以分为直接测量和间接测量。常见的直接测量技术有金相显微镜法、千分尺法和探针法等。这些测量技术大多具有破坏性,且检测精度有限。间接测量是通过测量材料的声、光、热、电、磁等物理性质的变化,将相关的物理量通过计算转化为涂层厚度。超声检测的优势在于穿透力强、方向性好,但需要在待测件表面涂抹耦合剂,且材料中的分层、气孔等缺陷也会导致测量误差,在工业检测中会受到一定限制[1-3];涡流检测的优势在于检测速度快,无需耦合剂,但要求待测件是导电金属材料[4-6],且并不具备大面积检测的能力,不适用于现代工业大面积的涂层厚度检测;红外检测具备检测速度快、非接触、检测面积大等优势,能够胜任现代工业对涂层厚度的检测工作。
目前对于大多数红外检测技术,待测件大多是不透明的,激励能量被材料吸收引起表层温度迅速上升。然而,对于一些透明度较高的涂层材料,激励能量并不仅仅作用在材料表层,而是对涂层整体进行加热,因此,广泛使用的表面加热模型已不再适用。
Ptaszek 进行了关于热障涂层缺陷检测的理论和实验分析,提出使用长波红外相机可以消除半透明性对温度采集的不利影响[7]。Shepard等人研究了基于脉冲热成像的半透明热障涂层厚度检测技术,认为传统的TSR方法在一定程度上仍然可以用于检测涂层厚度[8]。李艳红等人通过在样品表面喷涂黑色涂料来消除涂层的半透明性,并使用二阶导数的峰值时刻来确定涂层厚度[9]。赵世斌等人在TBC表面喷涂胶体石墨,通过脉冲热成像检测热障涂层的疲劳缺陷 [10]。刘颖韬等人建立半透明试件内部缺陷的脉冲红外物理加热模型,结果显示试件的半透明性会降低表面温度信号或改变信号变化趋势,这可能会影响检测能力 [11-12]。郭兴旺等人通过有限元仿真进行闪光灯色温对缺陷检测效果影响的研究,结果显示低色温和高色温闪光灯对半透明材料红外检测更有利[13]。唐庆菊等人建立了不透明涂层的脉冲红外加热双层热传导模型,结果显示提高脉冲能量有助于涂层厚度不均匀性检测,提高采样频率有利于采集最大对比度红外图像[14]。Sreedhar等人基于脉冲相位热成像和太赫兹时域光谱进行热障涂层厚度退化对比研究,结果显示脉冲法检测误差小于10%,有助于飞机发动机等部件的预防性维修措施[15]。Shrestha等人通过有限元仿真和实验进行脉冲相位法和锁相法的涂层测厚对比研究,结果显示脉冲相位法的检测速度和检测精度都更胜一筹[16-17]。Caruso等人基于脉冲红外热成像对半透明纸制品的表面温度场进行研究,有限元数值模拟和实验结果显示样品表面温度变化与半透明纸品厚度呈现相关性[18]。何棱云等人基于长脉冲红外加热进行环氧树脂涂层测厚研究,提出一种基于 k 范围温度变化斜率曲线的涂层厚度检测方法,实验结果显示该方法对于环氧树脂涂层的检测误差小于10%[19]。
上述大多数研究都是用不透明材料覆盖待测件表面以避免涂层透明性的干扰,或者忽略涂层的透明性影响。基于红外无损检测直接对半透明涂层进行测厚的研究较少,且检测精度不高。因此,文中建立了半透明涂层的半无限大脉冲红外加热理论模型和脉冲红外加热双层物理模型,以中等吸光度和较薄涂层作为重点,分析不同厚度下的表面温度场,制作样品并通过实验验证了理论模拟结果。
-
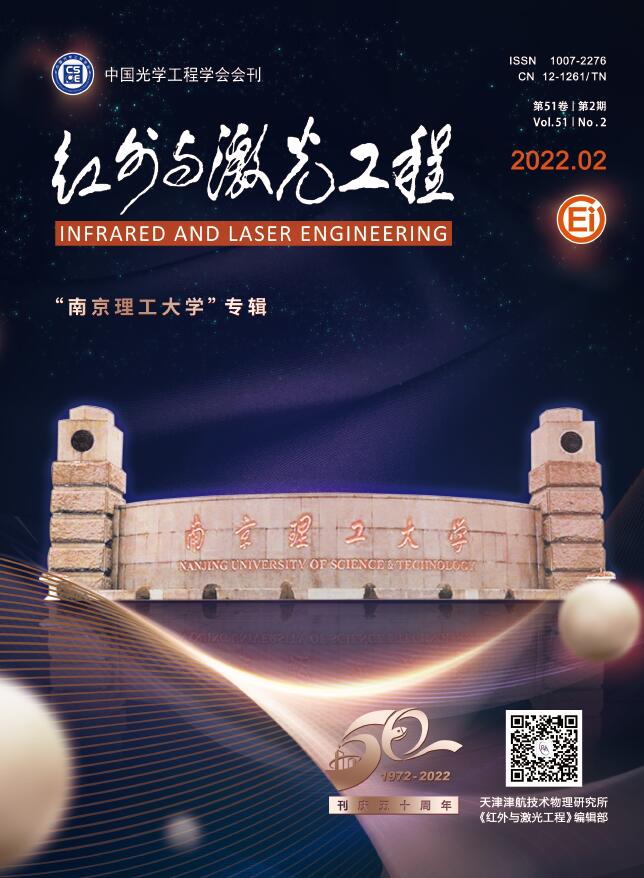
对于半透明涂层的传热问题,由于激励方式是脉冲激励,只考虑热流在厚度方向的传热过程。假设材料各向同性且处处均匀,基底厚度无限大,这样将原来的三维双层结构热传导问题简化为一维双层结构热传导问题。 图1所示为脉冲红外加热的半透明涂层几何模型,其中l为涂层的厚度。
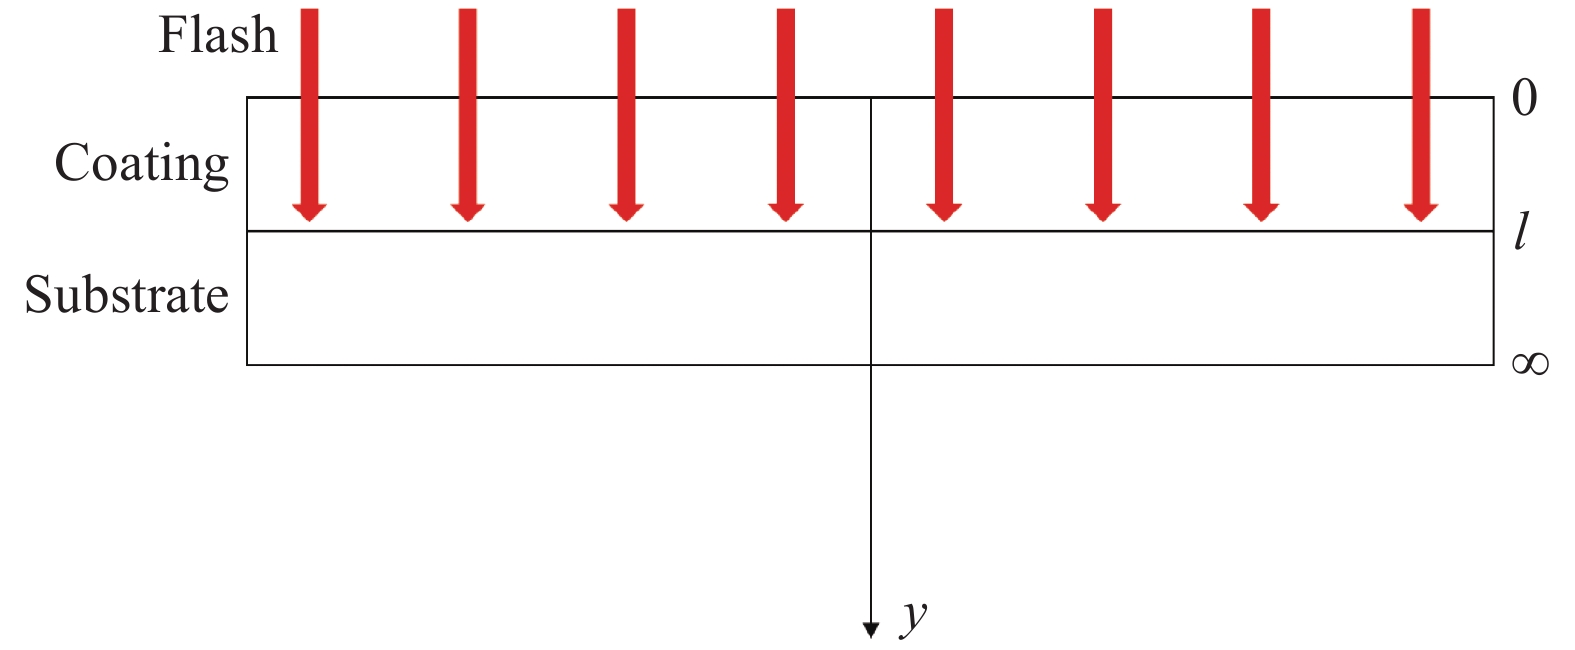
Figure 1. Schematic diagram of theoretical analysis model
当脉冲光激励在涂层表面时,一部分光被涂层表面反射,另一部分光透过涂层上表面,经过涂层吸收后剩余能量辐照在基底表面被基底吸收。为了分析计算方便,假定材料和基底的热力学参数相同,不考虑材料热力学参数随温度变化的情况,仅考虑脉冲光能量和材料的热传导。建立热传导方程:
式中:$ T(y, t) $为材料的温度;$ k $为材料的导热系数;$\rho $为材料的密度;$c$为材料的比热容;$ q $为材料的内热源,代表单位时间内脉冲光作用在材料单位体积上产生的能量。表示为:
式中:$ p_{0} $为脉冲光的功率密度;$ f(y) $为脉冲光在空间上的分布函数;$ g(t) $为脉冲光在时间上的分布函数。脉冲光在$ y $方向上呈现指数规律衰减,由于半透明涂层的穿透深度较大,不能忽视脉冲光直接对基底表面的热作用,因此脉冲光的时间和空间分布函数分别表示为:
式中:$\;\mu $为半透明材料的消光系数;$ \eta(y) $为阶跃函数;$ \delta(y) $为脉冲函数;$ t_{0} $为脉冲光激励时刻。
初始条件:
边界条件:
由于$ t_{0} \rightarrow 0 $,通过Laplace变换:
$y \rightarrow \omega$,$t \rightarrow s$,$ T \rightarrow U $
将公式(1)改写为:
首先对s做Laplace逆变换:
其中
$ F(\omega) $的逆变换为:
$ G(\omega) $的逆变换为:
将公式(12)和公式(13)卷积后代入公式(9)得到半透明涂层表面温度场:
假定闪光灯功率500 W,半透明材料为环氧树脂,其消光系数为0.5 mm−1,得到图2所示的不同厚度的半透明涂层表面温度时间变化曲线。
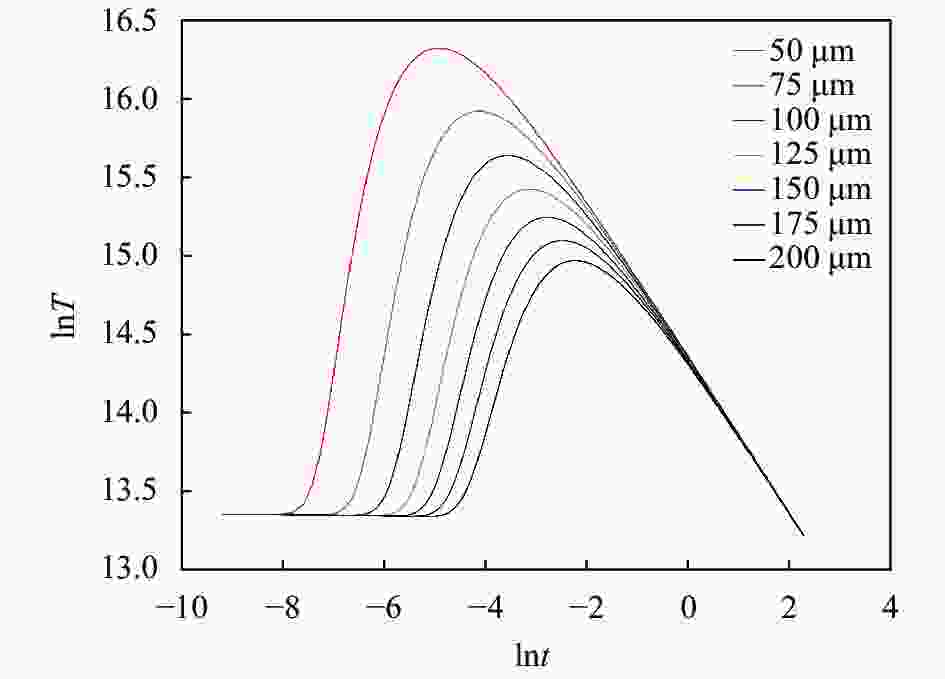
Figure 2. Analytical surface temperature of samples with different coating thickness vs time in double logarithm scale
从图2中可以看出,因为脉冲光对不同涂层厚度的样品表面激励能量相同,不同涂层厚度的样品表面温度在初始时刻温度一致。由于脉冲光同时激励交界面,交界面具有更高的温度,热流同时向涂层上表面和基底下表面传导,样品表面温度持续升高,直到热流到达涂层表面,此时表面温度达到峰值。由于基底半无限大,热流持续向下传导,样品表面温度持续下降,最终不同厚度的样品表面温度以同样的速率降温,降温曲线斜率近似为−0.5,说明此时模型和半无限大脉冲激励一维热传导模型的降温过程近似。
图3显示了表面温度峰值时刻与涂层厚度在对数坐标的关系。结果显示涂层厚度与表面温度峰值时刻在对数坐标上呈现线性关系。材料热力学参数固定的情况下,热波在固体中一维热传导的距离和时间呈现指数关系。表面温度峰值出现的原因是交界面向涂层上表面的热传导作用,因此涂层厚度和表面温度在对数坐标上呈现线性关系。
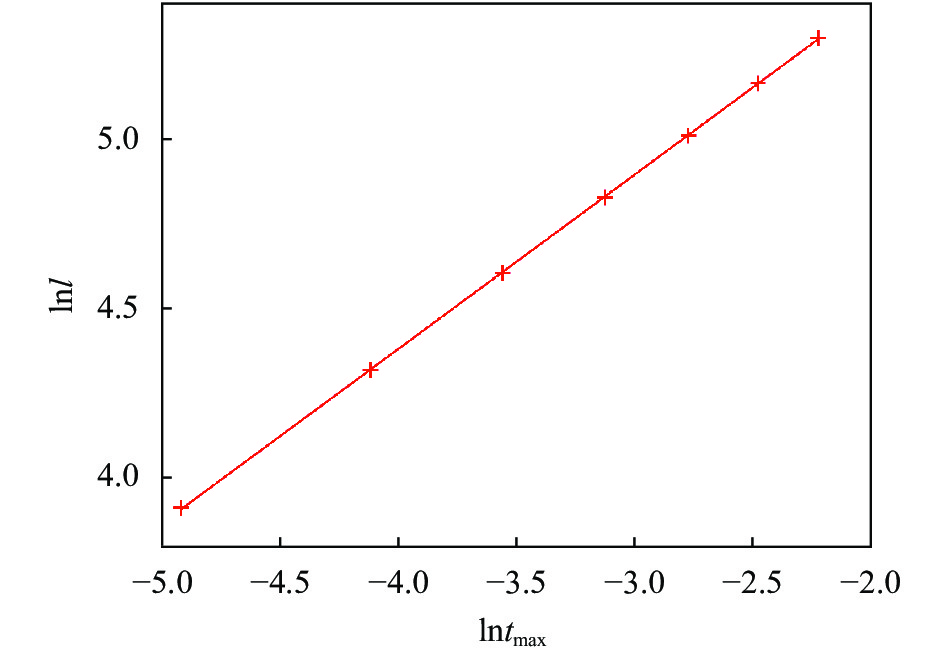
Figure 3. Coating thickness vs peak time of surface temperature in logarithm scale
-
图4为半透明涂层的红外加热模型。其中a为模型长度,b和l分别为基底和涂层的厚度。
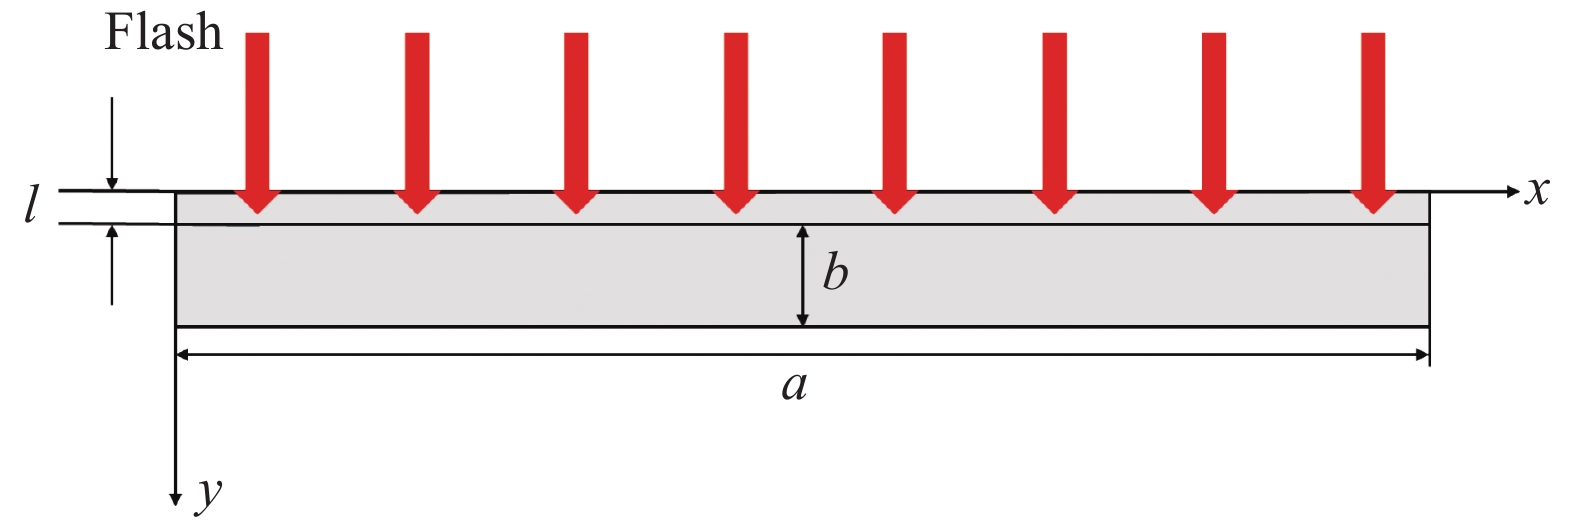
Figure 4. Schematic diagram of numerical calculation model
-
当脉冲光激励在涂层表面后,一部分光被涂层上表面反射,另一部分光透过涂层上表面,经过涂层吸收后剩余能量辐照在基底表面,被基底吸收。涂层和基底吸收能量后温度迅速升高。为了分析方便,不考虑材料热力学参数随温度变化的情况,仅考虑脉冲光能量和材料的热传导。因此,热传导方程表示为:
式中:$ T_{1}(y, t) $和$ {{T}}_{2}({y,t}) $分别表示t时刻时涂层和基底的温度场; $ k_{1} $ 和$ k_{2} $分别表示涂层和基底的导热系数;$ \;\rho_{1} $和$\; \rho_{2} $分别表示涂层和基底的密度;$ c_{1} $和$ c_{2} $分别表示涂层和基底的比热容;$ q_{1} $和$ q_{2} $为涂层和基底的内热源。
在闪光灯辐照下,半透明涂层吸收闪光灯能量转化成热能引起涂层温度迅速升高,剩余能量被基底金属材料吸收转化成热能引起表层温度迅速升高。金属材料的表层厚度一般在纳米级,因此可以将闪光灯对金属基底的热作用看作边界条件,内热源可以表示为:
式中:$ p_{0} $为脉冲光功率密度;$ f(y) $为闪光灯在涂层内部的空间分布函数;$ g(t) $为闪光灯的时间分布函数。分别表示为:
式中:$\;\mu $为材料的消光系数;$\varepsilon (t)$为关于时间的阶跃函数;${t_0}$为闪光灯脉冲持续时间。在涂层与基底的交界面满足连续条件:
模型中基底下表面的边界条件按照绝热条件处理:
温度场的初始条件:
-
由于环氧树脂具备高透明性,将其与碳粉混合作为半透明涂层的材料,结构钢作为基底。
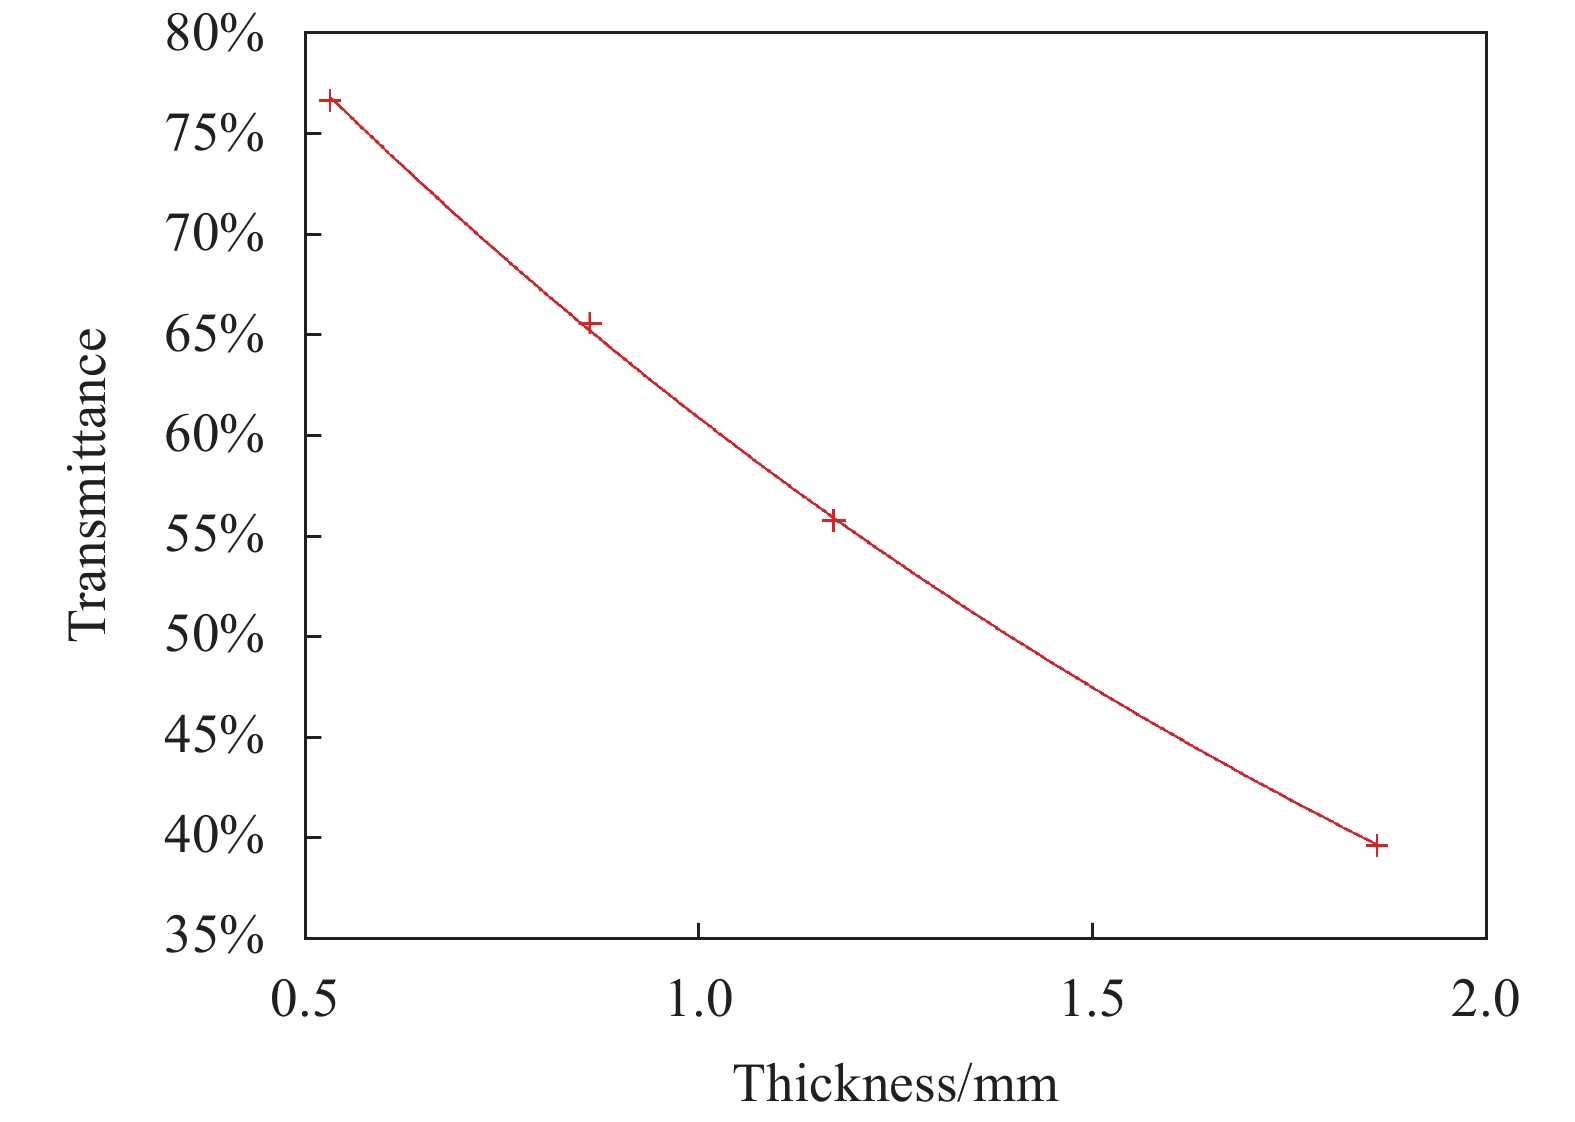
为了确定涂层材料的消光系数$\;\mu $,制作了不同厚度的半透明试片,通过测量不同厚度试片的透射光强,对不同厚度的透射光强进行拟合,效果如图5所示。得到半透明涂层厚度与光强的关系如下:
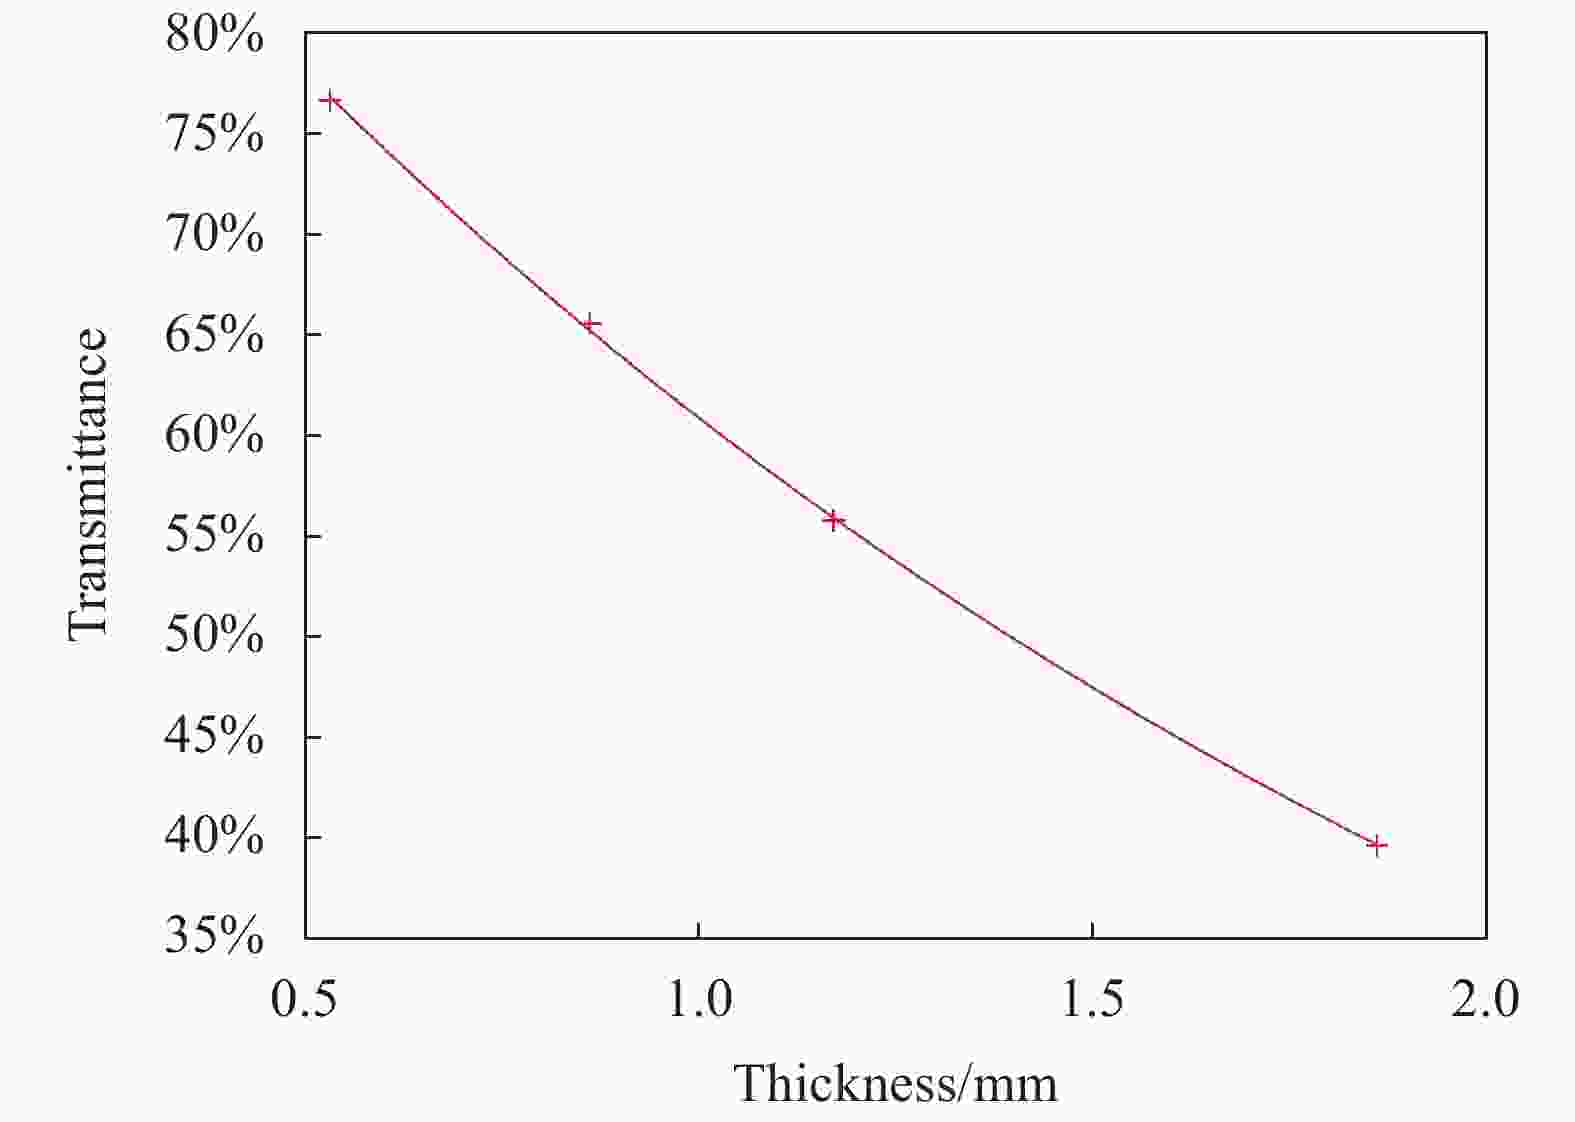
Figure 5. Coating thickness vs transmittance
故半透明涂层的消光系数$\;\mu = 0.496\;5$ mm−1,材料的其他热力学参数如表1所示。
Density/
$\mathrm{k}\mathrm{g}\cdot{\mathrm{m} }^{-3}$Heat
capacity/
$\mathrm{J}\cdot(\mathrm{k}\mathrm{g}\cdot \mathrm{K}$)−1Thermal
conductivity/
$\mathrm{W}\cdot(\mathrm{m}\cdot \mathrm{K}$)−1Coating 1200 1000 0.2 Substrate 7850 475 80 Table 1. Parameters used in the model
-
在仿真中,涂层厚度范围为50~200 µm,厚度步长25 µm, 基底厚度5 mm,脉冲峰值功率104 W,闪光灯脉冲持续时间为3 ms。样品表面温度T在对数坐标的时间变化如图6所示。

Figure 6. Simulation surface temperature of samples with different coating thickness vs time in double logarithm scale
结果表明,虽然涂层厚度不同,但由于涂层表面吸收的能量相等,涂层的表面温度在一开始基本相同。由于热传导作用,金属基底表层吸收的能量传递到涂层表面,导致涂层表面温度升高达到峰值温度。随着时间推移,涂层表面温度逐渐降低,直到试件整体达到热平衡状态。
分析图6中温度信号变化规律可知,涂层表面温度到达峰值的时刻与涂层的厚度有关。图7显示了表面温度峰值时刻与涂层厚度在对数坐标的关系。图中的线性关系表明,该方法可应用于半透明涂层的厚度测量。

Figure 7. Coating thickness vs simulation peak time of surface temperature in logarithm scale
-
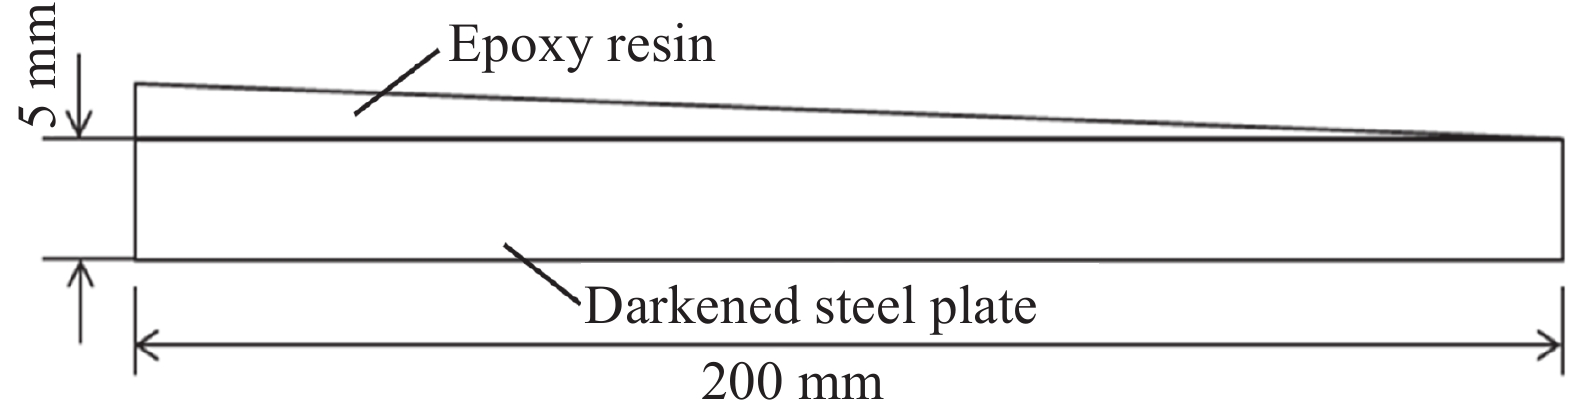
将环氧树脂和碳粉混合作为半透明涂层的材料,将其浇注在深色钢板的表面上,钢板右侧向上倾斜0.5 mm。因此,涂层的厚度从左到右逐渐减少。值得注意的是,与常规红外无损检测不同,样品表面不经过喷黑漆处理,图8为厚度连续变化的涂层试件示意图。

Figure 8. Schematic diagram of the coating specimen
基底长200 mm,宽100 mm,厚度5 mm。在浇注涂层前后,分别用千分尺多点测量试件的厚度,取其差值作为该点涂层厚度。
-
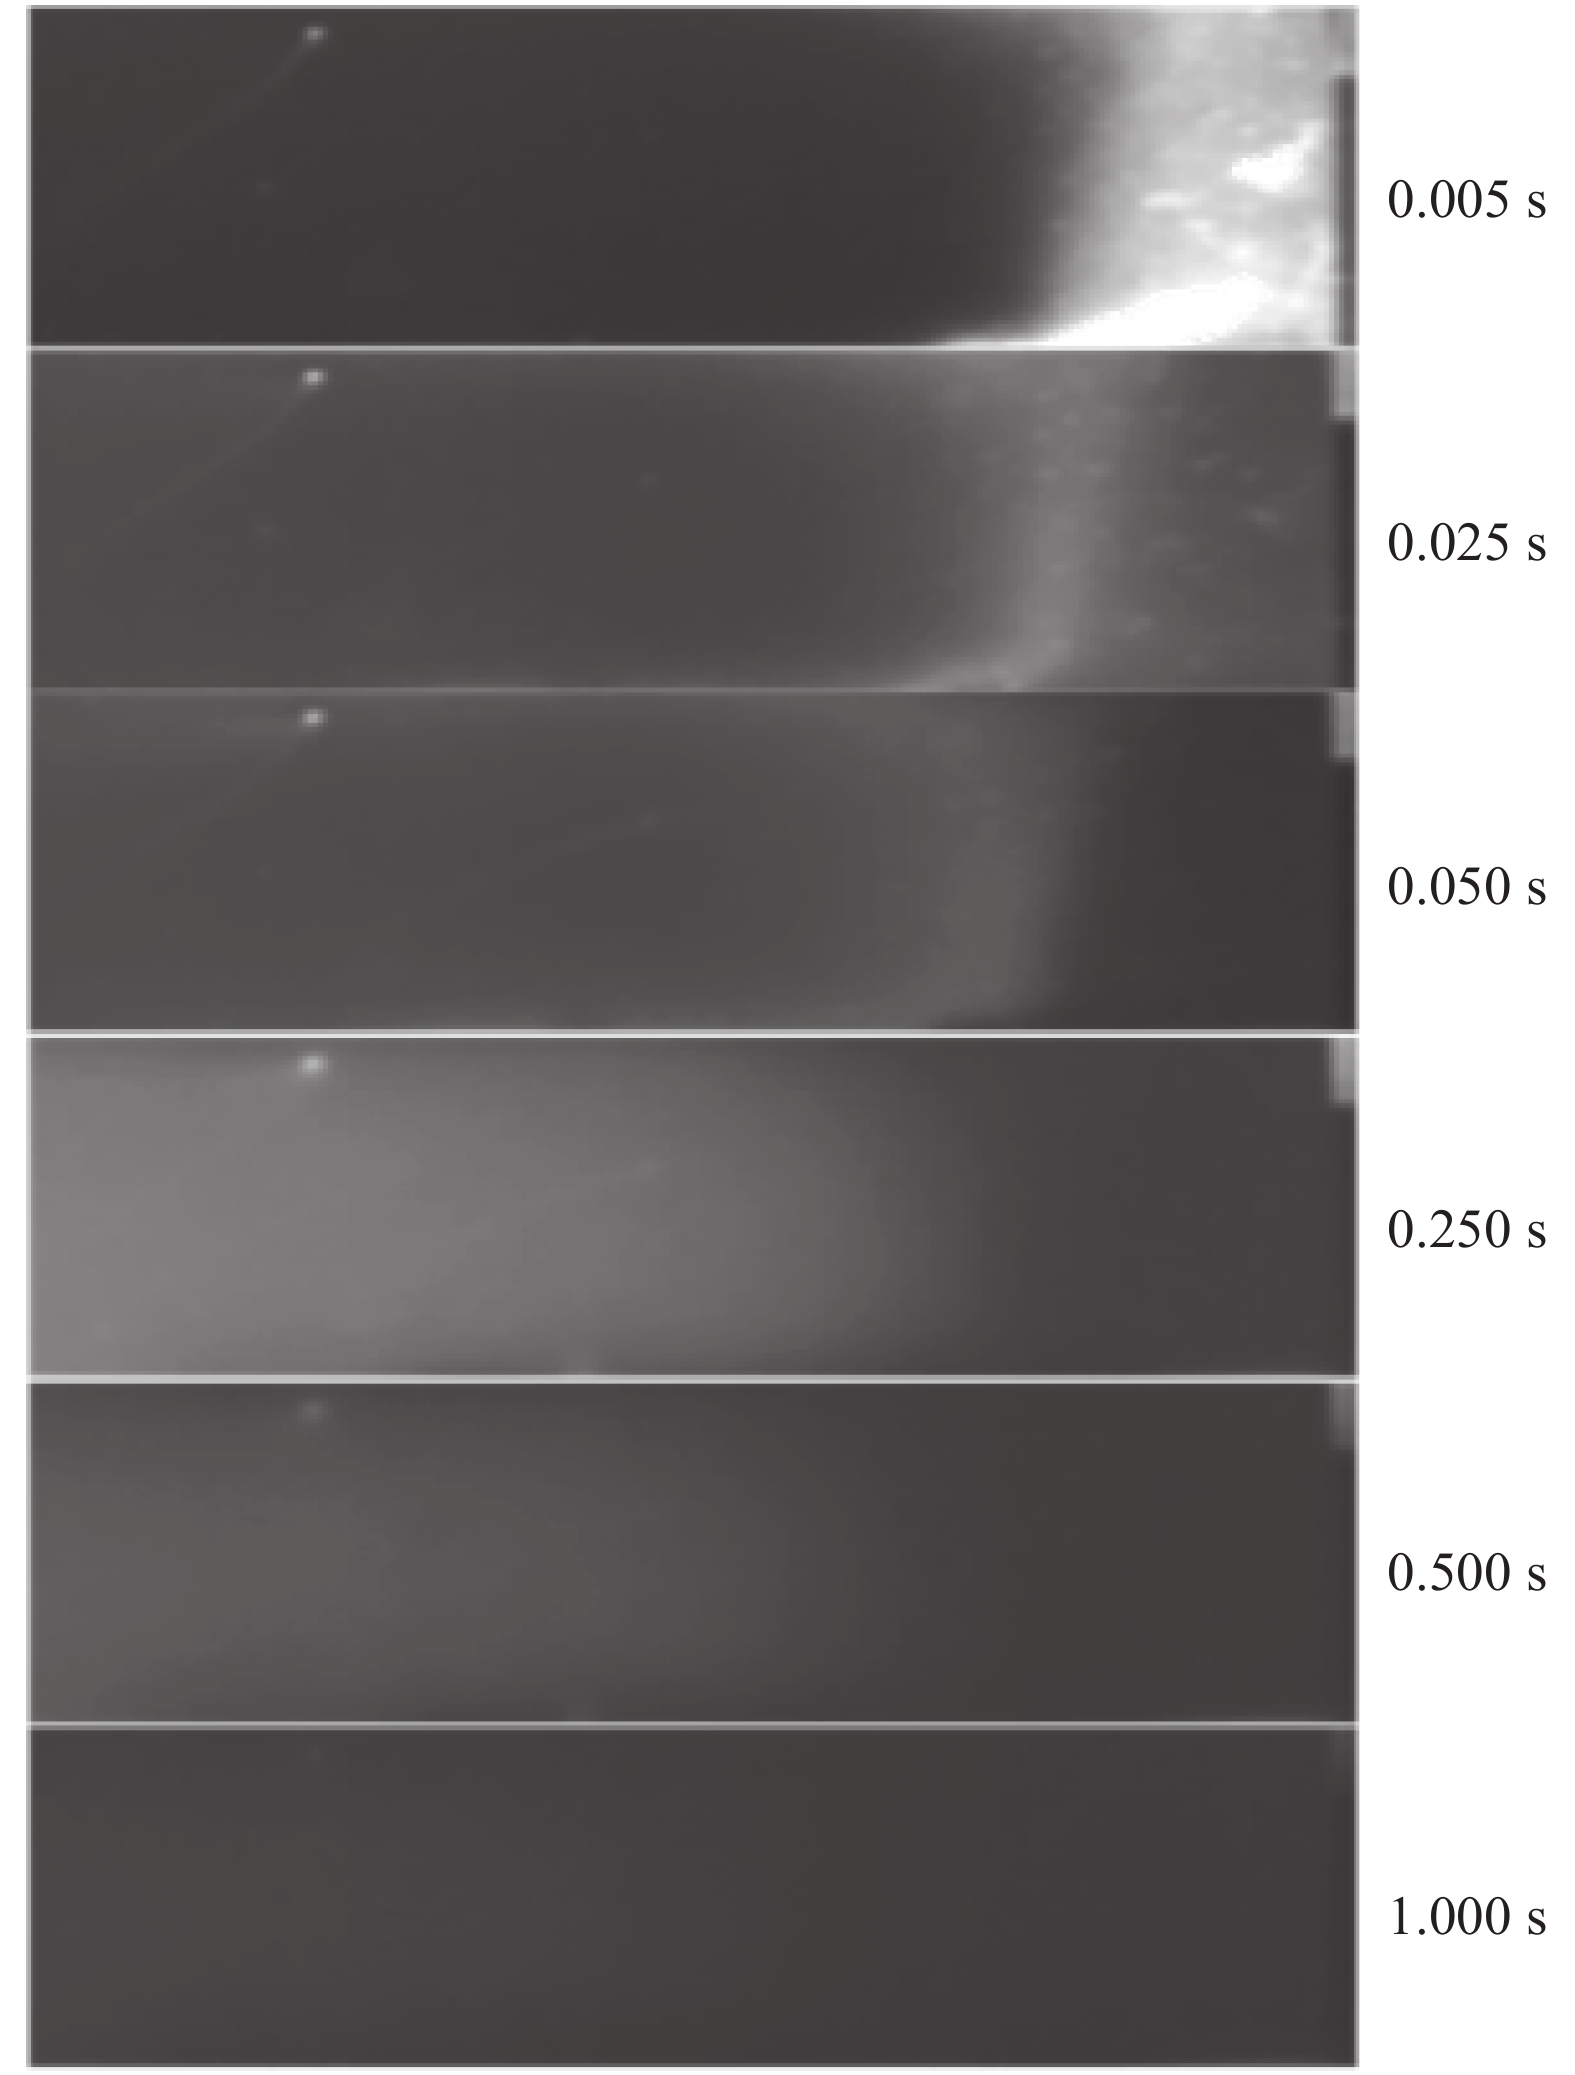
为了提升脉冲能量的均匀性,使用两个U型闪光灯管作为激励热源,闪光灯能量为9.6 kJ,脉宽为3 ms。在U型闪光灯管前方放置磨砂毛玻璃片,进一步匀化脉冲激励能量。使用非制冷热像仪(Flir A655 sc)采集试件表面温度,其等效噪声温差(NETD)为30 mK,图像分辨率为640×120,采集帧频为200 Hz。计算机控制闪光灯电源及同步触发器,在红外热像仪单帧图像采集结束后,电源驱动闪光灯对样品表面进行加热。红外热像仪采集样品表面温度信息,并将其传输回计算机进行数据处理分析。选取部分热成像序列如图9所示。
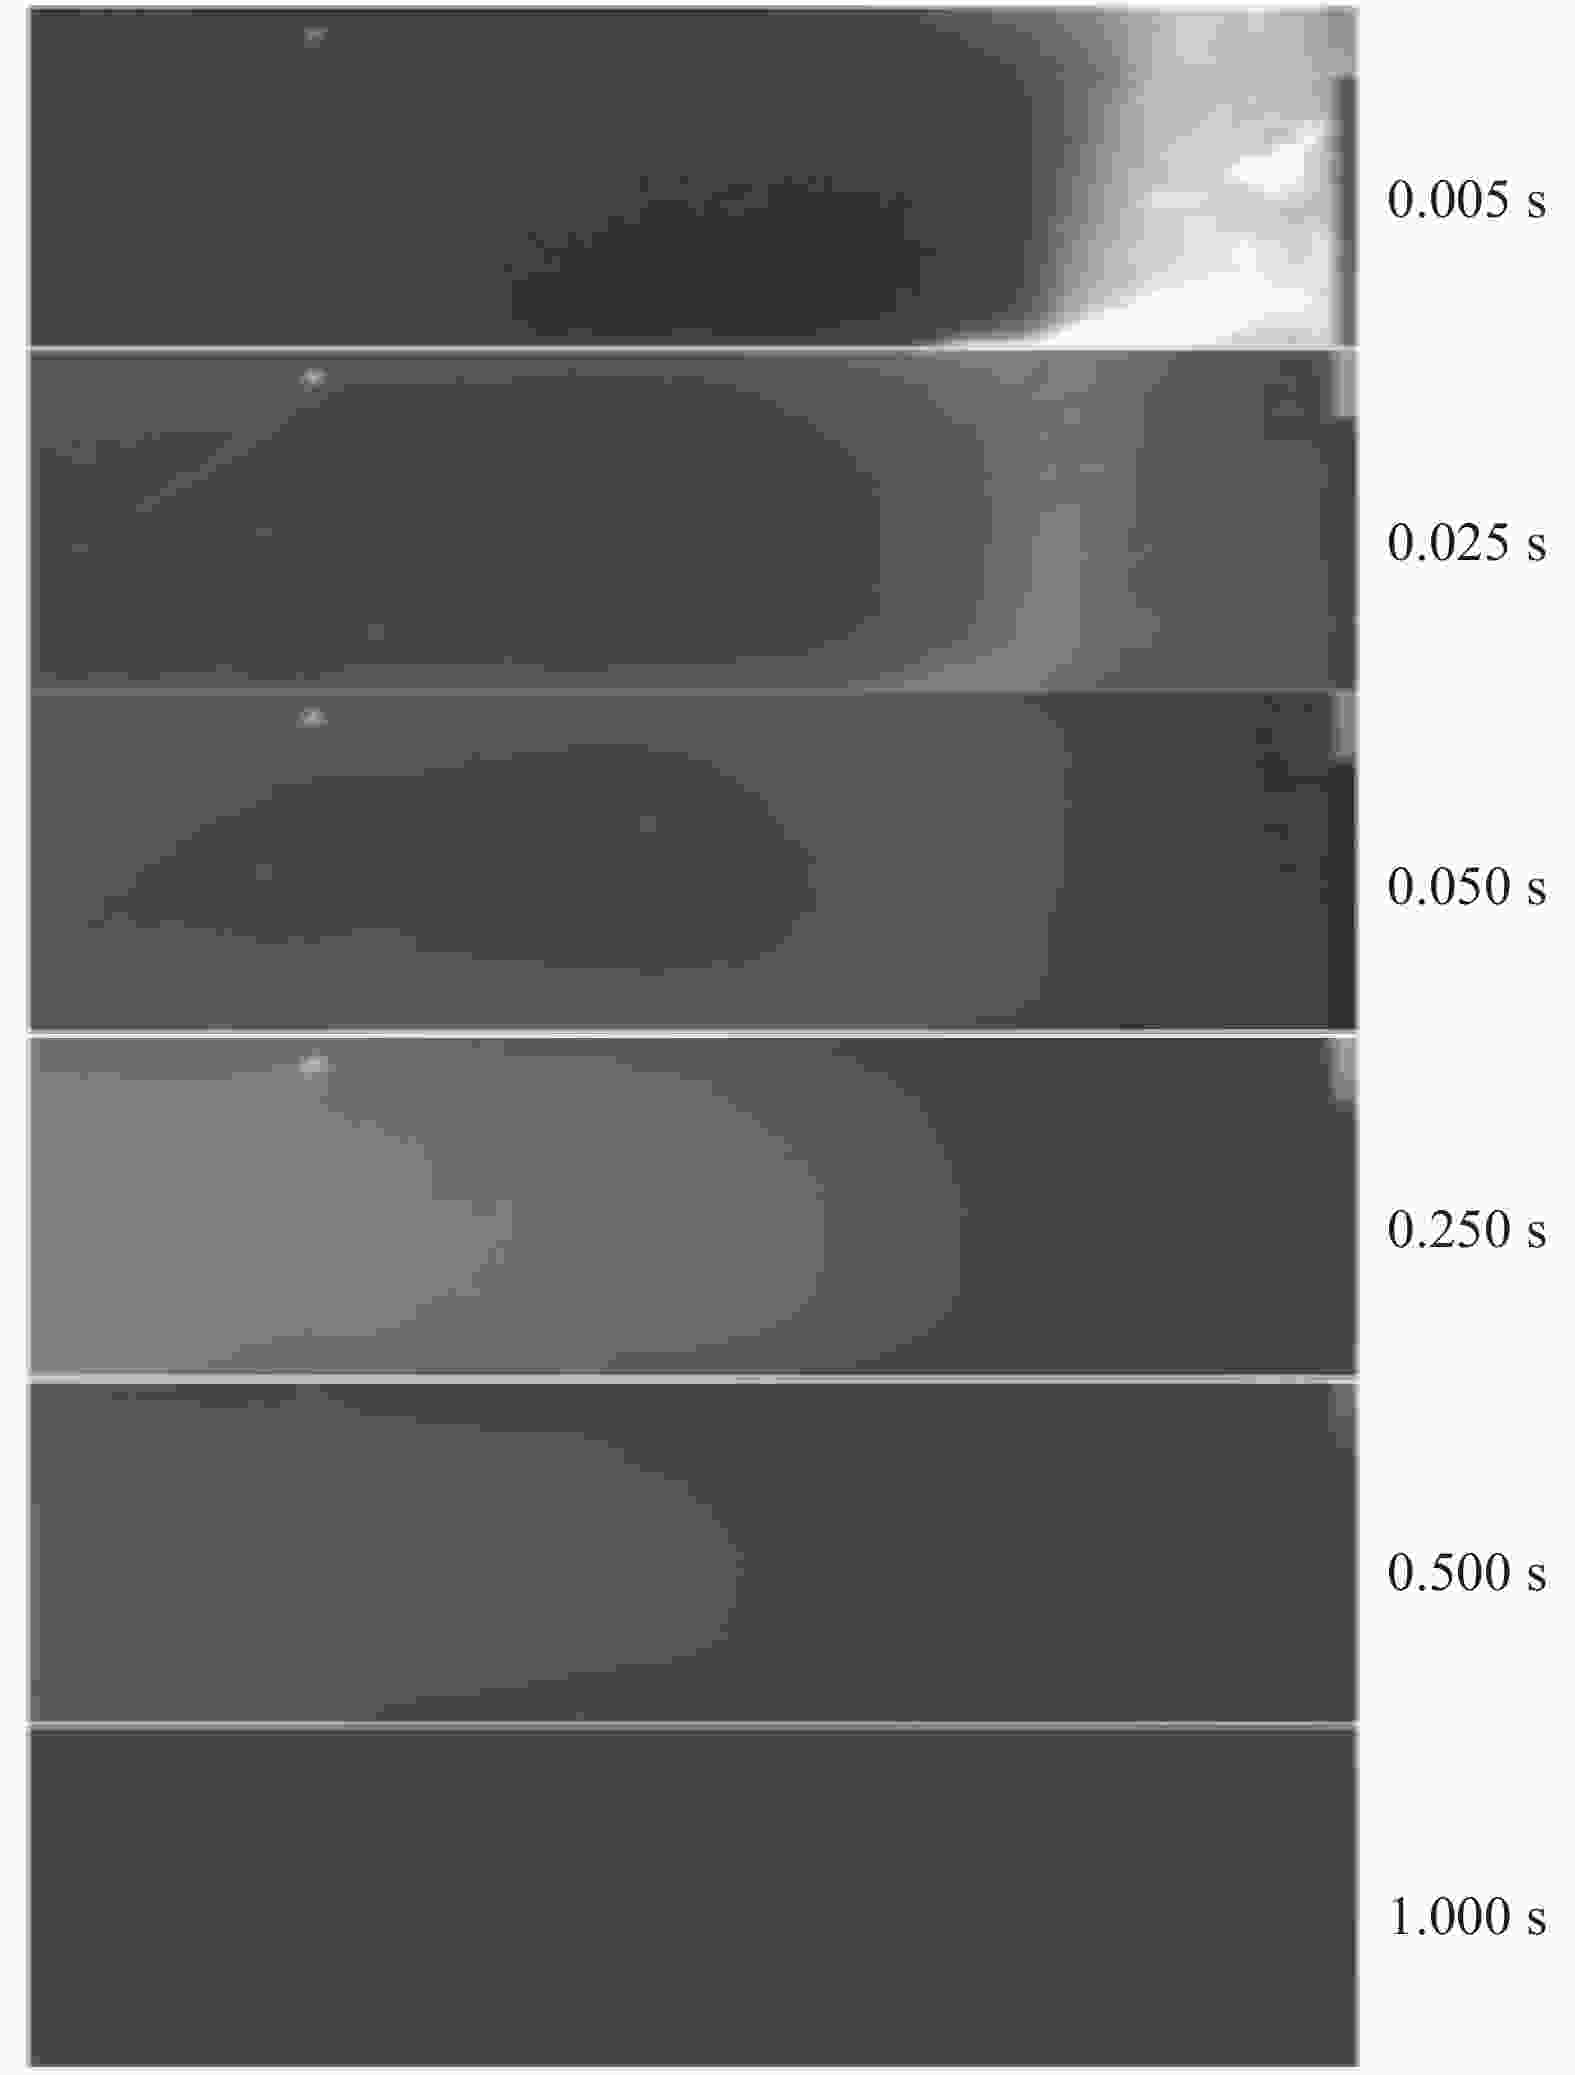
Figure 9. Selected frames from the IR image sequence
图10为在对数坐标中绘制了不同涂层厚度的表面温度与时间的关系及拟合曲线。结果表明,不同涂层厚度下的表面温度变化趋势与模拟结果基本一致。表面温度的对数峰值时刻与涂层厚度之间存在单调关系。

Figure 10. Experimental surface temperature of samples with different coating thickness vs time in double logarithm scale
实验结果与理论结果的数据差异在于:实验结果中的表面温度峰值时刻与涂层厚度在对数坐标上的线性关系存在误差。造成该现象的主要原因有以下方面:(1)热像仪帧频导致温度数据丢失,对于较薄涂层,表面温度的峰值出现的较早,温度上升较快。热像仪采集到的表面温度峰值时刻存在误差,曲线拟合在一定程度上降低了表面温度峰值时刻的误差。(2)数值计算中将半透明涂层样品简化成一维热传导模型,其材料均匀各向同性,但实验上的样品厚度连续变化,不如理论样品理想。(3)理论计算中涂层表面均匀加热,实验时闪光灯能量的分布并不如理论理想。
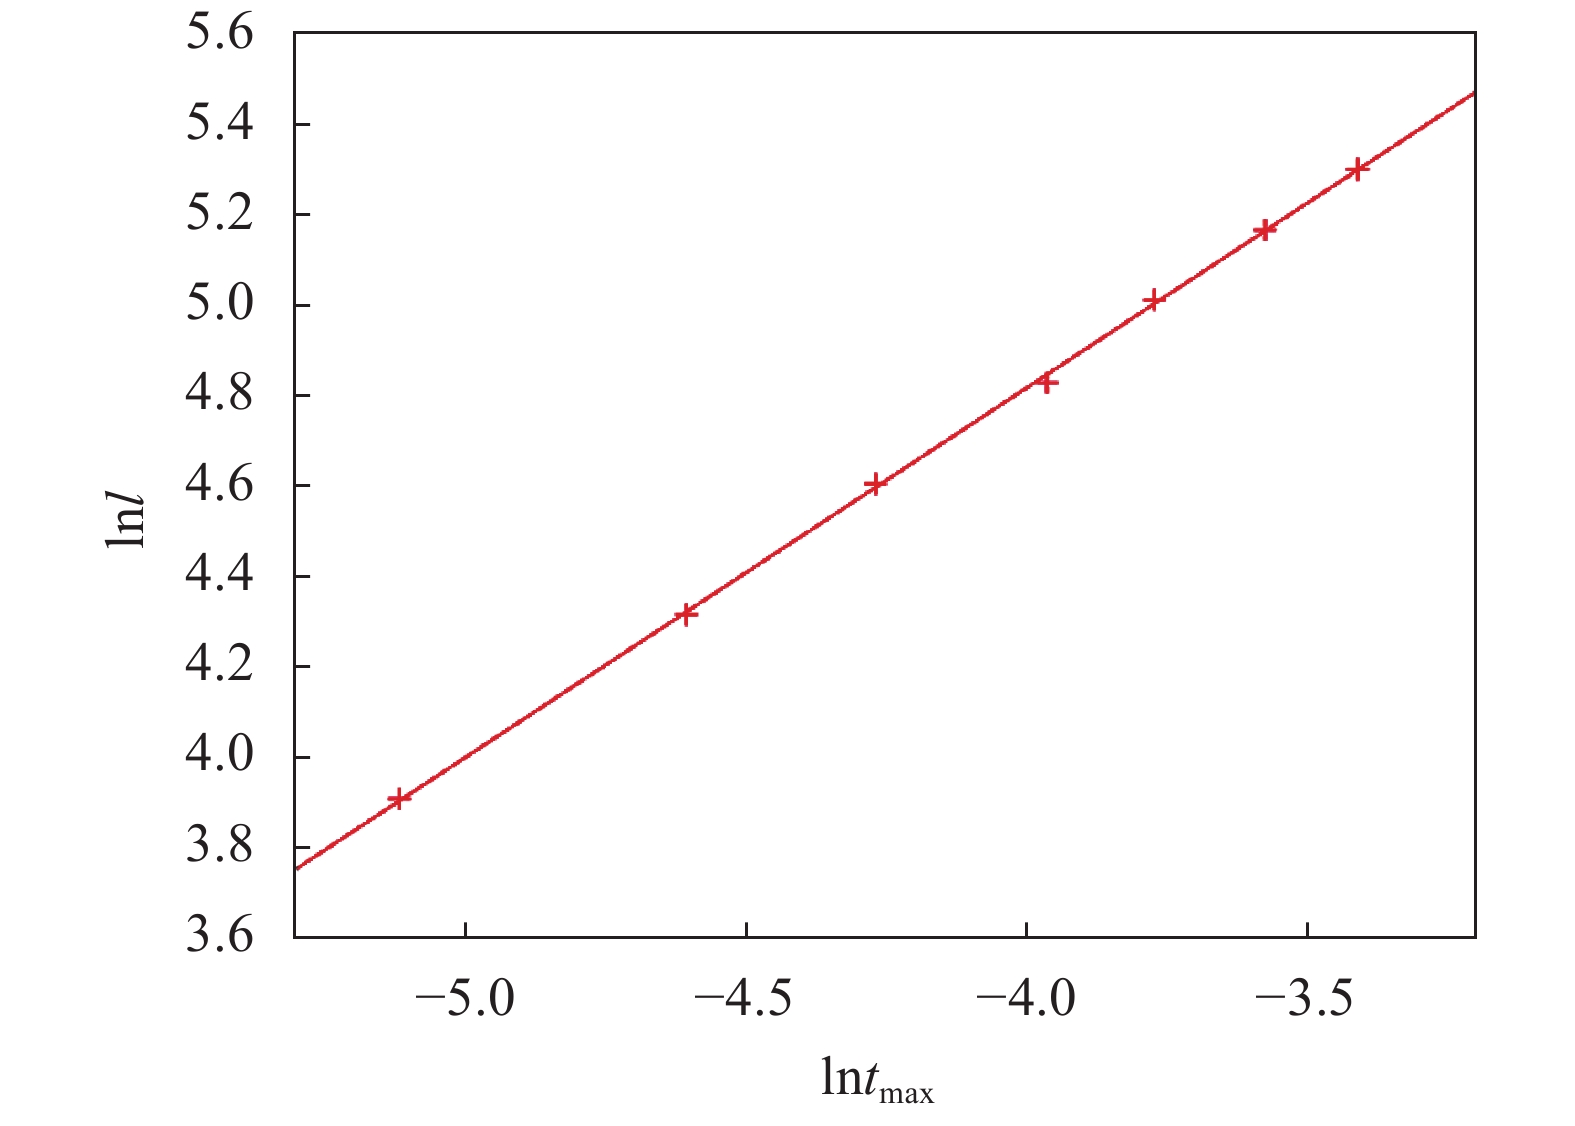
在对数坐标中,表面温度的峰值时刻与涂层厚度之间的关系曲线如图11所示。可以看出,它们之间存在线性关系,与图7所示的模拟结果一致,这些数据点与拟合直线的偏差在5%以内。

Figure 11. Thickness vs experimental peak time in double logarithm scale
同一样本在另外四个区域取样。根据图11的校准曲线计算涂层厚度,结果如表2所示,厚度误差在5%范围内。
Thickness by
micrometer/
μmThickness by
thermography/
μmDifference 1 103 99.7 3.3% 2 136 139.2 2.3% 3 158 160.6 1.6% 4 197 189.4 4.0% Table 2. Measurement result of coating thickness
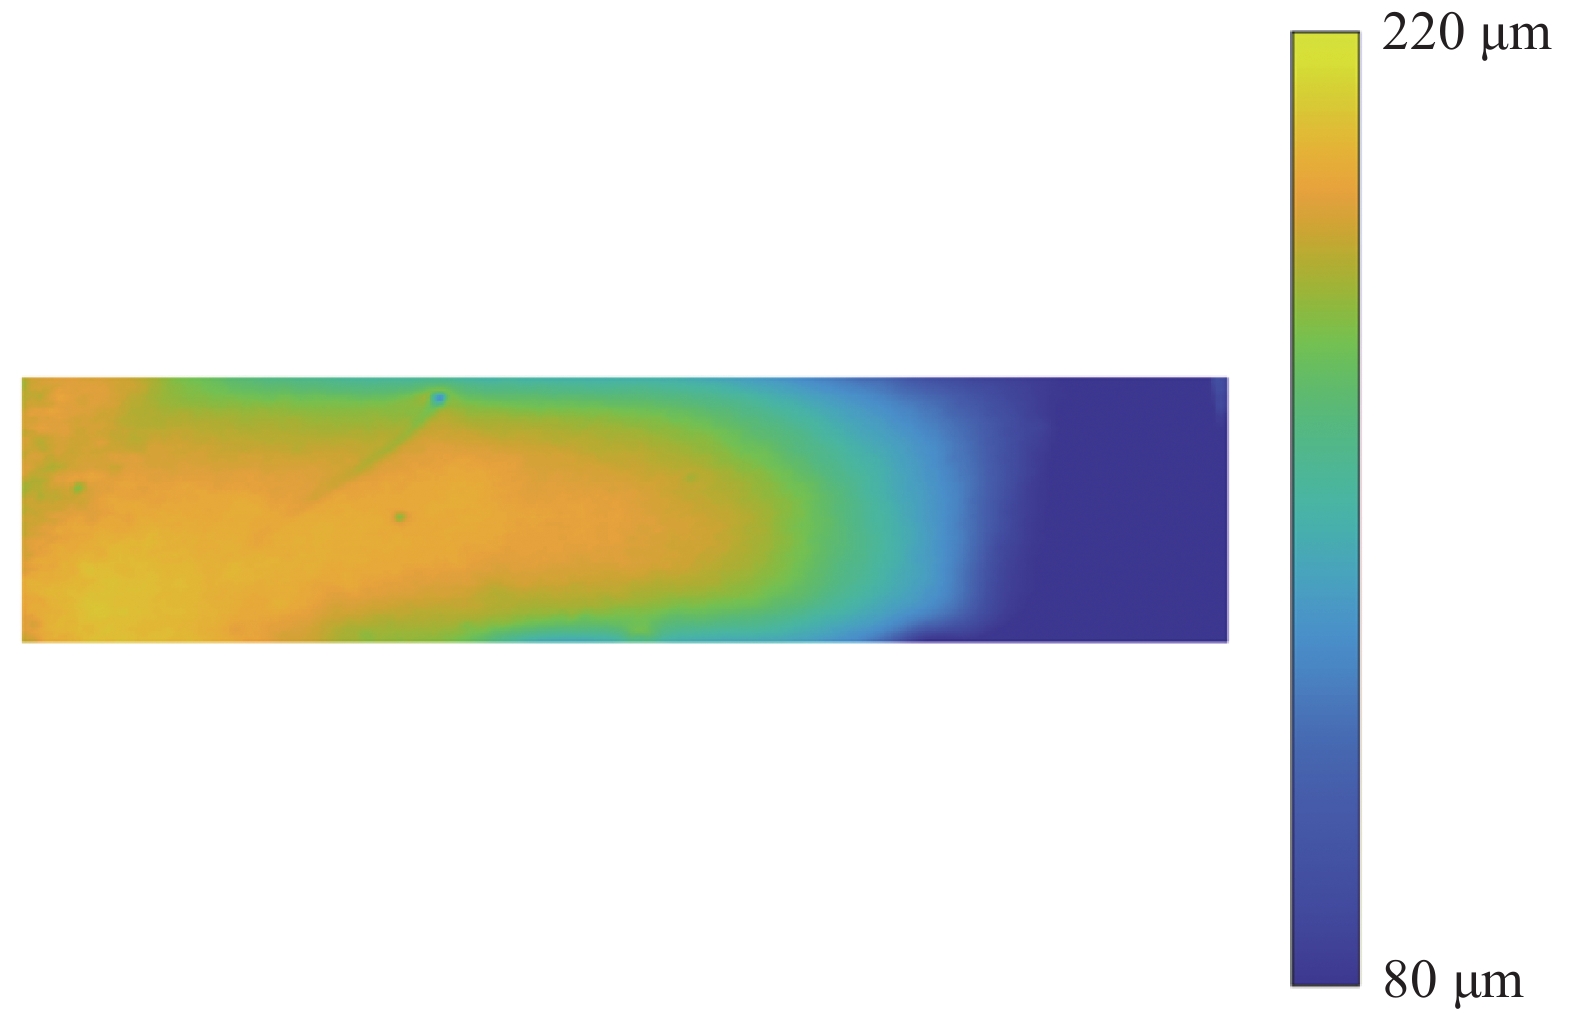
图12为试件厚度分布的图像。厚度从右侧较薄的一侧逐渐过渡为左侧较厚的一侧。由于红外热像仪帧频和闪光灯能量强度的限制,检测区域仅包括试样的右半部分,涂层厚度在80~220 µm之间。

Figure 12. Test result of thickness distribution of the specimen
-
文中建立了半透明涂层半无限大脉冲热传导简化理论模型,推导出半透明涂层表面温度场表达式。建立了半透明涂层的脉冲红外加热双层物理模型,分析了半透明涂层的脉冲红外加热表面温度场。证明了对于中等吸收系数和较薄的涂层,涂层厚度与表面温度的峰值时刻在对数坐标上存在线性关系,这为脉冲热成像技术测量半透明涂层厚度提供了理论依据。
利用脉冲热成像技术对制备的厚度连续变化的半透明涂层试件进行了测试。检测结果与模拟结果吻合较好,实测厚度与实际厚度相差在5%以内,在一定程度上提高了直接进行半透明涂层厚度检测的精度。与常规脉冲红外热成像对于半透明涂层厚度检测相比,不再需要在样品表面喷涂黑漆或黑色石墨胶体,有利于在工业中直接对半透明涂层厚度进行检测。
Measurement of translucent coating thickness based on pulsed thermography
doi: 10.3788/IRLA20210890
- Received Date: 2021-11-24
- Rev Recd Date: 2022-01-29
- Available Online: 2022-03-04
- Publish Date: 2022-02-28
-
Key words:
- pulsed thermography /
- coating thickness measurement /
- finite element simulation /
- translucent coating
Abstract: To measure the thickness of translucent coating quickly and accurately, the method based on pulse thermography was proposed. A simplified theoretical semi-infinite model of pulsed infrared heating conduction for translucent coating and a two-layer physical model of pulsed infrared heating for translucent coatings were established. The theoretical analysis and numerical results show that the thickness of the translucent coating is linearly proportional to the peak time of the surface temperature in logarithmic coordinates, through which the thickness of the translucent coating can be derived without spraying black ink on the surface of the sample to avoid the effect of translucency. A translucent coating specimen with continuously varying thickness was fabricated and tested with a flash thermographic system. The result of the measured thicknesses is within 5% of the actual values. It demonstrates that the technique has the potential for fast and non-contact measurement of the thickness for translucent coatings.


 DownLoad: