


-
因为多模光纤可能用作内窥镜使用,近年来透过多模光纤成像引起了人们的兴趣[1–3]。和梯度折射率透镜、光纤束[4]相比,多模光纤的直径更小,在生物成像中能够减小对生物组织的损伤[5]。但由于多模光纤的传输特性难以预测,成像时通常将多模光纤视为散射介质。
多模光纤成像时,物体位于光纤的远端,相机位于光纤的近端。物体发出的光从光纤的远端进入光纤,并从近端射出。为了计算光纤远端的光场,需要事先标定光纤的传输矩阵,并测得近端光场。传统测量近端光场的方法是引入一束参考光与近端光场发生干涉。但干涉方法光路复杂,且对系统稳定性要求较高,实验上不容易实现。为了避免干涉光路带来的困难,研究人员探索了一系列无参考光的方法,如相位恢复方法、复数光强逆传输矩阵[6]、实数光强传输矩阵方法[7]。其中相位恢复算法近年来快速发展,出现了一批新的相位恢复算法[8-9]。相位恢复算法可以分为凸优化与非凸优化两类。相位恢复问题是一个非凸优化问题,但可以用凸松弛将问题化为凸优化问题,常见的凸优化方法有PhaseLift[10]、PhaseMax[11]等。凸优化的运行效率往往较低,因此通常只用于理论分析,实际中更多使用的是非凸优化算法。现有非凸优化算法主要有Wirtinger流方法[12]、交替最小化方法[13]、贝叶斯方法[14-15]以及这些方法的一系列变体。相位恢复在光学成像中有着许多应用[16]。贝叶斯方法、交替最小化方法、半定规划方法、扩展Kalman滤波方法等算法已经被用于散射介质成像[17–20]和多模光纤成像[21-22]中。
对于多模光纤成像的情况,光纤的传输矩阵相当于相位恢复算法中的测量矩阵。现有算法多数假设观测矩阵的元素是高斯分布的独立随机变量,但实际情况并不总能符合假设,因此也出现了一些对更宽泛条件下相位恢复算法效果的研究。如Shlezinger等人从信息论的角度出发,以测量结果和未知信号间的互信息为标准评价测量矩阵,不再考虑测量矩阵的统计分布,而直接以互信息最大化为目标设计传输矩阵[23]。Gao等人提出了交替最小化方法在亚高斯分布条件下的修改版本,并分析了算法的收敛情况[24]。在进行相位恢复时,首先需要对光强的空间分布进行采样。相机采样面上不同采样点对应着传输矩阵的不同行,选择不同的采样点,相当于从一个大传输矩阵中抽取一部分行重新组成小传输矩阵。由于相位恢复算法的效果与传输矩阵有关,恰当地选择采样点间隔和数量,可以使相位恢复算法效果更好。文中研究了不同采样间隔下相位恢复算法的效果,得到了采样间隔与重建结果的关系。实验结果表明,为了减少采样点数量,提高相位恢复计算速度,采样间隔应大于散斑大小。
-
光在多模光纤中的传播由光纤的传输矩阵描述。光纤的远端作为输入端,光纤的近端作为输出端,如图1所示。只考虑一个偏振方向,经过空间离散化后,输入端和输出端光场可以用矢量
$ {\boldsymbol{E}}^{\mathrm{i}\mathrm{n}},{\boldsymbol{E}}^{\mathrm{o}\mathrm{u}\mathrm{t}} $ 表示。设光纤的传输矩阵为$ \boldsymbol{A} $ ,则输入光场和输出光场的关系如下:
Figure 1. Propagation of light in multimode fiber
位于光纤输出端的相机只能探测到光强,设探测到的光强为
$ {I}_{m} $ ,${{\boldsymbol{A}}}_{mn}$ 为传输矩阵的元素,下标表示相机上不同位置的像素,光强与输入端光场的关系为:在已知输出端光强和传输矩阵的情况下,可以使用相位恢复算法求解以上方程,计算出输入端光场。文中中使用的算法是相位恢复变分贝叶斯期望最大化算法[15](Phase Recovery Variational Bayes Expectation-Maximization, prVBEM),并使用谱初始化方法进行初始化[12-13]。
相机上每一个像素都对应一个
$ {I}_{m} $ ,也对应方程组中的一个方程。方程组的方程达到一定数量时,就足以正确地解出输入光场${{\boldsymbol{E}}}_{n}^{\mathrm{i}\mathrm{n}}$ ,方程数量过多则可能消耗不必要的计算资源。因此可以对光强进行适当的下采样,只使用其中一部分像素的光强。文中只考虑均匀采样的情况,测试采样方案主要由采样间隔决定。采样点的位置如下式:式中:
$ {n}_{1},{n}_{2} $ 为整数;$ {\boldsymbol{e}}_{1},{\boldsymbol{e}}_{2} $ 为固定的两个向量。图2中展示了选择不同的$ {\boldsymbol{e}}_{1},{\boldsymbol{e}}_{2} $ 时采样点的分布情况。
Figure 2. Schematics of different sampling manners, the arrows in the figure represent the directions of the vectors
$ {\boldsymbol{e}}_{1},{\boldsymbol{e}}_{2} $ . (a) Sampling interval is$ \sqrt{{1}^{2}+{3}^{2}}=3.16 $ pixel,$ {\boldsymbol{e}}_{1} $ =(3,1),$ {\boldsymbol{e}}_{2} $ = (−1,3); (b) Sampling interval is 3 pixel,$ {\boldsymbol{e}}_{1} $ =(3,0),$ {\boldsymbol{e}}_{2} $ =(0,3)实验装置如图3所示。光束从532 nm激光器(长春新产业,MSL-FN-532-100 mW)出射经过扩束镜L1(大恒光电,GCO-140113)扩大后被用于照明。照明光束被DMD (Texas Instruments,DLP LightCrafter Display 2000, 640 × 360 pixel,像素尺寸7.56 μm)反射,然后通过200 mm焦距凸透镜TL1和显微物镜OL1(Olympus Plan N 10×)耦合进入多模光纤MMF(大恒光电,DH-FMM105-FC-1 A,长度1 m,纤芯直径105 μm,0.1 NA)中。TL1和OL1将DMD上的图案成像在光纤的端面上。光在光纤中传播一段距离后从另一端射出,显微物镜OL2 (Olympus Plan N 20×)和镜头TL2(Nikon NIKKOR 80~200 mm,对焦距离调为无穷远,焦距调为200 mm)组成的成像系统将光纤端面放大后成像在相机感光面(pco.edge 4.2 Camera Link,像素阵列2 048×2 048,像素尺寸6.5 µm×6.5 µm)上。在TL2与OL2之间插入了偏振片P1,使相机只接收一个偏振方向的光场。根据参考文献[25]中描述的方法对DLP LightCrafter Display 2000模块进行了简单改装,拆除了原有的照明模块,只保留其中的DMD芯片。将3×3个DMD像素组成1个大像素,选择DMD上大小为28×28=784个大像素的区域用于显示输入图像。重建图像使用的CPU为Intel Core i7-6700。算法用matlab实现,prVBEM算法采用了参考文献[15]的作者所公布的代码。

Figure 3. Schematic of experimental setup and the photograph of the experiment platform
-
成像前需要事先标定光纤传输矩阵,标定传输矩阵也使用相位恢复算法。标定时,首先测得一系列不同输入图像
${{\boldsymbol{E}}}_{nk}^{{\rm{in}}}$ 对应的输出光强${{{I}}}_{mk}^{{\rm{out}}}$ ,设光纤的传输矩阵的元素是${{\boldsymbol{A}}}_{mn}$ ,下标n,m表示不同像素,下标k表示的是不同的输入图像,则有:已知
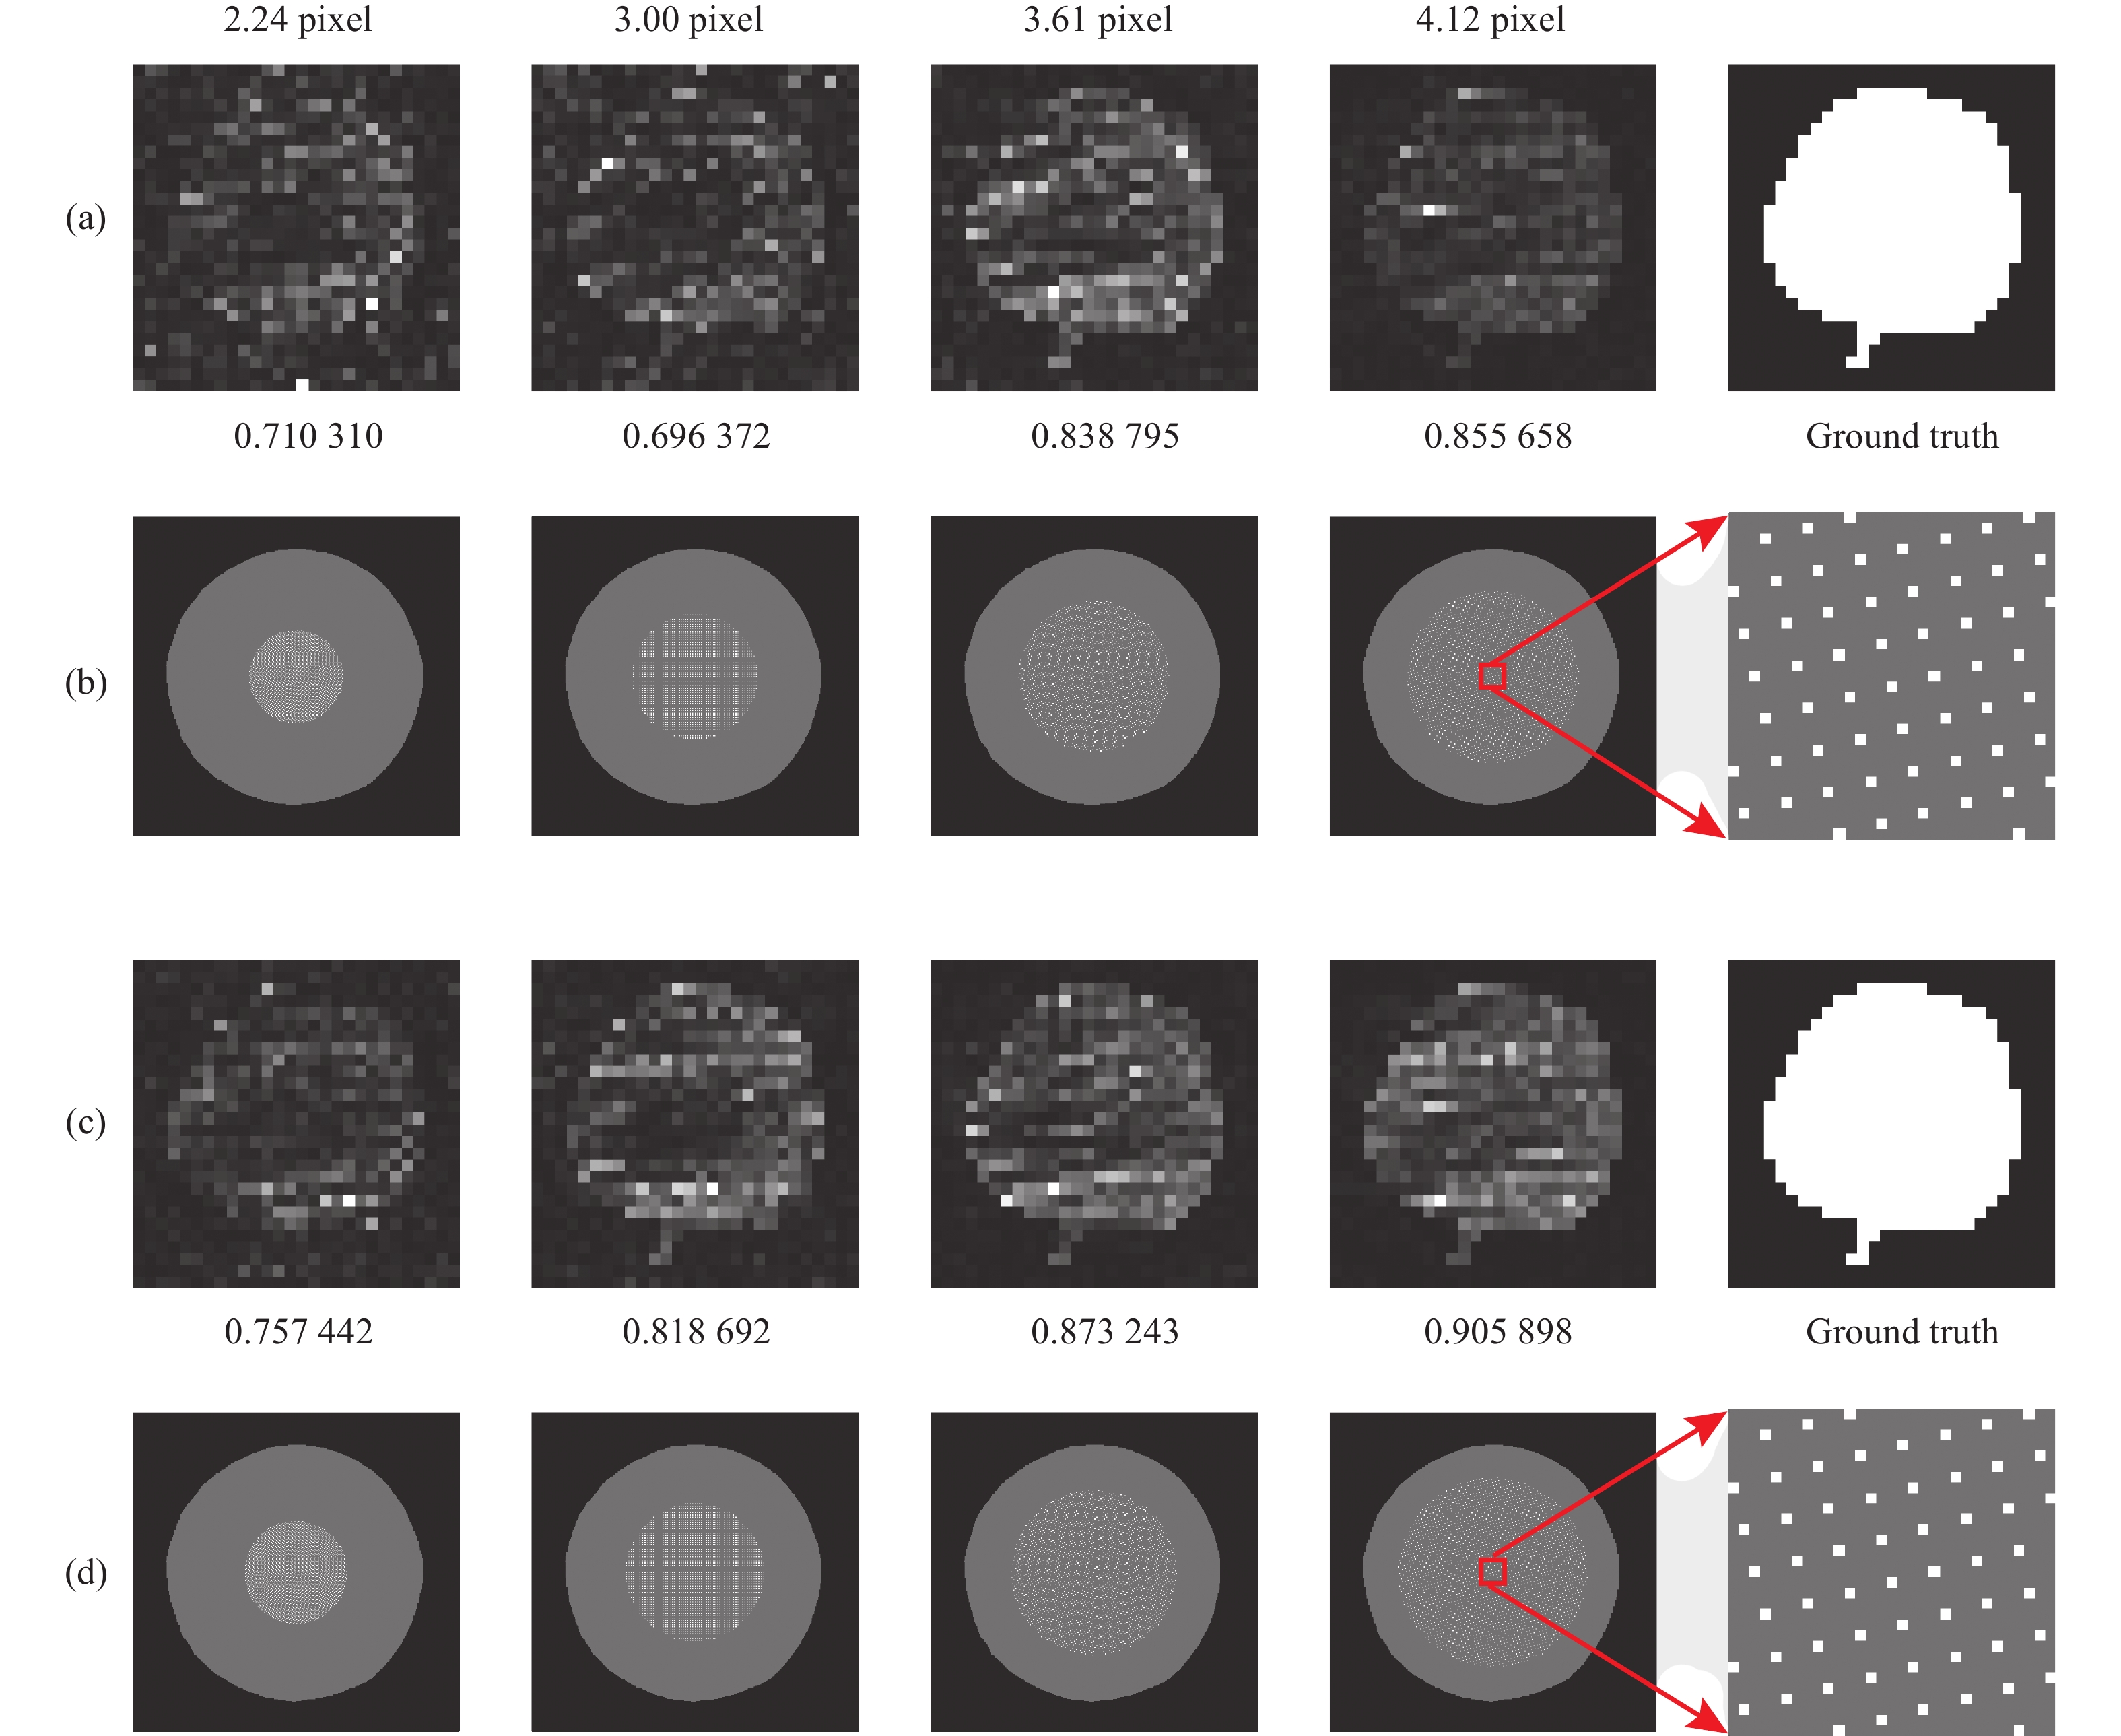
$ {{\boldsymbol{E}}}_{nk}^{{\rm{in}}} $ 和${{{I}}}_{mk}^{{\rm{out}}}$ ,此时将传输矩阵${{\boldsymbol{A}}}_{mn}$ 的某行(例如${{\boldsymbol{A}}}_{1 n}$ )视为未知数,则可以用相位恢复算法从方程组得到传输矩阵的一行,逐行运行相位恢复算法可以得到完整的传输矩阵。完成传输矩阵的标定后进行图像重建的实验, 不同采样间隔的重建效果如图4所示。不同的采样间隔对应着不同的${\boldsymbol{e}}_{1}\mathrm{、}{\boldsymbol{e}}_{2}$ ,间隔2.24 pixel时的$ {\boldsymbol{e}}_{1}\mathrm{、}{\boldsymbol{e}}_{2} $ 为$ \left(\mathrm{2,1}\right)\mathrm{和}(-\mathrm{1,2}) $ , 3.0、3.61、4.12 pixel时的$ {\boldsymbol{e}}_{1}\mathrm{、}{\boldsymbol{e}}_{2} $ 为$ \left(\mathrm{3,0}\right)\mathrm{和}\left(\mathrm{0,3}\right) $ ,$ \left(\mathrm{3,2}\right)\mathrm{和}(-\mathrm{2,3}) $ ,$ \left(\mathrm{4,1}\right)\mathrm{和}(-\mathrm{1,4}) $ 。可以看到,在采样点数不变的情况下,随着采样间隔增大,恢复结果逐渐变得更接近真实图像。图4中使用了余弦相似度定量描述图像重建的效果,假设真实图像为${{{I}}}_{m}$ ,重建图像为${{{I}}}_{m}^{\text{'}}$ ,下标m表示不同像素,则余弦相似度的定义如下:
Figure 4. Results at different sampling intervals. (a), (b) Reconstruction results and the position distribution of sampling points when the number of sampling points is 2 400; (c), (d) Reconstruction results and the position distribution of sampling points when the number of sampling points is 2 900; Value below (a) and (c) is the cosine similarity between the reconstruction results to the ground truth; Grey area in (b) and (d) is the intensity envelope region, and the white dots are the sampling points. Zoomed-in view of the distribution of points in the red box is shown on the right
重建过程使用的采样点数越少,则需要的时间和空间通常越少,标定过程也更简单。为了确定不同采样方案需要的采样点数,需要得出图像重建效果与各个条件的关系。从MNIST数据集中选择10张图像,在不同条件下重建图像,并计算10张图像的重建结果与真实图像的余弦相似度的平均值。结果如图5(a)所示,可以看到相似度随着采样点数提高而增加。由于光纤截面的像素数量有限,总采样点数不能无限增加,所以采样间隔较大时采样点数只能在一个小范围内变化。将重建图像与真实图像的平均相似度达到0.95定义为恢复成功,使用光滑样条对图中曲线进行插值,可求出不同采样间隔下成功恢复所需要的采样点数。从图5(b)中可以看到,随着采样间隔的增大,需要的采样点数首先快速下降,之后趋于稳定。在采样间隔为5.39时需要的采样点数取得最小值2 709,约为输入图像像素数量的3.5倍。采样点数量受到光纤截面面积的限制,采样间隔越大则采样点数量上限越低。如图4、图5(c)所示,还可以看到,虽然采样间隔大时需要的采样点数较少,但是采样区域的面积依然逐渐增大。

Figure 5. (a) Similarity versus number of sampling points at different sampling intervals; (b) Variation of minimum number of sampling versus sampling interval under the same image quality, the dashed line represents the upper bound of the number of sampling points; (c) Variation of minimum sampling area versus sampling interval, the dashed line represents the area of the fiber
从理论上对所需采样点数的变化进行解释,相位恢复算法通常要求传输矩阵的不同行是独立同分布的高斯型随机变量。采样间隔较小时,独立性比较差。随着采样间隔的提高,传输矩阵的不同行变得更接近独立,因此相同采样数情况下的恢复效果变好。不同行变为统计独立后,继续增加采样间隔不再有明显效果。
光纤输出端光强的散斑大小是不同位置的光强相关性的一个直观衡量,可以借助散斑大小判断传输矩阵不同行间的统计独立程度。任选一张光纤输出端光强的图像,取中心一个30×30 pixel大小的区域的光强,平移这个区域,计算它与周围其他区域的光强的相关性,得到相关性与平均距离的关系。使用函数
$y= A \cdot \mathrm{e}\mathrm{x}\mathrm{p}\left(-\dfrac{{x}^{2}}{{b}^{2}}\right)+c$ 对实验数据进行拟合,得到的参数$ b $ 可以被视为散斑的大小,计算结果如图6所示。拟合使用了matlab中的fit函数,通过Trust-Region算法求解非线性最小二乘问题。从实验拟合数据可以得出参数$ b $ 为3.79 pixel。与图5图4相互印证,参数$ b $ 可用于判断采样间隔的适当大小。当采样间隔大于$ b $ 时,最少采样点数的变化趋于平缓。
Figure 6. Correlation with spatial displacement
实际应用中关心的另一个重要因素是算法消耗的时间,而采样点数少并不等同于消耗的时间更少。相位恢复算法一轮迭代的时间随着采样点数量增加而增加,但算法收敛需要的迭代次数可能随采样点数量增加而减少,因此最终消耗的时间并不随采样点数量增加而单调变化。图7(a)中画出了重建图像与真实图像的相似度大于0.9的情况下算法消耗的时间。当采样间隔较小时,可以看到消耗的时间是先减小后增大的。可以预计,如果采样间隔较大时采样点数量也足够多,也应该存在一个最小值,只是由于采样点数量不足,目前无法下降到最小值。在采样间隔固定的情况下,可以找出相位恢复所需要的最短时间。从图7(b)中可以看到,在采样间隔较小时,最少时间随着采样间隔增大而变少。当采样间隔较大时,由于采样点不足,消耗的时间无法下降到应有的最小值,于是消耗的最短时间又会上升。从图7(a)中的趋势可以预测,如果采样点数量足够,则最短计算时间会趋于稳定。以本文的实验结构为例,如果以计算时间短为目标,则应该令采样间隔小于5 pixel,保证采样点数量足够的同时使采样间隔大于散斑大小。

Figure 7. (a) Total elapsed time versus sampling points at different sampling intervals; (b) Variation of minimum time with sampling interval
-
通过实验测定了光纤的传输矩阵,利用相位恢复算法在不同采样间隔下成功重建输入图像。研究了图像重建结果随采样间隔变化的情况,当采样间隔小于散斑大小时,光场重建所需的采样点数量随着采样间隔的增大而明显下降。当采样间隔足够大时,所需的采样点数量几乎不再变化,并最终约为输入图像像素数量的3.5倍。如果以采样点数少为目标,则应该使采样间隔大于光斑大小。采样间隔固定,随着采样点数的增加,相位恢复算法消耗的时间先减小后增大,如果以计算时间短为目标,则应该避免采样间隔过大导致采样点数量不足。未来可以建立传输矩阵恢复效果的直接评价指标,从评价指标出发找出最佳的采样点位置分布,而不再局限于均匀采样方案。
Effect of sampling methods on distal field reconstruction through a multimode fiber (invited)
doi: 10.3788/IRLA20220072
- Received Date: 2022-01-26
- Rev Recd Date: 2022-02-21
- Available Online: 2022-08-31
- Publish Date: 2022-08-31
-
Key words:
- scattering medium imaging /
- multimode fiber /
- phase retrieval
Abstract: The phase retrieval algorithms can be used to recover the field at the distal end of a fiber from the intensity at the proximal end of the fiber. The response of the fiber can be described by the transmission matrix. In the experiment, a sufficient number of samples are sampled from the output intensity distribution with different input conditions to measure the transmission matrix. Obviously, the position distribution of sampling points, including the sampling number and interval, affects the measurement of the transmission matrix, and the accuracy and efficiency of the phase retrieval algorithm are related to the transmission matrix. We propose that the sampling interval should be greater than the speckle size to ensure the independence of different rows of the transmission matrix; therefore, image quality can be guaranteed with fewer sampling points at higher reconstruction efficiency. The experimental results show that when the sampling interval is less than the speckle size, the number of sampling points required for light field reconstruction decreases significantly with increasing sampling interval under the same image reconstruction quality. When the sampling interval is greater than the speckle size, the number of sampling points required changes slowly and finally remains approximately 3.5 times the number of pixels of the input image. When the sampling interval is fixed, with the increase in sampling points, the time consumed by the phase retrieval algorithm first decreases and then increases, so there is an optimal sampling interval and sampling points.


 DownLoad: