


-
色差是影响宽光谱工作系统成像质量的重要原因,因此必须对其进行优化设计,消色差的主要工作在于材料选择,不同材料的色散特性存在明显差异,需要寻找适合的组合,使其产生的相反的色散特性最大程度上相互抵消,以达到消色差的目的。
Buchdahl模型是一个用来描述材料折射率的多项式模型。对该模型的研究初始集中于对模型中系数的计算[1-2]以及材料的折射率拟合[3-4],后在研究人员的发展与完善下进一步应用在光学系统设计的消色差材料选择中[5-14]。然而理论计算中,Buchdahl模型消色差应用受限于色散向量比例因子的分母中存在光焦度
${\varphi _0}$ ,导致无焦系统的比例因子成为无穷大的数,而无法直接进行计算。针对上述问题,文中聚焦于Buchdahl模型色散向量分析法在无焦系统下的应用需求,提出了在无焦系统下色散向量比例因子的变形表达,使无焦系统下的色散向量也能合理地呈现在二维向量空间下,以减小和向量这样直观的图解表达指导材料的选择与替换,解决无焦系统设计过程中的消色差问题。 -
色散是折射率相对于波长变化的函数,因此在分析光学材料色散特性时,对折射率进行精确的建模是研究的前提。Buchdahl引入了色散坐标
$\omega $ 这一新的变量,将折射率以更为简便的幂级数形式表示,相比常见的Sellmeier和Schott模型具有收敛速度快的特点[1-3,15]:式中:
$ N $ 为波长$ \lambda $ 的折射率;$ {N_0} $ 为参考波长$ {\lambda _0} $ 下的折射率;$ {\nu _i} $ 为每种材料的独有系数;$ \omega $ 为色散坐标。$ \omega $ 作为波长$\lambda $ 的函数表示为:$\beta $ 的取值是为了使折射率模型快速收敛,通常赋值为$\dfrac{1}{\lambda_0-\lambda^*} $ 。其中,$ {\lambda ^ * } $ 为常数,数值通过大量拟合结果获得。在参考波长$ {\lambda _0} $ 和$\;\beta $ 确定之后,每一个波长下的色散坐标$ \omega $ 就成为定值[1]。对于可见光谱范围,通常取二阶Buchdahl模型。当光谱宽度扩展到近红外波段,三阶也足够获得较高的拟合精度[3]。将公式(1)取三阶,并进行代数变换可得:
其中引入两个变量:色散度
$D\left( \lambda \right)$ 和色散系数${\eta _i}$ ,用以描述材料的色散特性。在三级像差理论中,无穷远平行光入射的薄透镜系统的横向色差可表示为[15]:
式中:
$ u_m' $ 为最后表面近轴光线与光轴的夹角;$ {\varphi _j} $ 为透镜组中第$j$ 片透镜的光焦度;${y_j}$ 为第$j$ 片透镜上的光线高度;$ {V_j} $ 为第$j$ 片透镜的阿贝数。对比
$D\left( \lambda \right)$ 与阿贝数的表达形式,不难发现二者近似呈倒数关系,因此可以用$D\left( \lambda \right)$ 近似替换公式(4)中阿贝数的倒数,在Buchdahl模型与色差之间建立起联系:该结果表征了整个光谱区域上的色差,而不仅仅是两个波长之间的色差。另外,若假设光学系统为有焦密接薄透镜的组合,总光焦度为
${\varphi _0}$ ,入射光线高为${y_1}$ ,${D_0}\left( \lambda \right)$ 表征整个系统的色散特性,则可以近似得到如下的关系:这种近似忽略了透镜元件上光线高度变化引入的色差。将公式(6)整理得到:
引入比例因子
${\alpha _j}$ :将公式(3)和公式(8)代入公式(7)可得:
式中:
${\eta _{i0}}$ 表示等效薄透镜系统第$i$ 阶色散系数之和;${\eta _{ij}}$ 为第$j$ 片透镜的第$i$ 阶色散系数。在任意给定的波长下,$\omega $ 为一确定常数,因此公式(9)可拆分成如下形式:建立由色散系数围成的坐标系,则任何一种玻璃材料的色散特性都可以表征为在三维色散空间的向量
${\alpha _j}\left( {{\eta _{1 j}},{\eta _{2 j}},{\eta _{3 j}}} \right)$ 。整个光学系统的色散向量就可以构造为:式中:
$ \overrightarrow {{G_0}} $ 代表整个系统的色散向量;$ \overrightarrow {{G_j}} $ 表示系统中第$j$ 片透镜承担的色散分量;$x$ ,$y$ ,$z$ 代表单位向量。这样就可以将向量$ \overrightarrow {{G_0}} $ 的大小作为整个系统消色差情况的判断依据,理论上,$ \overrightarrow {{G_0}} $ 的模长越小,表明系统的消色差能力越好,以这一原则来指导玻璃材料的选择,通过选择合适的材料减小和向量$ \overrightarrow {{G_0}} $ ,这种方法称之为色散向量分析法。在应用Buchdahl模型求取系统初始结构光学材料的实际计算中,可以用三阶模型参与计算,获得更加准确的一阶和二阶色散系数
${\eta _1}$ 和${\eta _2}$ ,然后在二维色散空间下,按照最小化和向量找到的材料组合实现对至少三个波长进行色差校正,同时降低色散向量图表达的复杂程度 [12]。 -
在无焦系统下应用色散向量分析法存在一个问题:无焦系统的等效光焦度
${\varphi _0}$ 为零,其存在于公式(8)中比例因子${\alpha _j}$ 的分母中,这将导致比例因子全部无差别地成为无穷大的数而使向量表达失去意义。同时,公式(6)的近似是以密接系统或者说空气间隔很小的系统为前提的,忽略了光线高度差异带来的影响,这在无焦系统下是不合适的。因此,对$u_m^\prime $ 的表达形式重新推导以适用于无焦系统。借助光线追迹公式:
考虑到薄透镜系统且平行光入射,因此
${u_1} = 0, u_1^\prime = - {y_1}{\varphi _1}, u_2^\prime = {u_2} - {y_2}{\varphi _2} = - {y_1}{\varphi _1} - {y_2}{\varphi _2}$ ,依次递推可以推导出$u_m^\prime $ 的表达形式为:将公式(14)代入公式(5)中,同时以色散度
${D_i}\left( \lambda \right)$ 替换公式中阿贝数${V_i}$ 的倒数,得到无焦系统下的表达形式${Y^\prime }$ :以
${D_0}\left( \lambda \right)$ 表示整个无焦系统的色散特性时,光线高度存在较大折转,无法忽略透镜上光线高度差异引入的色差,对忽略光线高度差异的形式进行适当调整以适应无焦系统设计的实际情况:联立公式(15)和公式(16)可得:
将无焦系统下的色散向量比例因子
${\alpha _i}$ 表示为:通过公式(18)求得无焦系统下每一片透镜承担的色散向量的比例因子,新的表达形式可以摆脱对于系统整体光焦度值的依赖,而与系统中每一片透镜承担的光焦度及其上的入射光线高密切相关,非常适合无焦系统色散向量在二维空间下的信息表达。基于上节中介绍的色散向量分析法在向量图指导下替换材料,可以获得明显的色差校正效果,使色散向量分析法拓展到更广的应用领域。
-
为了验证无焦系统下延展理论的有效性,根据上述分析指导优化一个七倍望远无焦系统,校正632.8 nm和1064 nm波段的色差。七片无焦望远系统初始结构如图1所示。其对应的色差情况如图2所示,系统在0.707孔径处最大轴向色差约为3.446×10⁻³ D (屈光度),并且从焦移曲线图中得到信息, 632.8 nm和1064 nm两个波长的焦移相差0.00111 D,波段范围内最大焦移为0.0186 D,系统尚未能完全实现消色差设计。

Figure 1. Initial structure of the unfocused telescope system

Figure 2. Chromatic aberration diagram of initial structure of the unfocused system. (a) Longitudinal aberration; (b) Chromatic focal shift
为对系统色差进一步优化,应用无焦系统下的色散向量分析法指导系统中材料的选择与替换工作。对无焦系统初始结构进行色散向量分析,所选材料、相关光线追迹参数以及色散系数如表1所示。
Glass 1 2 3 4 5 6 7 SILICA CAF2 H-ZF71 H-ZPK7 H-K90GTI H-ZF73 H-ZLAF68C φi
yi
αi
η1
η20.00053
95.00
0.6277
−0.03602
−0.021310.00432
56.8459
1.8316
−0.02243
−0.00492−0.00485
49.1365
−1.5373
−0.07723
0.008290.00681
47.3583
2.0058
−0.02944
−0.00568−0.00944
38.6722
−1.8524
−0.03659
−0.017040.00910
26.5958
0.8449
−0.09580
0.01795−0.02417
17.0330
−0.9203
−0.04770
−0.00156Table 1. Initial structure ray tracing parameters and dispersion coefficients of the unfocused system
由表1中数据计算得到色散向量坐标,将系统的色散情况表示在如图3所示的二维色散向量空间下,所选材料在色散图中的位置分布如图3中黑点所示,实线表示正透镜组的色散向量之和,虚线表示负透镜组的色散向量之和,红色箭头代表组合向量
$ \overrightarrow {{G_0}} $ ,其模长经计算为0.02678。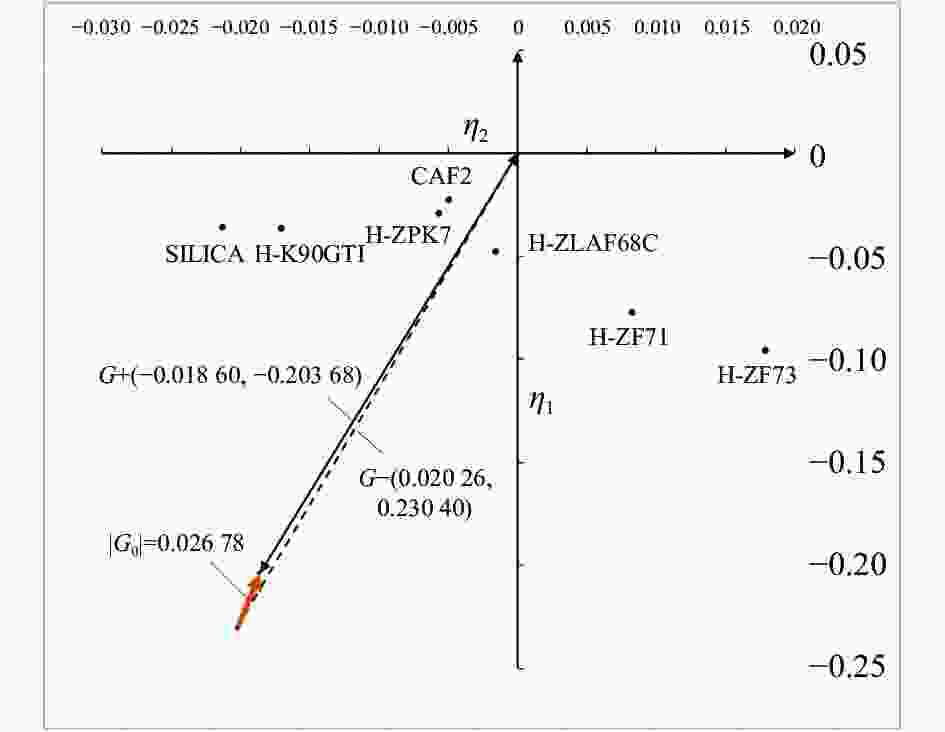
Figure 3. Dispersion vector diagram of the initial structure of the unfocused system
接着以色散向量分析法为指导,对系统中部分材料进行替换以减小
$ \overrightarrow {{G_0}} $ 的模长,从图3中可以看出,正透镜组表示的向量$\overrightarrow {{G_ + }} $ 的两个分量均为负值且其绝对值均小于负透镜组表示的向量$\overrightarrow {{G_ - }} $ 的两个正分量,因此,替换材料的思路仅从材料色散系数绝对值大小的角度来说,应该是适当增大正透镜组所选材料的色散系数而相应减小负透镜组的色散系数,使$\overrightarrow {{G_ + }} $ 和$\overrightarrow {{G_ - }} $ 的两个分量之间更加接近,从而实现减小和向量$ \overrightarrow {{G_0}} $ 的目标。以图3反映的正负透镜组材料色散系数的调整方向为主要原则,其中一阶色散系数起到更为主导的作用,同时对材料的获取难度以及价格综合考虑,对系统中第1、2、5片透镜的三组材料进行了相应替换,在表2中加粗示出。
Glass 1 2 3 4 5 6 7 H-K9L H-FK61 H-ZF71 H-ZPK7 H-QK3L H-ZF73 H-ZLAF68C φi
yi
αi
η1
η20.00054
95.00
0.5276
−0.03623
−0.017350.00460
55.7064
1.5488
−0.02691
−0.00845−0.00484
52.2936
−1.4353
−0.07723
0.008290.00717
48.6852
1.8429
−0.02944
−0.00568−0.00830
41.6452
−1.5618
−0.03436
−0.019720.00830
28.0373
0.7074
−0.09580
0.01795−0.02546
15.0993
−0.6296
−0.04770
−0.00156Table 2. Ray tracing parameters and dispersion coefficient after optimization of unfocused system
为确保系统的其他像差不会发生太大变化,在材料组合选择的基础上,对透镜的外形和间距进行了优化,表2给出了系统优化结果的光线追迹参数以及色散系数,其色散向量图如图4所示。
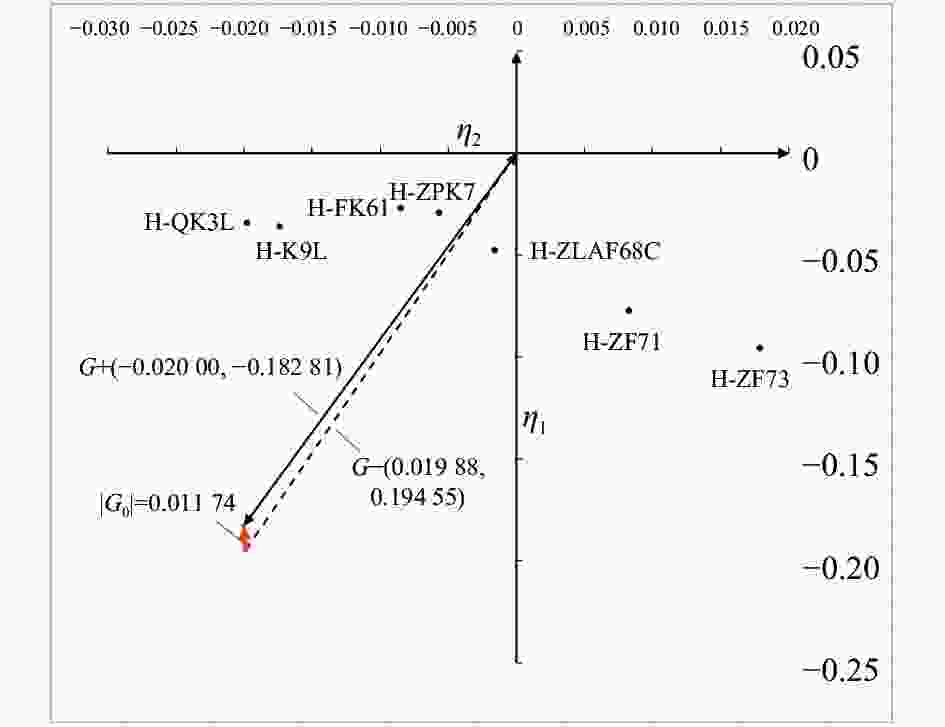
Figure 4. Dispersion vector diagram after optimization of unfocused system
结合图4及数据反馈可知,替换材料后,正透镜组向量之和与负透镜组向量之和的偏差明显减小,和向量
$ \overrightarrow {{G_0}} $ 的模长显著下降到0.01174,同时材料选择方面也明显优于初始结构,均为生产频次较高、价格相对更低的常用玻璃。系统优化后色差校正结果如图5所示。从轴向色差曲线可以看出,在0.707孔径处曲线近似交汇在一点,色差值仅为2.705×10⁻⁵ D,从焦移曲线反馈来看,632.8 nm和1064 nm的焦移差减小到0.00021 D,波段内最大焦移仅为0.0047 D,系统色差得到有效校正。最终设计结果的MTF曲线如图6所示,替换材料优化后MTF曲线也完全达到了衍射极限,至此完成无焦系统的消色差设计。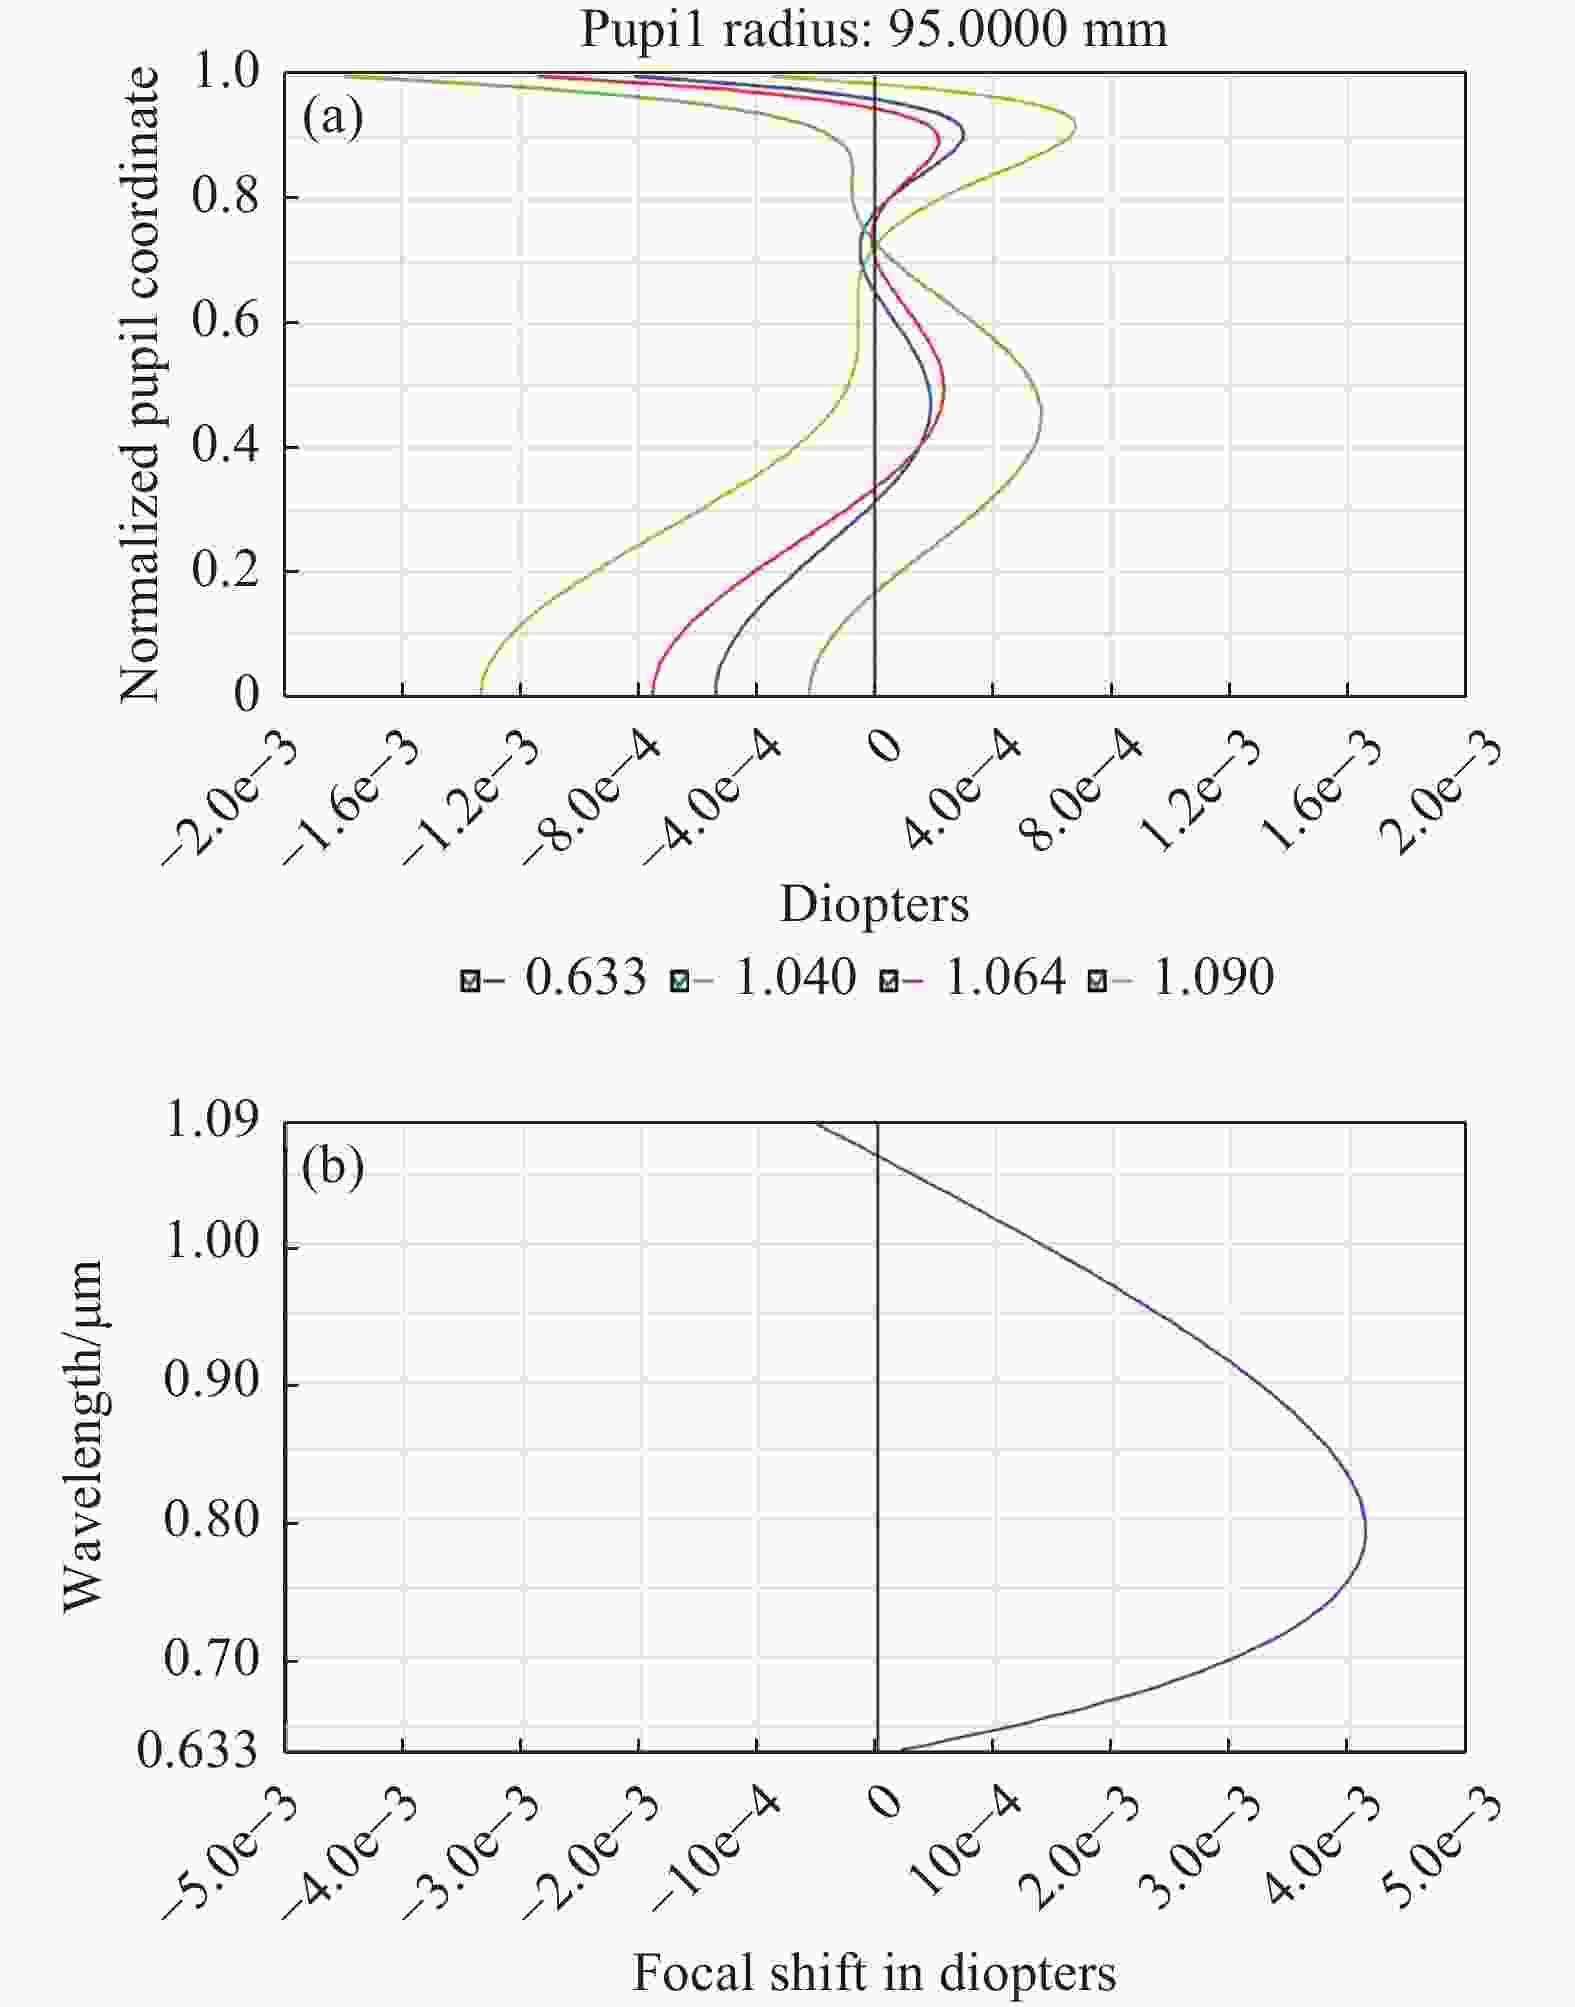
Figure 5. Chromatic aberration diagram after optimization of the unfocused system. (a) Longitudinal aberration; (b) Chromatic focal shift
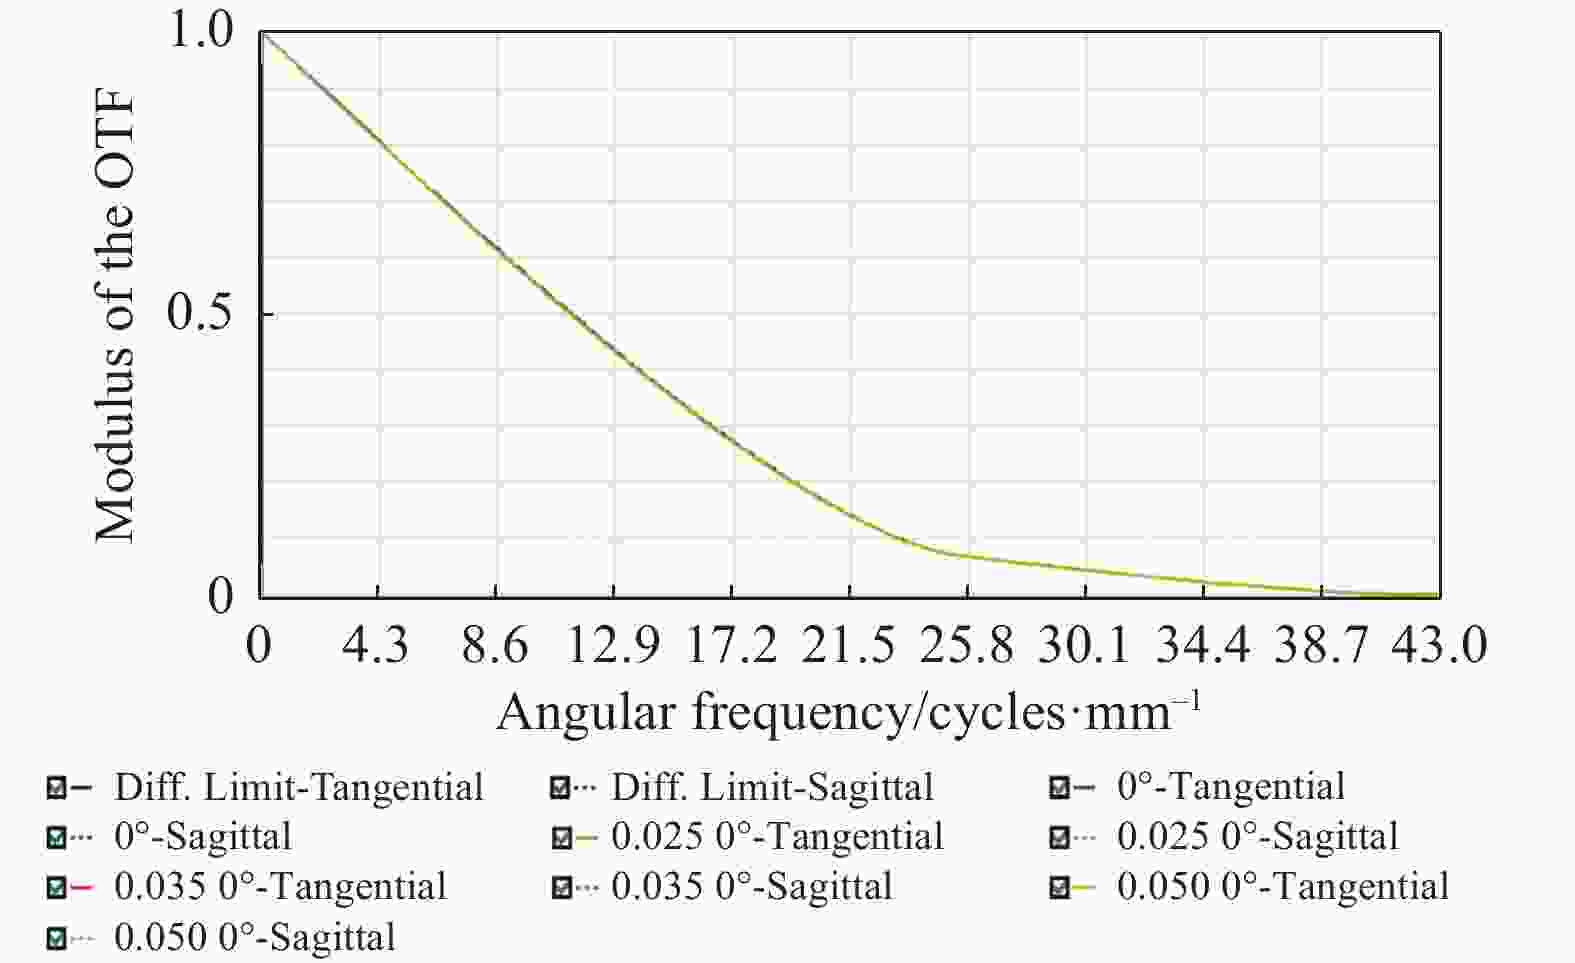
Figure 6. MTF curve after optimization of the unfocused system
-
文中针对基于Buchdahl模型的色散向量分析法在无焦系统下应用的问题,推导出适用于无焦系统的色散向量比例因子的变形表达,通过一个七倍望远无焦系统的设计实例验证了理论合理有效,最终的光学设计结果,色差得到了有效的消除,像质达到衍射极限。
Buchdahl model of achromatic method for unfocused systems
doi: 10.3788/IRLA20220374
- Received Date: 2022-05-31
- Rev Recd Date: 2022-08-27
- Publish Date: 2023-01-18
Fund Project:
Jilin Province Science and Technology Development Program(202002037JC)
-
Key words:
- unfocused system /
- Buchdahl model /
- dispersion vector
Abstract: The dispersion vector analysis method based on Buchdahl model can be used to guide material selection and replacement in optical design to obtain material combinations with good achromatic effect, but at present the theory is only applied to the design of focused systems due to the limitation of mathematical form, and there is no precedent for guiding the design of unfocused systems. To further investigate the application of this theory to the unfocused system, a deformed expression of the dispersion vector scale factor applicable to the unfocused system is proposed, and the material selection of a seven-fold telescopic unfocused system is carried out by this method. The optimized system has a maximum chromatic aberration of only 2.705×10⁻⁵ D (Diopter) at 0.707 aperture. The focal shift difference between 632.8 nm and 1 064 nm wavelengths is 0.000 21 D, and the maximum focal shift in the wavelength range is only 0.004 7 D. The chromatic aberration of the system is effectively corrected, and the MTF of each field of view completely reaches the diffraction limit. The research results enable the dispersion vector analysis method based on Buchdahl model to be applied to the design of unfocused systems as well, providing a new idea for the selection of achromatic material combinations for unfocused systems.


 DownLoad: