Volume 52 Issue 4
Apr.  2023
Turn off MathJax
Article Contents

Hao Jianxin, Wang Li. Research on circuit board fault diagnosis based on infrared temperature series[J]. Infrared and Laser Engineering, 2023, 52(4): 20220492. doi: 10.3788/IRLA20220492
Citation: Hao Jianxin, Wang Li. Research on circuit board fault diagnosis based on infrared temperature series[J]. Infrared and Laser Engineering, 2023, 52(4): 20220492. doi: 10.3788/IRLA20220492

Research on circuit board fault diagnosis based on infrared temperature series

doi: 10.3788/IRLA20220492
Funds:  National Natural Science Foundation of China (U1733119)
  • Received Date: 2022-07-14
  • Rev Recd Date: 2022-08-19
  • Available Online: 2023-04-14
  • Publish Date: 2023-04-25
  •   Objective   A rapid and accurate detection of the fault occurring to the airborne electronic system plays a crucial role in ensuring the safety of civil aircraft. However, due to the increase of circuit board size and component density in airborne electronic system, the traditional contact fault diagnosis method encounters various problems such as low accuracy, huge time cost and the demanding requirements on personnel competency. Therefore, this study aims to explore the solution to circuit board fault diagnosis based on non-contact infrared technology, which is essential for improving the accuracy of fault diagnosis for the airborne electronic system.   Methods   After the sequential thermal image of the circuit board is captured by using the infrared camera, the region of interest in the thermal image is processed as the infrared temperature series. Since the infrared temperature series of the circuit board contains various fault-related information, the accuracy of fault diagnosis can be improved by making full use of its local and global features. In this study, a fault diagnosis algorithm is proposed to achieve this purpose. Composed of the features extraction network (FEN) and the relationship learning network (RLN), it utilizes the local features of temperature series and the relationship between the features. Built on a residual structure with multi-scale dilated CNN, FEN plays the role of a local-feature extraction network to construct a multi-scale receptive field without increasing the number of training parameters and to learn the spatial features of temperature series of different ranges. Based on the embedded structure of two identical layers, attention mechanism and LSTM network, RLN is a network that can apply control on the transmission of temperature series to learn the importance of features and assign attention weights for mining the correlations between the features extracted from different positions. To develop a complete circuit board fault diagnosis algorithm, the parallel FEN and RLN networks are connected to the "Softmax" classifier.  Results and Discussions   The temperature series datasets representing 27 different fault categories are constructed based on the infrared thermal image of airborne power board (Tab.1, Tab.5). (1) By analyzing the temperature series datasets, it can be found that there are significant differences between the temperature curves of the chip under different fault conditions, and the temperature curves of non-faulty chips are also affected by faulty chips (Fig.5). (2) The experimental results show that the proposed algorithm achieves a better diagnostic performance than FCN, MFCN, LSTM and LSTM-FCN on the datasets of the temperature series testing on two self-built circuit boards. To be specific, its diagnostic accuracy reaches 91.15% and 96.27%, respectively (Fig.8) (Tab.5). (3) Given the identical hyperparameter setting, the increase in dimension of temperature sequence feature vector contributes to improving the diagnostic performance. That is to say, appropriate sample is one of the key influencing factors in improving the accuracy of fault diagnosis (Tab.5). (4) Ablation studies reveal that the performance of FEN in feature extraction capability can be improved by the proper setting of hyperparameters, which is conducive to enhancing the diagnostic accuracy of the algorithm (Tab.6). (5) The long Short-term Memory hybridized with Attention (LSTMwAtt) plays a role in improving the performance of the proposed algorithm in terms of relation extraction. By fully utilizing the intrinsic relationship between the characteristics of different locations of temperature series, the proposed algorithm is more likely to capture the differentiated data carried by similar faults (Tab.6).  Conclusions   In this study, a fault diagnosis algorithm intended for the airborne circuit board is proposed by using infrared temperature series. In this algorithm, the features extraction network is responsible for extracting local features and learning the spatial features of temperature series of different ranges, while the relationship learning network is proposed to discover the intrinsic relationships among the representations learned from infrared temperature series. According to the experimental results, the proposed diagnosis algorithm performs well on self-built testing datasets. However, it is worth noting that the small size of the self-built datasets reduces the accuracy of the algorithm when the proposed algorithm is applied to the new datasets. As the size of self-built datasets increases, it performs better in fault diagnosis. Hopefully, it would be applicable in circuit board fault systems to deal with the fault that occurs to the airborne electronic systems.
  • [1] Hao J X, Jia C Y. Research on fault mode diagnosis of airborne circuit board based on infrared lmages [J]. Infrared Technology, 2019, 41(3): 273-278. (in Chinese)
    [2] Li C L. Research on analog circuit fault diagnosis methods based on SVDD and parameter identification[D]. Nanjing: Nanjing University of Aeronautics and Astronautics, 2011. (in Chinese)
    [3] Li G H, Lei J. Research on major technology of PCB infrared thermal detection based on information fusion [J]. Infrared Technology, 2017, 39(9): 829-834. (in Chinese)
    [4] Norhisham M, Bugis I, Jamaludin I, et al. Thermal analysis on PCB using Galerkin approach[C]//International Conference on Modeling. IEEE, 2011: 1-6
    [5] Varghese J, Singh T, Mohan S. PCB thermal image analysis using MATLAB [J]. International Journal of Recent Advances in Engineering & Technology, 2014, 2(3): 46-52.
    [6] Wang M H, Chung Y K, Sung W T. Using thermal image matter-element to design a circuit board fault diagnosis system [J]. Expert Systems with Applications, 2011, 38(5): 6164-6169. doi:  10.1016/j.eswa.2010.11.055
    [7] Al-Obaidy F, Yazdani F, Mohammadi F A. Fault detection using thermal image based on soft computing methods: Comparative study [J]. Microelectronics Reliability, 2017, 71(58): 88-100.
    [8] Cui W. Research on key technologies for printed circuit board detection by infrared thermorgraphy[D]. Nanjing: Nanjing University of Aeronautics and Astronautics, 2011. (in Chinese)
    [9] Wang L, Wang M. Automatic image segmentation algorithm by PCNN based on mean threshold and Ostu [J]. Infrared Technology, 2015, 37(7): 553-559. (in Chinese)
    [10] Wang K, Zhang K, Wang L, et al. Infrared image segmentation based on MRF combined with two-algorithm game [J]. Infrared Technology, 2015, 37(2): 134-138. (in Chinese)
    [11] Wang L, Zeng P P, Hao J X. Infrared image registration of circuit board based on ROI gray compression [J]. Laser & Infrared, 2014, 44(3): 313-318. (in Chinese)
    [12] Wang L, Li S, Wu H, et al. Research of aviation circuit board fault diagnosis and prediction based on infrared technology [J]. Computer Simulation, 2017, 34(7): 89-93. (in Chinese)
    [13] Hao J X, Jia C Y. Circuit board fault diagnosis algorithm based SVM and improved D-S evidence theory [J]. Modern Elec-tronics Technique, 2019, 42(22): 15-20. (in Chinese)
    [14] Yann L C, Bengio Y, Hinton G. Deep learning [J]. Nature, 2015, 147(521): 436-444.
    [15] Schmidhuber J. Deep learning in neural networks: An overview [J]. Neural Newworks, 2015, 61(1): 85-117. doi:  https://doi.org/10.1016/j.neunet.2014.09.003
    [16] Wang Z, Yan W, Oates T. Time series classification from scratch with deep neural networks: A strong baseline[C]//Inter-national Joint Conference on Neural Networks, 2017: 1578-1585.
    [17] Cui Z, Chen W, Chen Y. Multi-scale convolutional neural networks for time series classification[EB/OL]. (2016-03-22)[2022-07-14]. http://arxiv.org/abs/1603.06995.
    [18] Zou X W, Wang Z D, Li Q, et al. Integration of residual network and convolutional neural network along with various activation functions and global pooling for time series classification [J]. Neurocomputing, 2019, 367: 39-45. doi:  10.1016/j.neucom.2019.08.023
    [19] Karim F, Majumdar S, Darabi H, et al. LSTM fully con-volutional networks for time series classification [J]. IEEE Access, 2018, 6: 1662-1669. doi:  10.1109/ACCESS.2017.2779939
    [20] Elsayed N, Maida A S, Bayoumi M. Gated recurrent neural networks empirical utilization for time series classification [C]// 2019 International Conference on Internet of Things (iThings) and IEEE Green Computing and Communications (GreenCom) and IEEE Cyber, Physical and Social Computing (CPSCom) and IEEE Smart Data (SmartData), 2019: 1207-1210.
    [21] Hochreiter S, Schmidhuber J A . LSTM can solve hard long time lag problems [C]//Neural Information Processing Systems, MIT Press, 1996: 473-479.
    [22] Chorowski J, Bahdanau D, Serdyuk D, et al. Attention-Based Models for Speech Recognition[C]//NIPS'15: Proceedings of the 28th International Conference on Neural Information Processing Systems, 2015, 1: 577-585.
    [23] Xie G, Shangguan A, Fei R, et al. Motion trajectory prediction based on a CNN-LSTM sequential model [J]. Science China Information Sciences, 2020, 63(11): 233-253.
    [24] Zhao Liang, Mo Chunyang, Ma Jiajun, et al. LSTM-MFCN: A time series classifier based on multi-scale spatial-temporal features [J]. Computer Communications, 2022, 182: 52-59. doi:  https://doi.org/10.1016/j.comcom.2021.10.036
    [25] Tang W, Long G, Liu L, et al. Rethinking 1D-CNN for time series classification: A stronger baseline[C]//The Tenth Inter-national Conference on Learning Representations(ICLR 2022), 2022.
    [26] Karim F, Majumdar S, Darabi H, et al. Multivariate LSTM-FCNs for time series classification [J]. Neural Networks, 2018, 116: 237-245.
    [27] Xiao Z, Xu X, Xing H, et al. RTFN: A robust temporal feature network for time series classification [J]. Information Sciences, 2021, 571: 65-86. doi:  10.1016/j.ins.2021.04.053
    [28] Zhu Y, Zhao C, Guo H, et al. Attention couplenet: Fully convolutional attention coupling network for object detection [C]//IEEE Transactions on Image Processing, 2019: 113-126.
  • 加载中
通讯作者: 陈斌, bchen63@163.com
  • 1. 

    沈阳化工大学材料科学与工程学院 沈阳 110142

  1. 本站搜索
  2. 百度学术搜索
  3. 万方数据库搜索
  4. CNKI搜索

Figures(8)  / Tables(6)

Article Metrics

Article views(188) PDF downloads(57) Cited by()

Related
Proportional views

Research on circuit board fault diagnosis based on infrared temperature series

doi: 10.3788/IRLA20220492
  • 1. Engineering Techniques Training Center, Civil Aviation University of China, Tianjin 300300, China
  • 2. Vocational and Technical College, Civil Aviation University of China, Tianjin 300300, China
Fund Project:  National Natural Science Foundation of China (U1733119)

Abstract:   Objective   A rapid and accurate detection of the fault occurring to the airborne electronic system plays a crucial role in ensuring the safety of civil aircraft. However, due to the increase of circuit board size and component density in airborne electronic system, the traditional contact fault diagnosis method encounters various problems such as low accuracy, huge time cost and the demanding requirements on personnel competency. Therefore, this study aims to explore the solution to circuit board fault diagnosis based on non-contact infrared technology, which is essential for improving the accuracy of fault diagnosis for the airborne electronic system.   Methods   After the sequential thermal image of the circuit board is captured by using the infrared camera, the region of interest in the thermal image is processed as the infrared temperature series. Since the infrared temperature series of the circuit board contains various fault-related information, the accuracy of fault diagnosis can be improved by making full use of its local and global features. In this study, a fault diagnosis algorithm is proposed to achieve this purpose. Composed of the features extraction network (FEN) and the relationship learning network (RLN), it utilizes the local features of temperature series and the relationship between the features. Built on a residual structure with multi-scale dilated CNN, FEN plays the role of a local-feature extraction network to construct a multi-scale receptive field without increasing the number of training parameters and to learn the spatial features of temperature series of different ranges. Based on the embedded structure of two identical layers, attention mechanism and LSTM network, RLN is a network that can apply control on the transmission of temperature series to learn the importance of features and assign attention weights for mining the correlations between the features extracted from different positions. To develop a complete circuit board fault diagnosis algorithm, the parallel FEN and RLN networks are connected to the "Softmax" classifier.  Results and Discussions   The temperature series datasets representing 27 different fault categories are constructed based on the infrared thermal image of airborne power board (Tab.1, Tab.5). (1) By analyzing the temperature series datasets, it can be found that there are significant differences between the temperature curves of the chip under different fault conditions, and the temperature curves of non-faulty chips are also affected by faulty chips (Fig.5). (2) The experimental results show that the proposed algorithm achieves a better diagnostic performance than FCN, MFCN, LSTM and LSTM-FCN on the datasets of the temperature series testing on two self-built circuit boards. To be specific, its diagnostic accuracy reaches 91.15% and 96.27%, respectively (Fig.8) (Tab.5). (3) Given the identical hyperparameter setting, the increase in dimension of temperature sequence feature vector contributes to improving the diagnostic performance. That is to say, appropriate sample is one of the key influencing factors in improving the accuracy of fault diagnosis (Tab.5). (4) Ablation studies reveal that the performance of FEN in feature extraction capability can be improved by the proper setting of hyperparameters, which is conducive to enhancing the diagnostic accuracy of the algorithm (Tab.6). (5) The long Short-term Memory hybridized with Attention (LSTMwAtt) plays a role in improving the performance of the proposed algorithm in terms of relation extraction. By fully utilizing the intrinsic relationship between the characteristics of different locations of temperature series, the proposed algorithm is more likely to capture the differentiated data carried by similar faults (Tab.6).  Conclusions   In this study, a fault diagnosis algorithm intended for the airborne circuit board is proposed by using infrared temperature series. In this algorithm, the features extraction network is responsible for extracting local features and learning the spatial features of temperature series of different ranges, while the relationship learning network is proposed to discover the intrinsic relationships among the representations learned from infrared temperature series. According to the experimental results, the proposed diagnosis algorithm performs well on self-built testing datasets. However, it is worth noting that the small size of the self-built datasets reduces the accuracy of the algorithm when the proposed algorithm is applied to the new datasets. As the size of self-built datasets increases, it performs better in fault diagnosis. Hopefully, it would be applicable in circuit board fault systems to deal with the fault that occurs to the airborne electronic systems.

    • 健康的机载电子系统是保证民机安全飞行的关键,快速、准确发现并定位机载电子系统故障至关重要[1]。传统故障诊断主要依赖技术人员结合电路原理与故障现象进行诊断与维修。而当前的机载电路系统呈现元件密度高、电路规模大等特点,这使得传统接触式诊断方法面临诊断困难、推广性低、耗时长、准确率低等难题[2]

      基于红外的非接触式故障诊断技术利用红外摄像仪获取电路关键元件的温度信息,利用温度信息实现电路元件级故障诊断,这为实现电子系统的故障诊断提供了新的方向[3]。Norhisham[4]等基于Galerkin算法建立有限元模型以研究不同覆铜宽度和电流下电路板的温度热图;Varghese[5]等通过电路板红外热图序列的峰值温度及温度最大面积实现了对电路板的工作状态的表征。可以发现,上述研究的重点均集中在元件热行为,缺乏对温度与故障间关系的研究。Wang[6]等基于可拓理论建立电路板热像物元模型,通过分析典型故障模型与被测试板间的关联度确定故障;Al-Obaidy[7]等利用主成分分析法处理温度信息,基于MLP、SVM及ANFIS对电路板故障进行分类,但却未能充分提取用于故障分类的特征信息。崔伟[8]等较早地提出了通过直接比较正常和故障状态下的电路板红外热图来确定故障元件,但是故障阈值与故障类型关系不够清晰;王力团队做了较多基于红外的电路板故障诊断的研究,早期主要以故障电路板红外图像图像预处理[9-11]为主,后期该团队重点研究温度信息与电路板故障征兆之间的关系[12-13],提出了使用SVM和改进SVM&D-S理论的故障诊断和预测方法,但是上述研究缺乏对温度序列和时间特征的考虑。

      与基于特征的方法相比,深度学习技术能够对序列数据内部结构全面搜索和检测,自动提取有利于分类任务的特征[14-15]。典型的深度学习时间序列分类方法包括卷积神经网络(Convolutional Neural Network, CNN)、残差网络(Residual Network, ResNet)[16]长短期记忆网络(Long Short-Term Memory, LSTM),以及由其所衍生的多模态混合结构模型。源于CNN的全卷积网络[16](Full Convolution Network, FCN)因出色的空间特征捕捉能力表现出优秀的分类性能,并产生了多种变体网络结构。MFCN[17]可捕获多尺度特征来扩展CNN性能,解决了特征丢失问题;Res-FCN[18]深度级联可关注长时特征的ResNet和高阶特征的FCN,从而加强了卷积操作的优势。事实证明,CNN变体算法可有效提取序列特征,但因为仅依赖于卷积贡献,缺乏对序列数据复杂相关性和时域内隐含序列依赖关系的考虑,为分类任务提供特征信息方面存在一定局限性。为此,提出了与时间任务自然相关的LSTM和GRU深度学习模型。其中,STM-FCN[19]与GRU-FCN[20]并行深度学习架构兼顾了时序空间特征与时变特征;进一步优化构建的ALSTM-FCN,可自动学习并关注重要特征,通过聚焦对分类有重要贡献的特征而显著提高了分类准确率。然而,上述算法确忽视了时间序列中隐藏的用于区别特征的不同尺度以及它们之间的内在关系,序列特征仍然提取的不够彻底。

      结合前人研究成果,针对电路板故障分类问题,文中提出了一种将FEN与RLN并行的故障诊断模型。基于MFCN建立的FEN可以在不增加训练参数的前提下通过构建多层次感受野学习温度序列不同范围的空间特征;基于LSTMhAtt建立的RLN可以学习特征重要性并建立数据不同位置的特征间相关性;并行网络的输出与简单分类器直接相连即可输出电路板的故障分类结果。与当前基于深度学习的常见分类算法相比,文中算法在自建电路板故障温度测试数据集上表现出了更高的故障诊断性能。

    • 循环神经网络(Recurrent Neural Network,RNN)可记忆上一时刻信息并应用于当前时刻输出计算,其隐藏层节点相互连接。假设$ {{\boldsymbol{x}}_t} \in {\mathbb{R}^M} $$ {{\boldsymbol{h}}_t} \in {\mathbb{R}^D} $分别表示$ t $时刻网络输入和隐藏层状态,在t时刻网络的输出如公式(1)、(2)所示:

      式中:$ g( \cdot ) $为softmax激活函数$ {\boldsymbol{W}} $为输入权重矩阵;$ {\boldsymbol{I}} $为输入的样本权重矩阵;$ {\boldsymbol{V}} $为输出的样本权重矩阵。

    • LSTM是一种引入了门控机制的RNN,由Hochreiter和Schmidhube[21]提出用于解决RNN时间延迟与梯度消失的问题。LSTM在每个时间步长中引入新的内部状态$ {{\boldsymbol{c}}_t} \in {\mathbb{R}^D} $进行信息传递,并输出信息给隐藏层的外部状态$ {{\boldsymbol{h}}_t} \in {\mathbb{R}^D} $t时刻的网络可由公式(3)、(4)描述:

      式中:$ {{\boldsymbol{f}}_t} $$ {{\boldsymbol{i}}_t} $$ {{\boldsymbol{o}}_t} $分别为遗忘门、输入门与输出门;$ \odot $为向量元素乘积;$ {{\boldsymbol{\tilde c}}_t} $为通过非线性激活函数得到的候选状态;$ {{\boldsymbol{c}}_t} $为记录了到当前时刻为止的历史信息。

    • 注意力机制旨在通过资源分配从大量信息中选择对当前任务目标最关键的信息[22],被广泛应用于深度学习领域[23]。假设D维向量$ {{\boldsymbol{K}}_n} \in {\mathbb{R}^D},n \in [1,N] $表示一组输入信息,则$ \left( {{\boldsymbol{K}},{\boldsymbol{V}}} \right) = \left[ {({{\boldsymbol{k}}_1},{{\boldsymbol{v}}_1}), \cdots ,({{\boldsymbol{k}}_N},{{\boldsymbol{v}}_N})} \right] $表示$ N $组输入信息,已知查询量$ {\boldsymbol{q}} $,注意力函数可表示为:

      其中,$ {\alpha _n} $为注意力分布;$ s({{\boldsymbol{k}}_n},{\boldsymbol{q}}) $为基于缩放点积的打分函数,如公式(6)所示:

    • 为了能够充分利用电路板红外温度序列数据集中故障特征及特征间的相互关系,文中提出了一种将特征提取网络FEN和特征关系学习网络RLN并行的故障诊断算法模型,如图1所示。其中,FEN用于挖掘温度序列中不同尺度下的局部特征信息;RLN用于学习特征重要程度以及发现数据不同位置的特征间相关性。由于并行的FEN与RLN已经充分提取了输入序列数据特征并学习了特征间的关系,因此直接在并行网络后连接简单的分类器即可完成故障分类。

      Figure 1.  Structure of circuit board fault diagnosis model

    • FEN基于1D-CNN以残差结构构建,包括三个1D卷积模块(Conv1D Block,CB)、两个膨胀卷积模块(Dilated Conv1D Block, DCB)和一个自注意力模块(Self-Attention Block,SAB)。

      模型中三个CB结构一致,输入与输出关系可表示为:

      式中:$ {\boldsymbol{Ou}}{{\boldsymbol{t}}_{CB}} $$ {\boldsymbol{x}} $分别为CB的输入与输出;$ {f_{Leak{Re} lu}}( \cdot ) $$ {f_{BN}}( \cdot ) $$ {f_{CNN}}( \cdot ) $分别为LeakRelu激活函数、批标准化处理和1D卷积函数。

      为了构建更大的多层次感受野以学习温度序列不同范的空间特征且不增加模型训练参数,参考MFCN[17]构建三层的DCB,如图2所示。其输入输出关系如公式(12)~(14)所示:

      式中:${f_{CONTCAT}}( \cdot )$为连接函数;$ {f_{Dialted}}( \cdot ) $为膨胀卷积函数;$ L = 1,2,3 $,为DCB的层数;$ i = 1,2,3 $,为每层内膨胀卷积的组数;$ V{F_{Li}} $为第$ L $层第$ i $个膨胀卷积模块的输出;$ {d_i} $为第$ i $个膨胀卷积的膨胀因子;$ {S_L} $为第$ L $层膨胀卷积的核尺寸;$ I{F_L} $为第$ (L - 1) $层输出。依据图1的FEN结构,FEN最终输出可表示为:

      式中:$ {\boldsymbol{Ou}}{{\boldsymbol{t}}_{CB - 3}} $为第三个CB模块的输出;$ {\boldsymbol{Ou}}{{\boldsymbol{t}}_{Dilated - 2}} $为第二个DCB模块的输出;$ {f_{Global}}( \cdot ) $为全局池化函数;$ \oplus $为残差连接。

      Figure 2.  Structure diagram of dilated Conv1D block

    • RLN由两个具有相同结构的LSTMwAtt模块构建。第一个LSTMwAtt主要负责提取温度序列数据之间的基本关系,第二个LSTMwAtt则通过扩展先前获得的关系细节来进一步提取隐藏在数据中的更复杂的正则化关系。与直接将注意力机制和LSTM连接的网络不同,文中将LSTM网络嵌入自注意力机制中,如图3所示。将输入信号$ {\boldsymbol{X}} $分别输入三个基础LSTM,依据1.2节LSTM的计算方式分别得到三个LSTM输出,通过可训练网络参数矩阵$ {{\boldsymbol{W}}_q} $$ {{\boldsymbol{W}}_k} $$ {{\boldsymbol{W}}_v} $将上述输出分别映射到三个不同的空间,得到查询向量Quary、键向量Key和值向量Value,如公式(12)~(14)所示:

      式中:$ {f_{LSTM - Q}} $$ {f_{LSTM - K}} $$ {f_{LSTM - V}} $分别为基础LSTM网络;$ {\boldsymbol{Q}} $$ {\boldsymbol{K}} $$ {\boldsymbol{V}} $分别为Quary、Key以及Value构成的向量矩阵。对于每一个查询向量$ {{\boldsymbol{q}}_n} \in {\boldsymbol{Q}} $,依据公式(5)、(6),化简得到LSTMwAtt的输出,如公式(15)所示:

      $ {\boldsymbol{Ou}}{{\boldsymbol{t}}_{FEN}} $$ {\boldsymbol{Ou}}{{\boldsymbol{t}}_{RLN}} $连接,得到并行网络的最终输出,如公式(16)所示,该输出将被送入后续的简单分类器以完成故障类别分类。

      Figure 3.  Structure of LSTMwAtt

    • 使用德制InfraTec-R5300红外摄像仪获取尺寸$ 320 \times 256 $、测量精度±1%、温度分辨率小于等于0.015 K的某航电系统电源模块红外图像,如图4所示。

      Figure 4.  Infrared image of power module

      人为设置$U1$$U2$$U3$为芯片故障,如表1所示。其中,F1为正常模式,F2~F18为芯片单引脚破损或接触不良引起的断路故障,F19~F27为相邻引脚短接引起的短路故障。为确保实验中获取数据的可靠性,文中设计了一种数据采集同步系统,使电源模块通电周期与红外摄像仪采集数据周期同步,只保留电源模块开始通电至稳定工作状态间的红外图像。实验在恒温环境下进行,使用采集同步系统控制摄像仪采集共计10个周期的红外图像,设置每个周期的采样时间为300 s,采样频率1 Hz。27种故障模式下共计获得有效红外图像序列81000张。参考文献[1],将红外图像序列中的$U1$$U2$$U3$三个温度区域转换为尺寸为$20 \times 20$的温度矩阵,并以此分别构建三个芯片的温度序列数据集。

      ModeDescriptionModeDescriptionModeDescriptionModeDescription
      F1NormalF8pin2 of U2-openF15pin3 of U3-openF22pin2 and 3 of U2 chip-short
      F2pin2 of U1-openF9pin3 of U2-openF16pin4 of U3-openF23pin3 and 4 of U2 chip-short
      F3pin3 of U1-openF10pin4 of U2-openF17pin6 of U3-openF24pin6 and 7 of U2 chip-short
      F4pin4 of U1-openF11pin5 of U2-openF18pin7 of U3-openF25pin2 and 3 of U3 chip-short
      F5pin6 of U1-openF12pin6 of U2-openF19pin2 and 3 of U1 chip-shortF26pin3 and 4 of U3 chip-short
      F6pin7 of U1-openF13pin7 of U2-openF20pin3 and 4 of U1 chip-shortF27pin6 and 7 of U3 chip-short
      F7pin1 of U1-openF14pin1 of U3-openF21pin6 and 7 of U1 chip-short

      Table 1.  Failure mode description

    • 图5$U1$故障时$U1$$U2$$U3$温度序列数据曲线,文中将通过该曲线进一步说明数据集构建的依据。由于故障源于$U1$,因此$U1$温度曲线在不同模式下表现出较大差异;但是,无故障的$U2$$U3$温度曲线却因$U1$故障也出现了温度差异。基于上述现象,文中首先选择同时使用$U1$$U2$$U3$的温度数据表征电路板工作(故障)模式。

      为了进一步扩充特征信息,实验中还提取了各芯片的温度变化率,并与原始温度信息组建新的温度序列,以此作电路板工作(故障)模式的第二种表征方式。

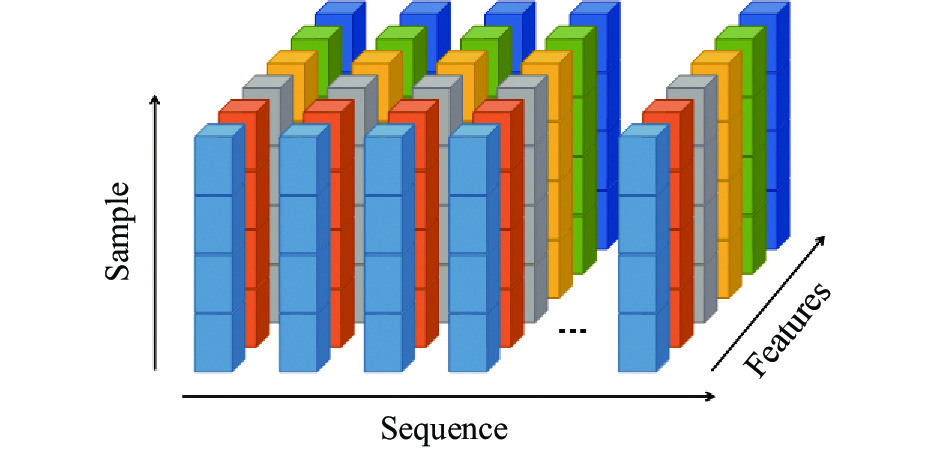
      依据图6所示的数据结构,实验中共计建立四个表征电路板工作模式的温度序列数据集,如表2所示。实验中,分别取Datasets_1与Datasets_2的80%用于训练模型,20%用于验证模型的准确率;Datasets_3与Datasets_4则作为独立的数据用于测试模型的故障诊断准确率。

      Figure 5.  Temperature change curves of each chip when U1 fails

      Figure 6.  Structure of self-made temperature series datasets

      SamplesSequenceFeaturesPurpose
      Datasets_1195481203Train & Verify
      Datasets_2195481206Train & Verify
      Datasets_348871203Test
      Datasets_448871206Test

      Table 2.  Parameters of self-made temperature series datasets

    • FEN通道中超参数设置主要遵循以下原则:

      (1)为确保与FCN、MFCN及LSTM-FCN性能对比的公平性,参考文献[16]将DCB各层总通道数分别设置为128、256和128,核尺寸为8、5、3;考虑到FEN基于残差结构搭建,设置各CB通道数与DCB第一层通道数保持一致;

      (2)为使网络在不增加训练参数前提下构建多层次的感受野,依据金字塔结构[24]为DCB中Layer_1与Layer_2 层的膨胀卷积设置不同的膨胀因子,通过调整各膨胀卷积通道比例以确定最优参数;

      (3) CB3直接与残差节点相连,旨将输入信息在不同通道进行线性整合,因此核尺寸设置为1;

      (4)以文献[25]作为理论支撑,依据工程应用经验将CB1和CB2核尺寸分别设置为11~9, 9~7, 7~5,5~3,基于文献[17]在自建数据集上验证上述核尺寸下模型的性能。实验结果显示,当核尺寸为9~7时,分类准确率最高,达到89.73%,高于第二名(核尺寸为7~5) 0.17%;但是,其计算用时为164.26 s,高于第二名19.02 s。综合考虑核尺寸与分类准确率和计算资源消耗之间的关系,设置CB1和CB2的核尺寸分别为7、5。具体FEN参数设置如表3所示。

      RLN通道的中的每个LSTMwAtt模块包含两个隐藏层,设置LSTM每层为128个隐藏单元[19,26];使用Tensorflow框架中RMSprop优化器[27]自适应优化更新模型参数,动量项参数设为0.9,初始学习率设为0.01,衰减速率为0.9,一旦学习率小于0.001,保持并停止衰减以确保模型加快收敛速度的同时能够保持参数波动平稳;训练过程中使用L2正则化和Dropout层防止过拟合[28],Dropout率设置为0.5。

      ParametersDCB:Layer_1DCB:Layer_2DCB:Layer_3CB
      Dilated_1Dilated_2Dilated_3Dilated_1Dilated_2Dilated_3Conv1DBlock1Block2Block3
      Filters128256128128
      Dilation rate1241241-
      ActivationLeakRelu
      Filter size853751
      Receptive field1×82×84×81×52×54×51×3751
      Scales proportion112112--
      121121
      211211

      Table 3.  Hyperparameters settings of FEN

      模型在Datasets_1和Datasets_2数据集进行20次Epochs迭代训练与验证,当DCB模块中各膨胀卷积模块的核数量之比为$ 1:2:1 $时,模型在验证集上的准确率最高,如表4所示,基于此结果,从而确定了文中后续实验中使用的最终结构模型。

      1∶1∶21∶2∶12∶1∶1
      Datasets_192.39%95.15%92.18%
      Datasets_298.19%98.98%97.07%

      Table 4.  Performance of different kernel quantity

      图7为诊断模型在Datasets_1和Datasets_2上的损失曲线与准确率曲线。对比图7(a)和(c),两个数据集上的训练损失与验证损失的下降趋势一致,模型没有出现过拟合;由于Datasets_2增加了温度变化率特征量,在相同算法结构与参数设定的情况下,模型在Datasets_2验证集的准确率与在Datasets_1验证集相比有所提高,最高准确率达到了98.98%,如图7(b)和(d)所示。上述实验结果表明,文中算法有效地提取温度序列信息的不同尺度的特征,并且充分利用了特征间的内在关系,因此在验证集上取得了满意的故障诊断率。实验结果同时也说明增加温度变化率而构建的温度特征可以更有效地表征各模式故障特征,有利于算法准确率的提升。

      Figure 7.  Results of training and validation in Datasets_1 and Datasets_2

      为了进一步对比说明文中算法模型的性能,分别使用FCN、MFCN、LSTM、LSTM-FCN在Datasets_1和Datasets_2数据集进行训练和验证,将训练好的各个模型布置于Datasets_3和Datasets_4进行测试,各模型故障诊断性能如表5所示。由于在Datasets_1和Datasets_2的训练集与验证集出于同一个数据集内,训练集与验证集具有高度相似的特征信息,因此所有的算法均在训练集中学到了有效的分类特征,在验证集上获得了较好的诊断性能,各模型间的诊断准确率差距较小,文中算法的准确率仅比LSTM-FCN模型准确率高0.32%和0.54%。

      FCNMFCNLSTMLSTM-FCNProposed
      Datasets_193.21%94.71%91.78%94.83%95.15%
      Datasets_297.12%96.69%96.35%98.44%98.98%
      Datasets_380.71%83.30%80.09%85.80%91.15%
      Datasets_488.8%89.56%85.58%91.71%96.27%

      Table 5.  Performance comparison of different classi-fication algorithm models

      但是在Datasets_3和Datasets_4两个独立测试集的诊断结果显示,所有模型的诊断准确率均有所下降,但仍然遵循如下趋势:多尺度MFCN分类结果优于单尺度FCN;单尺度FCN分类结果优于LSTM;LSTM-FCN融合模型的分类准确程度则高于FCN、MFCN和LSTM,但是上述算法模型的诊断准确率均低于文中模型,诊断准确率高出LSTM-FCN模型5.35%和4.56%,分类性能优势得到了体现。为了更直观地展示各模型在真实测试数据集上的性能,使用上述分类算法分别对随机选择Datasets_4的100个数据进行分类测试,模型预测的结果与实际故障结果的对比如图8所示。

      图8(a)~(d)的分类错误主要集中与在F4和F27,这也是导致各个模型在测试集上分类准确率均大幅降低的主要原因。图8(e)为使用文中算法模型的故障分类结果,F4和F27样本中均只出现了一个错误分类,远远小于用于对比其他算法的模型,文中模型在测试集上依然取得了令人满意的诊断准确率。

      综合上述实验结果可以发现,由于同时并行多尺度膨胀卷积与LSTMwAtt网络,文中模型不仅能够充分地挖掘训练数据中足够多的局部特征,还可以学习特征的重要性并分配权重,将不同位置特征之间关系联系起来,捕获它们的内在正则化过程。当模型应用于新的数据集时,依然能够最大化地利用局部特征与特征间的内在关系,确保较高的故障诊断准确率。但是,受限于数据集规模仍然不够,所以在独立的测试集Datasets_3和Datasets_4上,文中算法模型的分类准确率也有所降低。

      Figure 8.  Comparison of diagnostic results of different algorithm models

    • 为了科学解释模型性的能优势,文中对模型结构与参数进行消融实验。由于篇幅原因,对下述实验名称作简化替代。其中,“Relu”表示使用Relu替代文中FEN通道中的激活函数LeakRelu;“No_Dilate”表示不使用膨胀卷积结构;“No_SelfAtt”表示取消文中算法中两个DCB之间的Self-Attention层;“AttLSTM”表示仅通过简单级联LSTM与注意力机制所形成的模型;“1_LSTM”和“3_LSTM”分别表示RLN通道中使用一个和三个LSTMwAtt模块,使用更改后的模型结构在Datasets_3和Datasets_4上进行诊断测试,实验结果如表6所示。

      结合表6的实验结果可以发现:FEN中采用膨胀卷积使模型可以在不增加训练参数的前提下扩展感受野尺度、提高特征覆盖面,全面学习了各模式下的温度时间序列特征;与只关注正数的Relu激活函数不同,LeakRelu同时利用了正、负数,有助于避免特征在激活过程中丢失;Self_Att层可以使FEN分配更多的权重给重要的特征,即对三个芯片提供的特征数据给予权重划分,提高真实故障芯片的特征对分类的贡献。因此,膨胀卷积、LeakRelu和Self_Att的使用均在一定程度上提高了FEN特征提取的能力和故障诊断的准确率。

      ReluNo_DilateNo_SelfAttAttLSTM1_LSTM3_LSTM
      Datasets_389.73%90.23%90.21%89.37%88.54%83.38%
      Datasets_495.75%95.67%95.07%95.97%93.82%90.80%

      Table 6.  Performance comparison of ablation experiment

      RLN通道利用LSTMwAtt模块使得通道具备了更强的关系提取能力,充分利用了温度序列数据不同位置提取的特征间内的在关系,捕获相似故障模式中的差异化数据;使用两个LSTMwAtt的故障分类准确率明显高于1_LSTM和3_LSTM,究其原因是由于第二层LSTMwAtt揭示了第一层捕获的特征之间的关系细节,已经充分挖掘并提取了数据中所忽略的复杂表示与隐藏的复杂的关系;而当使用三个LSTMwAtt时,第三层仅充当了信息传输层,当细节均在第二层中被明确揭示的前提下,第三层反而导致数据特征在传输过程中丢失,分类准确率降低,还消耗了额外计算资源。当仅使用一个AttLSTM,数据特征传输过程中则缺乏对已提取的表示间内部连接更深入的关注,导致从数据中学习的特征关系不足,降低了诊断准确率。因此,特定数量的LSTMwAtt模块的使用,在一定程度上增强了RLN的特征关系学习能力,提高了模型诊断的准确率。

      通过消融实验的性能对比,对模型结构和参数的优化,可以提高对某些不易识别的故障模式的判别能力,即使在训练样本较少的前提下,依然在真实独立的测试集上取得了较为理想的诊断结果,从而也说明了文中算法具有较强的适应性和泛华性,能够为基于红外的电路板故障诊断系统提供科学合理的诊断结论。

    • 为了能够利用电路板红外温度序列数据实现电路板故障的诊断,基于电路板红外图像自建了芯片区域温度序列数据集,并提出了一种将FEN和RLN并行的电路板故障诊断算法模型。其中,FEN基于多尺度膨胀卷积构建,通过改变膨胀因子使得网络在不增加训练参数的前提下构建更大层次的感受野,学习并获取温度序列数据在不同尺度上更为丰富的局部特征表示;RLN基于嵌入注意力机制的LSTM网络构建,通过控制温度序列信息的传递学习特征重要性、分配注意力权重,学习温度序列数据中各特征表示间的内在关系。实验结果表明,与传统的基于深度学习的分类算法相比,所提出的算法模型在自建电路板芯片温度序列数据集上获得了较高的分类准确率,性能得到了有效的提升。然而,由于自建数据集的规模还比较小,因此模型用在全新的测试数据集时,分类准确率有所降低。在自建数据集不断扩大的前提下,该模型可以直接布置于电路板故障诊断系统中,以快速完成目标电路板故障的诊断与分类。

Reference (28)

Catalog

    /

    DownLoad:  Full-Size Img  PowerPoint
    Return
    Return