Volume 52 Issue 10
Oct.  2023
Turn off MathJax
Article Contents

Shen Wenli, Tan Qiulin, Zhang Lei, Xie Hao. Design of speckle calculation recombination spectrometer based on chalcogenide glass-polymethyl methacrylate spectroscopic structure[J]. Infrared and Laser Engineering, 2023, 52(10): 20230038. doi: 10.3788/IRLA20230038
Citation: Shen Wenli, Tan Qiulin, Zhang Lei, Xie Hao. Design of speckle calculation recombination spectrometer based on chalcogenide glass-polymethyl methacrylate spectroscopic structure[J]. Infrared and Laser Engineering, 2023, 52(10): 20230038. doi: 10.3788/IRLA20230038

Design of speckle calculation recombination spectrometer based on chalcogenide glass-polymethyl methacrylate spectroscopic structure

doi: 10.3788/IRLA20230038
Funds:  National Nature Science Foundation of China (52105594, 51821003); Fundamental Research Program of Shanxi Province (20210302124274); Preferential Support Project for Scientific and Technological Activities of Overseas Students in Shanxi Province (20210011); Shanxi "1331 Project" Keys Subjects Construction
  • Received Date: 2023-01-29
  • Rev Recd Date: 2023-05-05
  • Publish Date: 2023-10-24
  •   Objective  After nearly half a century of development, infrared spectroscopy has been widely used in food, medicine, biological diagnosis, agriculture, textile, oil refining and chemical industries. The optical path of the traditional infrared spectrometer is more complex, and often with moving parts, so the requirement of machining accuracy is very high, and the optical components in the optical path are also expensive. These factors make the infrared spectrometer expensive and the stability, reliability and working environment adaptability of the system weak. Small spectrometers have received extensive attention and developed rapidly due to their significant advantages in size, weight, and power consumption. In particular, computational spectral analysis technology based on speckle detection can obtain high-precision spectral information by recording and analyzing the speckle patterns formed by scattering elements on the measured light. Speckle computational reconstruction spectrometer has the advantages of both small size and high resolution, and because the preparation of scatterers is simpler and costs less than various strictly designed micro-nano structures or materials with different components, it is a spectral analysis technology with great application potential.   Methods  A set of speckle calculation recombination spectrometer system is designed in this paper. The spectroscopic structure was designed using chalcogenide glass IG2 and polymethyl methacrylate (PMMA) materials. The uniform random distribution method of these two materials was studied. The disordered scattering structure was constructed based on the difference in refractive index changes of the two materials (Fig.3). The spectrometer system was tested by Tracepro software design simulation experiment.  Results and Discussions  The speckle calculation recombination spectrometer system adopts a special spectroscopic structure. The spectroscopic structure is designed based on the uniform random distribution of chalcogenide glass IG2 and polymethyl methacrylate (PMMA), which can generate speckles with uniform distribution and high contrast, and has good spectroscopic effect (Fig.6). Multiple sets of simulation experiments were designed by Tracepro software to verify the performance of the system. In the 1-10.9 μm wavelength range, the relative error of the simulation results of the test light composed of the calibration light is 1.29% (Fig.7). The relative error of the simulation results of the uncalibrated 5.01 μm wavelength monochromatic light is 3.37% (Fig.8). The simulation results of uncalibrated 3 000 K blackbody radiation are fitted by 6-order polynomial. The maximum absolute error of the calculated value is 2.581 6 W, and the maximum absolute error of the fitting curve is 0.678 7 W (Fig.9). In the high-resolution simulation of 1-2 μm wavelength range, the simulation results of 3 000 K, 4 000 K and 5 000 K blackbody radiation are fitted by 6-order polynomial. The maximum relative errors of the fitting curves are 2.07%, 5.32% and 4.28%, respectively (Fig.10). The results of the simulation test show that the system can maintain small error under the condition of wide range or high resolution.   Conclusions  A speckle calculation recombination spectrometer system with working wavelengths of 1-10 μm and 1 000-2 000 nm was designed. The system is characterized by small size, no moving components, simple and stable structure, low production cost and easy production. The system function was simulated by using Tracepro software. The resolution reached 0.1 μm in the spectral range of 1-10.9 μm, and the maximum relative error of the test results was 3.77%. The resolution reaches 10 nm in the spectral range of 1 000-2 000 nm, and the maximum relative error of the test results is 5.32%. The simulation results show that the system has large range, high resolution and low error, and can select the corresponding wavelength range according to the actual situation to meet different application requirements.
  • [1] Yang Z, Albrow-owen T, Cai W, et al. Miniaturization of optical spectrometers [J]. Science, 2021, 371(6528): 480-492.
    [2] Chen K, Zhang B, Guo M, et al. All-optical photoacoustic multigas analyzer using digital fiber-optic acoustic detector [J]. IEEE Transactions on Instrumentation and Measurement, 2020, 69(10): 8486-8493. doi:  10.1109/TIM.2020.2993333
    [3] Beć K B, Grabska J, Huck C W. Principles and applications of miniaturized near‐infrared (NIR) spectrometers [J]. Chemistry A European Journal, 2021, 27(5): 1514-1532. doi:  10.1002/chem.202002838
    [4] Pu Y, Pérez-marín D, O’shea N, et al. Recent advances in portable and handheld NIR spectrometers and applications in milk, cheese and dairy powders [J]. Foods, 2021, 10(10): 2377. doi:  10.3390/foods10102377
    [5] Klijn M E, Hubbuch J. Application of ultraviolet, visible, and infrared light imaging in protein-based biopharmaceutical formulation characterization and development studies [J]. European Journal of Pharmaceutics and Biopharmaceutics, 2021, 165(3): 319-336.
    [6] Redding B, Popoff S M, Cao H. All-fiber spectrometer based on speckle pattern reconstruction [J]. Optics Express, 2013, 21(5): 6584-6600. doi:  10.1364/OE.21.006584
    [7] 郑麒麟, 文龙, 陈沁. 基于散斑检测的微型计算光谱仪研究进展[J]. 光电工程, 2021, 48(3): 4-18.

    Zheng Q, Wen Long, Chen Qin. Research progress of computational microspectrometer based on speckle inspection [J]. Opto-Electronic Engineering, 2021, 48(3): 4-18. (in Chinese)
    [8] 柏连发, 王旭, 韩静, 等. 新型光谱测量技术发展综述[J]. 红外与激光工程, 2019, 48(06): 11-21.

    Bai Lianfa, Wang Xu, Han Jing, et al. Development review of new spectral measurement technology [J]. Infrared and Laser Engineering, 2019, 48(6): 0603001. (in Chinese)
    [9] Qiao Q, Liu X, Ren Z, et al. MEMS-enabled on-chip computational mid-infrared spectrometer using silicon photonics [J]. ACS Photonics, 2022, 9(7): 2367-2377. doi:  10.1021/acsphotonics.2c00381
    [10] Yang T, Peng J, Ho H, et al. Visible-infrared micro-spectrometer based on a preaggregated silver nanoparticle monolayer film and an infrared sensor card[C]//2017 International Conference on Optical Instruments and Technology: Optical Systems and Modern Optoelectronic Instruments. SPIE, 2018, 10616: 267-274.
    [11] Çetindağ Ş K, Toy M F, Ferhanoğlu O, et al. A speckle-enhanced prism spectrometer with high dynamic range [J]. IEEE Photonics Technology Letters, 2018, 30(24): 2139-2142. doi:  10.1109/LPT.2018.2879247
    [12] Meng Z, Li J, Yin C, et al. Multimode fiber spectrometer with scalable bandwidth using space-division multiplexing [J]. AIP Advances, 2019, 9(1): 015004. doi:  10.1063/1.5052276
    [13] Meng J, Cadusch J J, Crozier K B. Detector-only spectrometer based on structurally colored silicon nanowires and a reconstruction algorithm [J]. Nano Letters, 2019, 20(1): 320-328.
    [14] 李哲, 张志荣, 孙鹏帅, 夏滑, 罗渊敏, 庞涛, 董凤忠. 利用TDLAS技术的多点甲烷气体全量程监测[J]. 红外与激光工程, 2017, 46(09): 243-249.

    Li Zhe, Zhang Zhirong, Sun Pengshuai, et al. Multi-point full range monitoring of methane based on TDLAS technology [J]. Infrared and Laser Engineering, 2017, 46(9): 0917009. (in Chinese)
    [15] 刘灿, 靳长明, 谭秋林, 张磊, 张雅楠. 具有温度补偿的非分光红外CO2传感器设计[J]. 红外与激光工程, 2022, 51(03): 194-200.

    Liu Can, Jin Changming, Tan Qiulin, et al. Design of non-dispersive infrared CO2 sensor with temperature compensation [J]. Infrared and Laser Engineering, 2022, 51(3): 20210764. (in Chinese)
    [16] Zhang T, Wang Z, Yu T, et al. Modeling and prediction of generated local surface profile for ultrasonic vibration-assisted polishing of optical glass BK7 [J]. Journal of Materials Processing Technology, 2021, 289: 116933. doi:  10.1016/j.jmatprotec.2020.116933
    [17] Carcreff J, Cheviré F, Lebullenger R, et al. Investigation on chalcogenide glass additive manufacturing for shaping mid-infrared optical components and microstructured optical fibers [J]. Crystals, 2021, 11(3): 228. doi:  10.3390/cryst11030228
  • 加载中
通讯作者: 陈斌, bchen63@163.com
  • 1. 

    沈阳化工大学材料科学与工程学院 沈阳 110142

  1. 本站搜索
  2. 百度学术搜索
  3. 万方数据库搜索
  4. CNKI搜索

Figures(10)

Article Metrics

Article views(104) PDF downloads(35) Cited by()

Related
Proportional views

Design of speckle calculation recombination spectrometer based on chalcogenide glass-polymethyl methacrylate spectroscopic structure

doi: 10.3788/IRLA20230038
  • 1. Science and Technology on Electronic Test & Measurement Laboratory, North University of China, Taiyuan 030051, China
  • 2. Key Laboratory of Instrumentation Science & Dynamic Measurement, Ministry of Education, North University of China, Taiyuan 030051, China
Fund Project:  National Nature Science Foundation of China (52105594, 51821003); Fundamental Research Program of Shanxi Province (20210302124274); Preferential Support Project for Scientific and Technological Activities of Overseas Students in Shanxi Province (20210011); Shanxi "1331 Project" Keys Subjects Construction

Abstract:   Objective  After nearly half a century of development, infrared spectroscopy has been widely used in food, medicine, biological diagnosis, agriculture, textile, oil refining and chemical industries. The optical path of the traditional infrared spectrometer is more complex, and often with moving parts, so the requirement of machining accuracy is very high, and the optical components in the optical path are also expensive. These factors make the infrared spectrometer expensive and the stability, reliability and working environment adaptability of the system weak. Small spectrometers have received extensive attention and developed rapidly due to their significant advantages in size, weight, and power consumption. In particular, computational spectral analysis technology based on speckle detection can obtain high-precision spectral information by recording and analyzing the speckle patterns formed by scattering elements on the measured light. Speckle computational reconstruction spectrometer has the advantages of both small size and high resolution, and because the preparation of scatterers is simpler and costs less than various strictly designed micro-nano structures or materials with different components, it is a spectral analysis technology with great application potential.   Methods  A set of speckle calculation recombination spectrometer system is designed in this paper. The spectroscopic structure was designed using chalcogenide glass IG2 and polymethyl methacrylate (PMMA) materials. The uniform random distribution method of these two materials was studied. The disordered scattering structure was constructed based on the difference in refractive index changes of the two materials (Fig.3). The spectrometer system was tested by Tracepro software design simulation experiment.  Results and Discussions  The speckle calculation recombination spectrometer system adopts a special spectroscopic structure. The spectroscopic structure is designed based on the uniform random distribution of chalcogenide glass IG2 and polymethyl methacrylate (PMMA), which can generate speckles with uniform distribution and high contrast, and has good spectroscopic effect (Fig.6). Multiple sets of simulation experiments were designed by Tracepro software to verify the performance of the system. In the 1-10.9 μm wavelength range, the relative error of the simulation results of the test light composed of the calibration light is 1.29% (Fig.7). The relative error of the simulation results of the uncalibrated 5.01 μm wavelength monochromatic light is 3.37% (Fig.8). The simulation results of uncalibrated 3 000 K blackbody radiation are fitted by 6-order polynomial. The maximum absolute error of the calculated value is 2.581 6 W, and the maximum absolute error of the fitting curve is 0.678 7 W (Fig.9). In the high-resolution simulation of 1-2 μm wavelength range, the simulation results of 3 000 K, 4 000 K and 5 000 K blackbody radiation are fitted by 6-order polynomial. The maximum relative errors of the fitting curves are 2.07%, 5.32% and 4.28%, respectively (Fig.10). The results of the simulation test show that the system can maintain small error under the condition of wide range or high resolution.   Conclusions  A speckle calculation recombination spectrometer system with working wavelengths of 1-10 μm and 1 000-2 000 nm was designed. The system is characterized by small size, no moving components, simple and stable structure, low production cost and easy production. The system function was simulated by using Tracepro software. The resolution reached 0.1 μm in the spectral range of 1-10.9 μm, and the maximum relative error of the test results was 3.77%. The resolution reaches 10 nm in the spectral range of 1 000-2 000 nm, and the maximum relative error of the test results is 5.32%. The simulation results show that the system has large range, high resolution and low error, and can select the corresponding wavelength range according to the actual situation to meet different application requirements.

    • 光谱仪和光谱分析法是广泛使用的化学计量学分析工具和方法[1],光谱仪非常适合在大量性质相对均匀样品的分析中使用,常被用于气体分析[2]、药物分析[3]、乳制品检测[4]、生物制药[5]等多个领域。传统光谱仪主要是利用分光元件实现不同波长光的分离,通过探测分离后的光,重组还原光谱。相比这种一对一的光谱-空间映射模式,利用一对多映射模式的散斑计算重组光谱仪能在相同成本下实现更小的尺寸和质量、更高的精度和分辨率以及更大的量程[6-7]。作为快照型光谱仪,它还具有探测速度快、无需扫描、光通量大和性能稳定的优点[8],发展前景良好。波长范围和分辨率互相影响,高分辨率意味着窄波长范围。2022年,Qiao Qifeng等人通过可重构波导耦合器的时域调制实现了3.7~4.05 μm波长范围内3 nm分辨率的多色光重建[9]。2017年,杨涛等人设计的基于空间散射结构的微型光谱仪分辨率达到了0.2 nm[10]。2018年,Civitci Fehmi等人将棱镜结构和散斑光谱法结合,设计了一款高分辨率的散斑增强棱镜光谱仪,分辨率达到了17 pm,动态范围为44500[11]。2019年,Meng Ziyi等人提出了多芯光纤加时序耦合的技术方案,在波长1550 nm处实现了30 nm带宽和0.02 nm分辨率[12]。2020年,Meng Jiajun等人利用硅纳米线光电探测器阵列设计的散斑检测光谱仪,在400~800 nm的范围内分辨率可达6 nm[13]

      文中选用硫系玻璃和聚甲基丙烯酸甲酯(PMMA)材料设计了一个红外波段内的无序散射结构,用散斑计算重组的方法构建了光谱仪系统,并通过仿真实验对系统的各项性能进行了验证和分析。该系统可根据标定输入得到不同的光谱-空间映射,两组标定可实现的最大光谱范围为1~10.9 μm,最高分辨率可达10 nm,能满足烷烃、烯烃、CO和CO2等多种物质探测的需要[14-15]。该系统体积小,无移动组件,结构简单稳定,制作成本低,易于生产,后续可设计为手持式光谱仪,具有很好的应用前景。

    • 重组光谱仪通常采用特制的散射元件将入射光在空间上分成不同强度的分量,再用探测器阵列对每个分量进行识别,最后通过计算重新构建入射光的光谱。重组光谱仪散射元件单输入多输出的结构会使每个输入都有一组与之对应的输出,将被测光的输出表示为标定光输出的线性组合,对标定输入进行同种线性组合即可还原被测光光谱。

      当使用n个线性无关的输入光进行标定时,会从m个探测器组成的阵列中得到一个n×m的标定矩阵,如图1所示。被测光也会形成一组对应的输出,该输出可以通过计算得到,如公式(1)、(2)所示:

      式中:I代表输入的标定光阵列;D为标定矩阵;Ix为被测光的波长向量;Dx为被测光所对应的探测矩阵;A为根据DDx计算得到的行向量,代表输入光的加权系数,通过解方程组的方式求得A之后,便可以通过标定光阵列I来还原被测光Ix。计算重组法的光谱仪分辨率受探测器的点阵数m和用于标定的输入光数n影响,由标定矩阵D的秩决定,因此,计算量也会随着分辨率的增加而增加。当量程为λ1、标定矩阵秩为d时,该光谱仪分辨率为λ1/d

      Figure 1.  Principle of speckle reconstruction

    • 该散斑重组光谱仪主要由入射光路、分光结构和探测器阵列组成,如图2所示。入射光路包括光源、聚光镜和物箱,光源发出的探测光通过聚光镜汇聚,进入装有被测物的物箱。探测光通过输入光路后,进入分光结构再由探测器阵列接收形成散斑图。将散斑图导入计算机,通过计算即可复现光谱。

      Figure 2.  Principle diagram of speckle reconstruction spectrometer

      采用Tracepro软件进行仿真,选用几何射线追踪。温度设为25 ℃,探测器阵列接收面设置为全吸收无反射,反射镜表面反射率设置为95%,光源表面设置为垂直表面入射。分光结构现状为球锥体,如图3所示。为了防止入射光从随机分布的IG2缝隙中通过,在探测器上形成误导性散斑,在输入端设计了一个预散射结构,使光线在进入无序散射结构前进行初步散射,以达到更好的散射效果。无序散射结构以PMMA为熔铸材料,在熔铸时放入球状硫系玻璃,并使之随机均匀分布。椎体侧面为反射镜,以提高输入光的利用率。相比聚碳酸脂(PC)、聚苯乙烯(PS)、苯乙烯和丙烯酸脂的共聚物(NAS)等材料,PMMA材料具有更高的透射率和更低的浑浊度,其透射率可达92%,浑浊度低于2%,选用PMMA材料可以减少光线在椎体内部因多次反射而造成的损失。同时,PMMA具有良好的热塑性,其熔点约为130~140 ℃,远低于光学玻璃的熔点(1000 ℃以上),使得球状的光学玻璃可以在熔融的PMMA液体中保持稳定的形状,实现两种材料的无间结合。

      Figure 3.  Simulation model diagram of spectroscopic structure

      光学玻璃选用德国Vitron公司生产的硫系玻璃IG2,不同于BK7等其他光学玻璃的高硬度和低抗裂性[16],硫系玻璃具有良好的成型能力,可采用精密玻璃成型工艺和3D打印机技术制成复杂几何图形,成本低,是良好的红外光学晶体材料替代品[17],同时IG2光学玻璃的消光系数低于10−6,即使光线在其中进行多次反射也不会有很大的损耗。

      两种材料折射率-波长关系如图4所示。根据菲涅耳方程,s偏振光和p偏振光的反射率-折射率关系如公式(3)、(4)所示:

      Figure 4.  Refractive index-wavelength diagram of IG2 material and PMMA material

      式中:${R}_{{\rm{s}}}$代表s偏振光的反射率;${R}_{{\rm{p}}}$代表p偏振光的反射率;$ {n}_{1} $为入射介质的折射率;$ {n}_{2} $为出射介质的折射率;$ {\theta }_{1} $为入射角;$ {\theta }_{2} $为折射角。文中选用的光属于无偏振光,无偏振光的两种偏振相等,因此反射率选用二者均值表示,即$ R $=(${R}_{{\rm{p}}}$+${R}_{{\rm{s}}}$)/2,$ {n}_{1} $和$ {n}_{2} $的差值越大则反射率越大。由图4可以看出,IG2折射率约为2.5,PMMA折射率约为1.5,二者差距较大,因此两种材料间的反射率也会较大。大的反射率可以提高空间使用率,使输入光在散射结构中散射更充分。

      Figure 5.  Unevenly distributed random numbers generated by spherical coordinates

      Figure 6.  Two distributions and simulation results. (a) Non-uniform distribution of clustering towards the centre; (b) Simulation results of non-uniformly distributed 1 μm input; (c) Simulation results of non-uniformly distributed 1.01 μm input; (d) Uniform distribution; (e) Simulation results of uniformly distributed 1 μm input; (f) Simulation results of uniformly distributed 1.01 μm input

      空间无序散射结构是该光谱仪设计中需要解决的关键问题,合适的无序结构能够使得输出均匀地分布在整个探测器阵列上,而不是局限于探测器阵列的某一部分,从而提高光谱仪精度。散射结构整体为球锥体,故选择球坐标系设计其几何结构。PMMA球锥体半径为100 mm,中心角度设为90°,IG2散光球数量太少会导致光线散射不充分,探测器阵列的散斑对比度降低,从而降低系统精度;数量太多又会增加光线的反射次数,使分光结构吸收更多的能量,导致探测器接收的能量减少。综合考虑,IG2散光球半径选为5 mm,球锥体中可放置约80个散光球。将球的中心设为坐标原点,椎体轴线设为z轴,则该球锥体内各点坐标满足公式(5):

      式中:$ r\mathrm{、}\theta \mathrm{和}\varphi $分别代表各点在球坐标系中的半径、极角和方位角。利用软件分别生成(0, 1)之间的三组随机数,每组1000个,记为${a}$、${b}$、${c}$,再将生成的随机数对应到球坐标下,最后由球坐标转化为直角坐标,如公式(6)所示:

      式中:$ x $、$ y $和z分别代表直角坐标对应的坐标轴。结果如图5所示,随机点分布不均匀,主要集中在原点和z轴附近,这是因为在球坐标系中,体积的微元为${\rm{d}}V =$${r}^{2}\mathrm{sin}\theta {\rm{d}}r{\rm{d}}\theta {\rm{d}}\varphi$,会受$ r $和$ \theta $取值的影响,所以在$\varphi$、$ \theta $和$ r $空间中均匀分布的随机点无法直接转化成$ x $、$ y $和z空间中的均匀分布点。考虑球坐标的定义,如果令每个球面上的点满足均匀分布,同时不同半径的球面点数与球表面积成正比,那么就可以得到直角坐标系对应的均匀分布。

      公式(7)、(8)是对球面概率进行积分的表达式:

      式中:S代表球面;$ R $为球面的半径;$ p $为球面上每个点的概率,$ p=(1/4\pi {R}^{2}) $;$f(\theta,\varphi )$为联合概率密度函数。对比公式(7)、(8),可以得到$ f(\theta ,\varphi )=(\mathrm{sin}\theta )/4\pi $,则有公式(9)、(10):

      式中:${f}_{\varphi }$和$ {f}_{\theta } $代表$\varphi$和$ \theta $的边缘概率密度函数。根据公式(9)、(10),${f}_{\varphi }$为常数,因此其分布函数也是常数,符合均匀分布的要求。而$ {f}_{\theta } $会随着$ \theta $的值变化而变化,对$ {f}_{\theta } $进行积分得到分布函数$ {F}_{\theta }=(1-\mathrm{cos}\theta )/2 $,计算它的反函数${{F}^{-1}}_{\theta }={\mathrm{arccos}}(1-2\theta )$,将反函数代入$ \theta $的取值可以使分布函数的值变为1,从而实现某个球面上的均匀分布。球面积与半径为平方关系,因此,在取点时代入去常量后的反函数$ {{F}^{-1}}_{r}=\sqrt{r} $即可。最后,球坐标到直角坐标的转化为公式(11):

      分别将两种随机分布得到的坐标取整,去掉与边缘距离低于5 mm的点,为了防止小球位置重合,再去掉距离小于10 mm的点位,最后保留80个点,聚集分布的结果如图6(a)所示,均匀分布的结果如图6(d)所示,图6(b)、(c)分别为用1 μm和1.01 μm波长输入对聚集分布结构进行仿真得到的散斑图,图6(e)、(f)分别为用1 μm和1.01 μm波长输入对均匀分布结构进行仿真得到的散斑图。

      对比图6(b)、(c)和图6(e)、(f)可以看出,聚集分布结构的分光效果很不理想,非中心处的光照强度非常低,当输入变化时,这些暗点的变化可能会因为太小而无法分辨,从而使测量出现较大的误差。而均匀分布结构的散斑对比度大,暗点和亮斑较为均匀且随机地分布在圆形探测器阵列上。当输入变化时,可以通过亮斑处多个探测器的对比识别输入的变化。在使用同一探测器的情况下识别更微小的变化,这也是散斑重组法的优势之一。

    • 选用了两组输入对其进行标定,分别用于验证宽量程和高分辨率的情况。第一组标定用波长1~10.9 μm的单色光,每隔0.1 μm取一个波长作为输入,第二组标定用波长1000~2 000 nm的单色光,每隔10 nm取一个波长。每个波长的辐射通量都定为0.1 W,光线数设为10000条,最小光线数定为10,合计每组100个输入作为标定光阵列。

      将100个标定输入对应100个辐照图的数据导出,对每个辐照图依次提取每一行的数据,得到100个1×2500的列向量,将它们组合成100×2500的标定矩阵D1。为了方便计算,仅保留D1中100个线性无关的列向量并生成100×100的非奇异矩阵D2作为新的标定矩阵。则由公式(1)可得:

      式中:$ {{D}}_{2}^{-1} $代表D2的逆矩阵。由于标定光为连续的100个单色光,可以直接将$ \mathit{A} $作为纵坐标,标定光阵列作为横坐标。根据设置,第一组标定得到的系统分辨率为0.1 μm,量程为1~10.9 μm;第二组标定得到的系统分辨率为10 nm,量程为1~2 μm,探测器可探测的最小辐射强度为0.01 W。

    • 设计了三组外部光源对1~10.9 μm波长范围的系统进行仿真测试,分别为由标定光组成的测试光、非标定5.01 μm波长的单色光和非标定3000 K黑体辐射,用于验证计算重组的正确性,并根据测量结果验证光谱仪的分辨率,计算相应的精度和误差,最后对结果拟合,降低系统误差。

      选用标定光组成的测试光进行仿真测试,将得到的输出辐照度数据导出并按照D1列向量的对应位置分别取100个数作为输出,根据公式(12)计算并绘制光谱图,输入光谱和测量结果如图7所示。

      Figure 7.  Spectral input and measurement results of test light

      当输入为标定光组成的光谱时,计算值非常接近输入值。最大相对误差为1.29%,误差是因为设置识别的最小光线数为10,探测器可探测的最小辐射强度为0.01 W,使得低于0.01 W的辐射通量被忽视,导致无法完全还原。

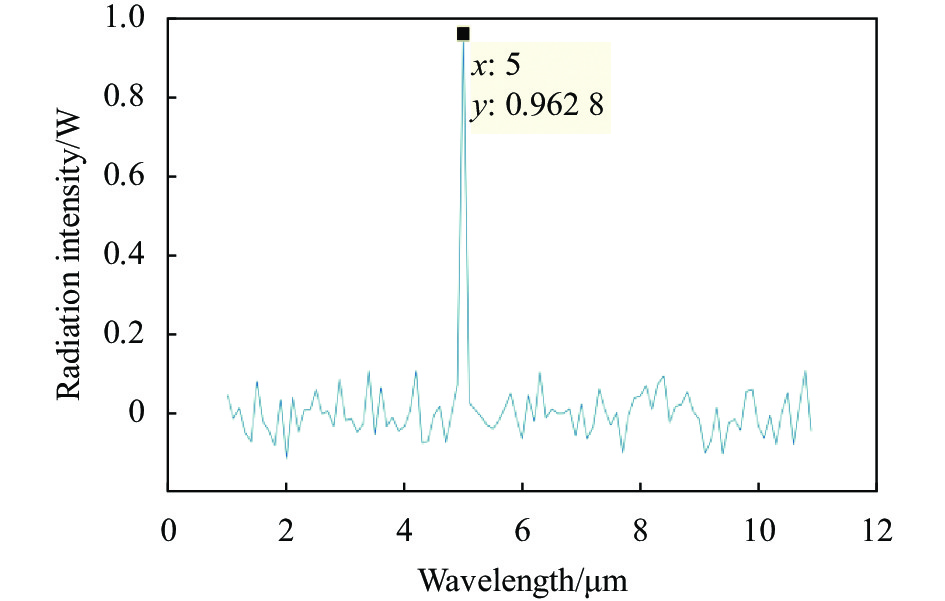
      图8中,输入光不属于标定光阵列,此时出现了较为明显的噪音,受0.1 μm分辨率的限制,本应在5.01 μm波长处的峰值出现在了5 μm处。当输入为1 W时,测量值为0.963 W,相对误差为3.37%。利用相近波段光谱分布的相似性实现了对光程内未标定点位的识别。

      Figure 8.  Measurement result of 5.01 μm wavelength

      卤钨灯是最常用的红外光源之一,它覆盖了从紫外到中红外的超宽频谱发射区域,其发光特点近似黑体辐射,因此选用由100条单色光模拟3000 K黑体辐射,输入波段为1~10.9 μm,测量结果如图9所示,计算值的最大绝对误差为2.5816 W,在4~11 μm处的辐射通量几乎为0,相对误差较大。尽管测量值与输入大致相符,但存在较大的误差。通过六阶多项式对输出进行拟合,拟合曲线绝对误差最大值为0.6787 W,有效地降低了绝对误差。

      Figure 9.  Simulation measurement results of 1-10.9 μm wavelength

    • 对1~2 μm的标定直接选用由100条单色光分别模拟的3000 K、4000 K和5000 K黑体辐射作为输入,进行分辨率仿真测试。输入波段限定为1~2 μm,采用六阶多项式对结果进行拟合。如图10所示,最大误差分别为0.198 W、0.45 W和0.57 W,最大相对误差分别为2.07%、5.32%和4.28%。

      Figure 10.  Simulation results of 3000 K, 4000 K and 5000 K blackbody radiation

    • 文中研究了球体空间内均匀随机分布的方法,通过该方法设计了基于硫系玻璃IG2和PMMA的分光结构,并结合散斑计算重组光谱法设计了小型红外光谱仪。采用Tracepro软件对光谱仪进行仿真测试,光谱仪系统在1~10.9 μm光谱范围内分辨率达到了0.1 μm,在1000~2 000 nm光谱范围内分辨率达到了10 nm,最大相对误差为5.32%。通过仿真验证,所设计的光谱仪具备量程大、分辨率高和误差低的优点,并且能根据实际情况选择相应的标定光谱来满足不同的应用需求。

Reference (17)

Catalog

    /

    DownLoad:  Full-Size Img  PowerPoint
    Return
    Return