Volume 53 Issue 1
Jan.  2024
Turn off MathJax
Article Contents

Li Chunyan, Li Danlin, Liu Jihong, Liu Chang, Li Ke, Jiang Jiewei. Research on jitter compensation algorithm in spectral confocal thickness measurement system[J]. Infrared and Laser Engineering, 2024, 53(1): 20230444. doi: 10.3788/IRLA20230444
Citation: Li Chunyan, Li Danlin, Liu Jihong, Liu Chang, Li Ke, Jiang Jiewei. Research on jitter compensation algorithm in spectral confocal thickness measurement system[J]. Infrared and Laser Engineering, 2024, 53(1): 20230444. doi: 10.3788/IRLA20230444

Research on jitter compensation algorithm in spectral confocal thickness measurement system

doi: 10.3788/IRLA20230444
Funds:  National Natural Science Foundation of China (62276210); Natural Science Foundation of Shaanxi Province (2022JM-387); Key Research and Development Plan of Shaanxi Province (2020GY-127)
  • Received Date: 2023-07-14
  • Rev Recd Date: 2023-09-20
  • Publish Date: 2024-01-25
  • In order to obtain multi-point data of the sample, the spectral confocal displacement sensing system will produce jitter effect when moving the measurement, causing the drift of the measurement data. Based on the realized spectral confocal thickness measurement system, the effect of jitter is studied and the jitter compensation algorithm is explored; Firstly, based on the spectral confocal thickness measurement model and the presence of jitter when the probe is tilted to a certain extent relative to the optical axis, the relational model of the effect of jitter on the thickness measurement is deduced, and the thicknesses of four kinds of samples with different degrees of random jitter are analyzed by Monte Carlo simulation method. The analyzed results are compared with the Monte Carlo simulation results to verify the correctness of the expression of the thickness probability density function. The results show that the jitter effect leads to a degradation of the measurement performance, especially when the sample thickness is large; In the case of a large standard deviation of jitter, the measurement of thinner samples has a better anti-jitter performance. Then, in order to compensate the effect of jitter on the measurement results, it is proposed to use Savitzky-Golay filtering and Gaussian fitting to realize the filtering and the extraction of the peak wavelength of the spectral signal, and the jitter error compensation algorithm is established; Finally, experimental measurements were conducted on a sample with a thickness of (1.0±0.1) mm, and the average thickness was measured to be 1.064 0 mm. The compensated relative standard deviation was 0.29%, verifying the effectiveness of the jitter compensation algorithm. This research has some guiding significance to improve the system measurement stability and measurement accuracy.  Objective  With the development of miniature integrated optical instruments such as optical communications and optical sensing, the use of transparent materials is becoming more and more stringent. Highly accurate thickness measurement parameters help guide their precise application and control the performance of related ultra-precision optical instruments, making accurate thickness inspection necessary. Spectral confocal method uses a broad-spectrum light source to irradiate the surface of the object, uses the principle of optical dispersion to make the dispersive objective lens produce axial chromatic aberration, establishes the correspondence between the dispersive distance and the wavelength, and uses a spectrometer to detect the peak wavelength of the spectrum that is focused on the surface of the object and reflected back to get the accurate axial position or micro-displacement data. Such an approach allows to break through the diffraction limit of ordinary optical microscopes. It achieves ultra-high ranging resolution on the nanometer scale and has wide adaptability to environments and materials. When measuring the thickness of transparent materials using the spectral confocal method, the jitter effect alters the refractive properties of the beam entering the sample and random noise is present in the received spectral response curve reflected from the sample surface, which leads to drift of the measurement data. On this basis, the relationship model of the effect of jitter on the spectral confocal thickness measurement is firstly derived in this paper, and the distribution of the thickness probability density function of the sample under different degrees of random jitter is simulated and analyzed by Monte Carlo method. In order to compensate for the effect of jitter on the measurement results, it was proposed in this paper to use Savitzky-Golay filtering and Gaussian fitting to extract the peak wavelength of the spectral signal, and a jitter compensation algorithm was established. Finally, the stability of the measurement results is improved by experimental measurements, and the effectiveness of the algorithm is verified.   Methods  The effect of jitter on thickness measurement of transparent materials is studied in this paper. First, the thickness measurement models of the probe with respect to the optical axis were derived when the probe was not tilted (Fig.2) and tilted (Fig.3), and the influence of jitter on the thickness measurement results was characterized by the optical axis tilt, and simulation analysis was carried out (Fig.4). Then, by comparing thickness measurement errors and jitter standard deviation at different wavelengths (Fig.5), after comparative analysis of various algorithms, spectral noise was filtered by Savitzky-Golay filtering algorithm (Fig.7-8), and peak wavelength of spectral signal was extracted by Gaussian fitting algorithm (Tab.1). An optimized jitter compensation algorithm is constructed. Finally, the validity of Savitzky-Golay filtering algorithm and Gaussian fitting algorithm for jitter compensation in spectral confocal thickness measurement is verified (Tab.2).   Results and Discussions   The thickness of the sample under static conditions depends only on the focusing wavelength, the angle of incidence and the refractive index of the transparent material. Random jitter angle is the main source of thickness measurement error, and the thickness measurement error caused by sensor probe jitter should not be neglected. By analyzing the effect of random jitter angle on the measurement error, a jitter compensation mechanism is established to reduce the measurement error. Thickness measurement data is non-central cardinality distribution, the jitter effect will lead to the measurement performance degradation, especially in the case of larger sample thickness; In the case of larger jitter standard deviation, thinner samples have better anti-jitter performance. The peak wavelength of the spectral signal is extracted by S-G filtering and Gaussian fitting, which can reduce the error caused by the mechanical vibration of the probe and improve the measurement stability of the confocal spectroscopy measurement system.   Conclusions  In this paper, based on the spectral confocal method to realize the thickness measurement of transparent materials, the jitter effect generated by the movement will make the measurement data drift, and the influence of the jitter effect on the thickness measurement is systematically studied. Firstly, the relationship model of the effect of jitter on thickness measurement is established based on the principle of spectral confocal thickness measurement system, theoretical derivation is carried out, and MC simulation is used for simulation verification. Secondly, the thickness PDF and MC simulation results are compared and analyzed to verify the correctness of the thickness PDF expression. The results show that the jitter effect leads to a degradation of the measurement performance, especially when the sample thickness is large; In the case of a large standard deviation of jitter, the measurement of thinner samples has a better anti-jitter performance. In order to correct or compensate the effect of jitter on the measurement results, it is proposed to use S-G filtering and Gaussian fitting to realize the random noise filtering and the extraction of the peak wavelength of the spectral signal, and the jitter error compensation algorithm is modeled. Finally, experimental measurements were conducted on a sample with a thickness of (1.0±0.1) mm. Under stable conditions, the average thickness was measured to be 1.064 0 mm. The relative standard deviation of the moving measurement results was reduced from 1.86% before compensation to 0.29% after compensation, verifying the effectiveness of the jitter error compensation algorithm proposed in this paper and proposing improvement measures. The results of this paper have certain guiding significance for optimizing the system structure and further improving the performance of the system, and have certain advancing effect on the practical application of the spectral confocal displacement sensing system for stable measurement.
  • [1] Fang F Z, Zhang X D, Weckenmann A, et al. Manufacturing and measurement of freeform optics [J]. CIRP Annals, 2013, 62(2): 823-846. doi:  10.1016/j.cirp.2013.05.003
    [2] Yu Qing, Zhang Kun, Zhou Ruilan, et al. Method of thickness measurement for transparent specimens with chromatic confocal microscopy [J]. Applied Optics, 2018, 57(33): 9722-9728. doi:  10.1364/AO.57.009722
    [3] Jonkman J, Brown C M, Wright G D, et al. Tutorial: guidance for quantitative confocal microscopy [J]. Nature Protocols, 2020, 15(5): 1585-1611. doi:  10.1038/s41596-020-0313-9
    [4] Nouira H, El-hayek N, Yuan X, et al. Characterization of the main error sources of chromatic confocal probes for dimensional measurement [J]. Measurement Science and Technology, 2014, 25(4): 044011. doi:  10.1088/0957-0233/25/4/044011
    [5] Fuerst M E, Csencsics E, Haider C, et al. Confocal chromatic sensor with an actively tilted lens for 3D measurement [J]. Journal of the Optical Society of America A, 2020, 37(9): B46. doi:  10.1364/JOSAA.394212
    [6] Lin Jianian, Cheng Zongyue, Gan Wenbiao, et al. Jitter suppression for resonant galvo based high-throughput laser scanning systems [J]. Optics Express, 2020, 28(18): 26414. doi:  10.1364/OE.402883
    [7] Bottenus N, Long W, Zhang H K, et al. Feasibility of swept synthetic aperture ultrasound imaging [J]. IEEE Transactions on Medical Imaging, 2016, 35(7): 1676-1685. doi:  10.1109/TMI.2016.2524992
    [8] Yao Jianing, Anderson A, Rolland J P. Point-cloud noncontact metrology of freeform optical surfaces [J]. Optics Express, 2018, 26(8): 010242. doi:  10.1364/OE.26.010242
    [9] 朱万彬, 钟俊, 莫仁芸, 等. 光谱共焦位移传感器物镜设计[J]. 光电工程, 2010, 37(8): 62-66. doi: 10.3969/j.issn.1003-501 X.2010.08.012

    Zhu Wanbin, Zhong Jun, Mo Renyun, et al. Design of Spectral Confocal Chromatic Displacement Sensor Objective [J]. Opto-Electronic Engineering, 2010, 37(8): 62-66. (in Chinese) doi:  10.3969/j.issn.1003-501X.2010.08.012
    [10] Molesini G, Pedrini G, Poggi P, et al. Focus-wavelength encoded optical profilometer [J]. Optics Communications, 1984, 49(4): 229-233. doi:  10.1016/0030-4018(84)90179-2
    [11] Yu Qing, Zhang Kun, Zhou Ruilan, et al. Calibration of a chromatic confocal microscope for measuring a colored specimen [J]. IEEE Photonics Journal, 2018, 10(6): 1-9. doi:  10.1109/JPHOT.2018.2875562
    [12] Chen H, Chen L. Full-field chromatic confocal microscopy for surface profilometry with sub-micrometer accuracy [J]. Optics and Lasers in Engineering, 2023, 161(2): 1-13. doi:  10.1016/j.optlaseng.2022.107384
    [13] Li Chunyan, Li Gengpeng, Liu Jihong, et al. Influence of eccentricity and tilt of radial grin lens on its thickness measurement by chromatic confocal technology [J]. Optical Engineering, 2021, 60(9): 094107. doi:  10.1117/1.OE.60.9.094107
    [14] 李春艳, 李庚鹏, 刘继红, 等. 基于GRNN的光谱共焦位移测量方法分析与研究[J]. 光子学报, 2022, 51(3): 0330001. doi:  10.3788/gzxb20225103.0330001

    Li Chunyan, Li Gengpeng, Liu Jihong, et al. Analysis and research on spectral confocal displacement measurement method based on GRNN [J]. Acta Photonica Sinica, 2022, 51(3): 0330001. (in Chinese) doi:  10.3788/gzxb20225103.0330001
    [15] Yura H T. Optimum truncation of a gaussian beam in the presence of random jitter [J]. Journal of the Optical Society of America A, 1995, 12(2): 375-379. doi:  10.1364/JOSAA.12.000375
    [16] Darafon A, Warkentin A, Bauer R. Characterization of grinding wheel topography using a white chromatic sensor. international journal of machine tools and manufacture [J]. International Journal of Machine Tools and Manufacture, 2013, 70: 22-31. doi:  10.1016/j.ijmachtools.2013.03.003
    [17] 马小军, 高党忠, 杨蒙生, 等. 应用白光共焦光谱测量金属薄膜厚度[J]. 光学精密工程, 2011, 19(1): 17-22. doi:  10.3788/OPE.20111901.0017

    Ma Xiaojun, Gao Dangzhong, Yang Mengsheng, et al. Measurement of thickness of metal thin film by using chromatic confocal spectral technology [J]. Optics and Precision Engineering, 2011, 19(1): 17-22. (in Chinese) doi:  10.3788/OPE.20111901.0017
    [18] Coutu D L, Kokkallaris K D, Kunz L, et al. Multicolor quantitative confocal imaging cytometry [J]. Nature Methods, 2018, 15: 39-46. doi:  10.1038/nmeth.4503
  • 加载中
通讯作者: 陈斌, bchen63@163.com
  • 1. 

    沈阳化工大学材料科学与工程学院 沈阳 110142

  1. 本站搜索
  2. 百度学术搜索
  3. 万方数据库搜索
  4. CNKI搜索

Figures(9)  / Tables(2)

Article Metrics

Article views(96) PDF downloads(27) Cited by()

Related
Proportional views

Research on jitter compensation algorithm in spectral confocal thickness measurement system

doi: 10.3788/IRLA20230444
  • School of Electronic Engineering, Xi'an University of Posts & Telecommunications, Xi'an 710121, China
Fund Project:  National Natural Science Foundation of China (62276210); Natural Science Foundation of Shaanxi Province (2022JM-387); Key Research and Development Plan of Shaanxi Province (2020GY-127)

Abstract: In order to obtain multi-point data of the sample, the spectral confocal displacement sensing system will produce jitter effect when moving the measurement, causing the drift of the measurement data. Based on the realized spectral confocal thickness measurement system, the effect of jitter is studied and the jitter compensation algorithm is explored; Firstly, based on the spectral confocal thickness measurement model and the presence of jitter when the probe is tilted to a certain extent relative to the optical axis, the relational model of the effect of jitter on the thickness measurement is deduced, and the thicknesses of four kinds of samples with different degrees of random jitter are analyzed by Monte Carlo simulation method. The analyzed results are compared with the Monte Carlo simulation results to verify the correctness of the expression of the thickness probability density function. The results show that the jitter effect leads to a degradation of the measurement performance, especially when the sample thickness is large; In the case of a large standard deviation of jitter, the measurement of thinner samples has a better anti-jitter performance. Then, in order to compensate the effect of jitter on the measurement results, it is proposed to use Savitzky-Golay filtering and Gaussian fitting to realize the filtering and the extraction of the peak wavelength of the spectral signal, and the jitter error compensation algorithm is established; Finally, experimental measurements were conducted on a sample with a thickness of (1.0±0.1) mm, and the average thickness was measured to be 1.064 0 mm. The compensated relative standard deviation was 0.29%, verifying the effectiveness of the jitter compensation algorithm. This research has some guiding significance to improve the system measurement stability and measurement accuracy.  Objective  With the development of miniature integrated optical instruments such as optical communications and optical sensing, the use of transparent materials is becoming more and more stringent. Highly accurate thickness measurement parameters help guide their precise application and control the performance of related ultra-precision optical instruments, making accurate thickness inspection necessary. Spectral confocal method uses a broad-spectrum light source to irradiate the surface of the object, uses the principle of optical dispersion to make the dispersive objective lens produce axial chromatic aberration, establishes the correspondence between the dispersive distance and the wavelength, and uses a spectrometer to detect the peak wavelength of the spectrum that is focused on the surface of the object and reflected back to get the accurate axial position or micro-displacement data. Such an approach allows to break through the diffraction limit of ordinary optical microscopes. It achieves ultra-high ranging resolution on the nanometer scale and has wide adaptability to environments and materials. When measuring the thickness of transparent materials using the spectral confocal method, the jitter effect alters the refractive properties of the beam entering the sample and random noise is present in the received spectral response curve reflected from the sample surface, which leads to drift of the measurement data. On this basis, the relationship model of the effect of jitter on the spectral confocal thickness measurement is firstly derived in this paper, and the distribution of the thickness probability density function of the sample under different degrees of random jitter is simulated and analyzed by Monte Carlo method. In order to compensate for the effect of jitter on the measurement results, it was proposed in this paper to use Savitzky-Golay filtering and Gaussian fitting to extract the peak wavelength of the spectral signal, and a jitter compensation algorithm was established. Finally, the stability of the measurement results is improved by experimental measurements, and the effectiveness of the algorithm is verified.   Methods  The effect of jitter on thickness measurement of transparent materials is studied in this paper. First, the thickness measurement models of the probe with respect to the optical axis were derived when the probe was not tilted (Fig.2) and tilted (Fig.3), and the influence of jitter on the thickness measurement results was characterized by the optical axis tilt, and simulation analysis was carried out (Fig.4). Then, by comparing thickness measurement errors and jitter standard deviation at different wavelengths (Fig.5), after comparative analysis of various algorithms, spectral noise was filtered by Savitzky-Golay filtering algorithm (Fig.7-8), and peak wavelength of spectral signal was extracted by Gaussian fitting algorithm (Tab.1). An optimized jitter compensation algorithm is constructed. Finally, the validity of Savitzky-Golay filtering algorithm and Gaussian fitting algorithm for jitter compensation in spectral confocal thickness measurement is verified (Tab.2).   Results and Discussions   The thickness of the sample under static conditions depends only on the focusing wavelength, the angle of incidence and the refractive index of the transparent material. Random jitter angle is the main source of thickness measurement error, and the thickness measurement error caused by sensor probe jitter should not be neglected. By analyzing the effect of random jitter angle on the measurement error, a jitter compensation mechanism is established to reduce the measurement error. Thickness measurement data is non-central cardinality distribution, the jitter effect will lead to the measurement performance degradation, especially in the case of larger sample thickness; In the case of larger jitter standard deviation, thinner samples have better anti-jitter performance. The peak wavelength of the spectral signal is extracted by S-G filtering and Gaussian fitting, which can reduce the error caused by the mechanical vibration of the probe and improve the measurement stability of the confocal spectroscopy measurement system.   Conclusions  In this paper, based on the spectral confocal method to realize the thickness measurement of transparent materials, the jitter effect generated by the movement will make the measurement data drift, and the influence of the jitter effect on the thickness measurement is systematically studied. Firstly, the relationship model of the effect of jitter on thickness measurement is established based on the principle of spectral confocal thickness measurement system, theoretical derivation is carried out, and MC simulation is used for simulation verification. Secondly, the thickness PDF and MC simulation results are compared and analyzed to verify the correctness of the thickness PDF expression. The results show that the jitter effect leads to a degradation of the measurement performance, especially when the sample thickness is large; In the case of a large standard deviation of jitter, the measurement of thinner samples has a better anti-jitter performance. In order to correct or compensate the effect of jitter on the measurement results, it is proposed to use S-G filtering and Gaussian fitting to realize the random noise filtering and the extraction of the peak wavelength of the spectral signal, and the jitter error compensation algorithm is modeled. Finally, experimental measurements were conducted on a sample with a thickness of (1.0±0.1) mm. Under stable conditions, the average thickness was measured to be 1.064 0 mm. The relative standard deviation of the moving measurement results was reduced from 1.86% before compensation to 0.29% after compensation, verifying the effectiveness of the jitter error compensation algorithm proposed in this paper and proposing improvement measures. The results of this paper have certain guiding significance for optimizing the system structure and further improving the performance of the system, and have certain advancing effect on the practical application of the spectral confocal displacement sensing system for stable measurement.

    • 随着光通信、光传感等微型集成光学仪器的发展,对透明材料的使用要求越来越严格,高精度的厚度测量参数有助于指导其准确应用并把控相关超精密光学仪器的性能,因此需要对厚度进行精确的检测[1]。为实现厚度非接触精密测量,学者们提出了光谱共焦法、激光自动对焦扫描法、光谱干涉法、共面电容法等[2-3];除光谱共焦法外,其他测量方法的主要缺点表现为测量精度低(μm量级)、过程复杂,且光谱干涉法易受杂光、振动等环境干扰导致设备性能不可靠亦无法满足高准确度的测量需求[4]。光谱共焦法使用宽谱光源照射物体表面,利用光学色散原理使色散物镜产生轴向色差,建立色散距离与波长间的对应关系,利用光谱仪探测聚焦于物体表面并反射回来的光谱峰值波长,获得精确的轴向位置或微小位移数据,该方法能够突破普通光学显微镜的衍射极限,达到纳米量级的超高距离测量分辨率,对环境及材料具有广泛的适应性[5]。光谱共焦法在进行透明材料测量时,前后表面均会反射回特定波长的光,根据光谱曲线的两个峰值对应于前后表面的空间位置,即可推算出玻璃或金属薄膜的厚度及其分布情况,因此该方法还具有多表面层析的特点。在测量样品时为了获得多点数据,通常会移动传感器探头或样品,实验发现在对样品进行多点测量时,传感器探头在水平面内横向移动会发生机械抖动[6-8],为降低移动测量时的环境干扰,提高系统稳定性,H Nouira提出一种将探头与外部定位设备结合的精确校准方法,估算了热膨胀、电机以及压电驱动器进行光谱共焦动态探测时的不确定度,可在不进行软件校正的情况下减小探头残差,但需要处理大量的线性化参数[3-5],而抖动对光谱共焦厚度测量的影响还未见有报道。

      采用光谱共焦法实现透明材料厚度测量时,抖动效应会改变光束进入样品的折射特性,使接收到的样品表面反射的光谱响应曲线存在随机噪声,测量数据发生漂移。基于以上,文中首先推导了抖动对光谱共焦厚度测量影响的关系模型,并采用蒙特卡洛(Monte Carlo, MC)方法仿真分析了样品在不同程度随机抖动下的厚度概率密度函数(Probability Density Function, PDF)分布,为补偿抖动对测量结果的影响,文中提出采用Savitzky-Golay滤波及高斯拟合实现光谱信号峰值波长的提取,构建了补偿算法模型;最后通过实验测量,提高了测量结果的稳定性,验证了文中提出算法的有效性。

    • 在使用光谱共焦位移传感技术进行透明材料厚度测量时,色散物镜产生的轴向色差使不同波长的光聚焦在轴向的不同位置,在透明材料的上下两个表面聚焦的光束会返回原来的系统,光谱仪探测聚焦于物体表面并反射回来的色散光波的光谱信息,并利用光谱信息中的波长与轴向位置的对应关系即可解算透明材料的厚度[9]

      图1所示,入射光纤将光源所发出的光传输至色散物镜,色散物镜出射的不同波长的光波在不同的轴向位置处聚焦,当待测样品置于色散物镜的色散区间内时,分别会有特定波长λ1λ2的光波在样品上下表面聚焦并发生反射,沿原来的光路返回通过光纤耦合器到达出射光纤,出射光纤的端面相当于共焦孔,其余未在样品上下表面聚焦的离焦反射光波返回原系统的能量极其微弱,可忽略不计,最后由光谱仪接收反射光谱信息,并传输至计算机,对峰值波长进行准确提取,利用色散物镜产生的波长与轴向聚焦位置之间的函数关系,并结合与被测样品相关的折射率修正公式,即可实现样品厚度的精确解算[10-11]

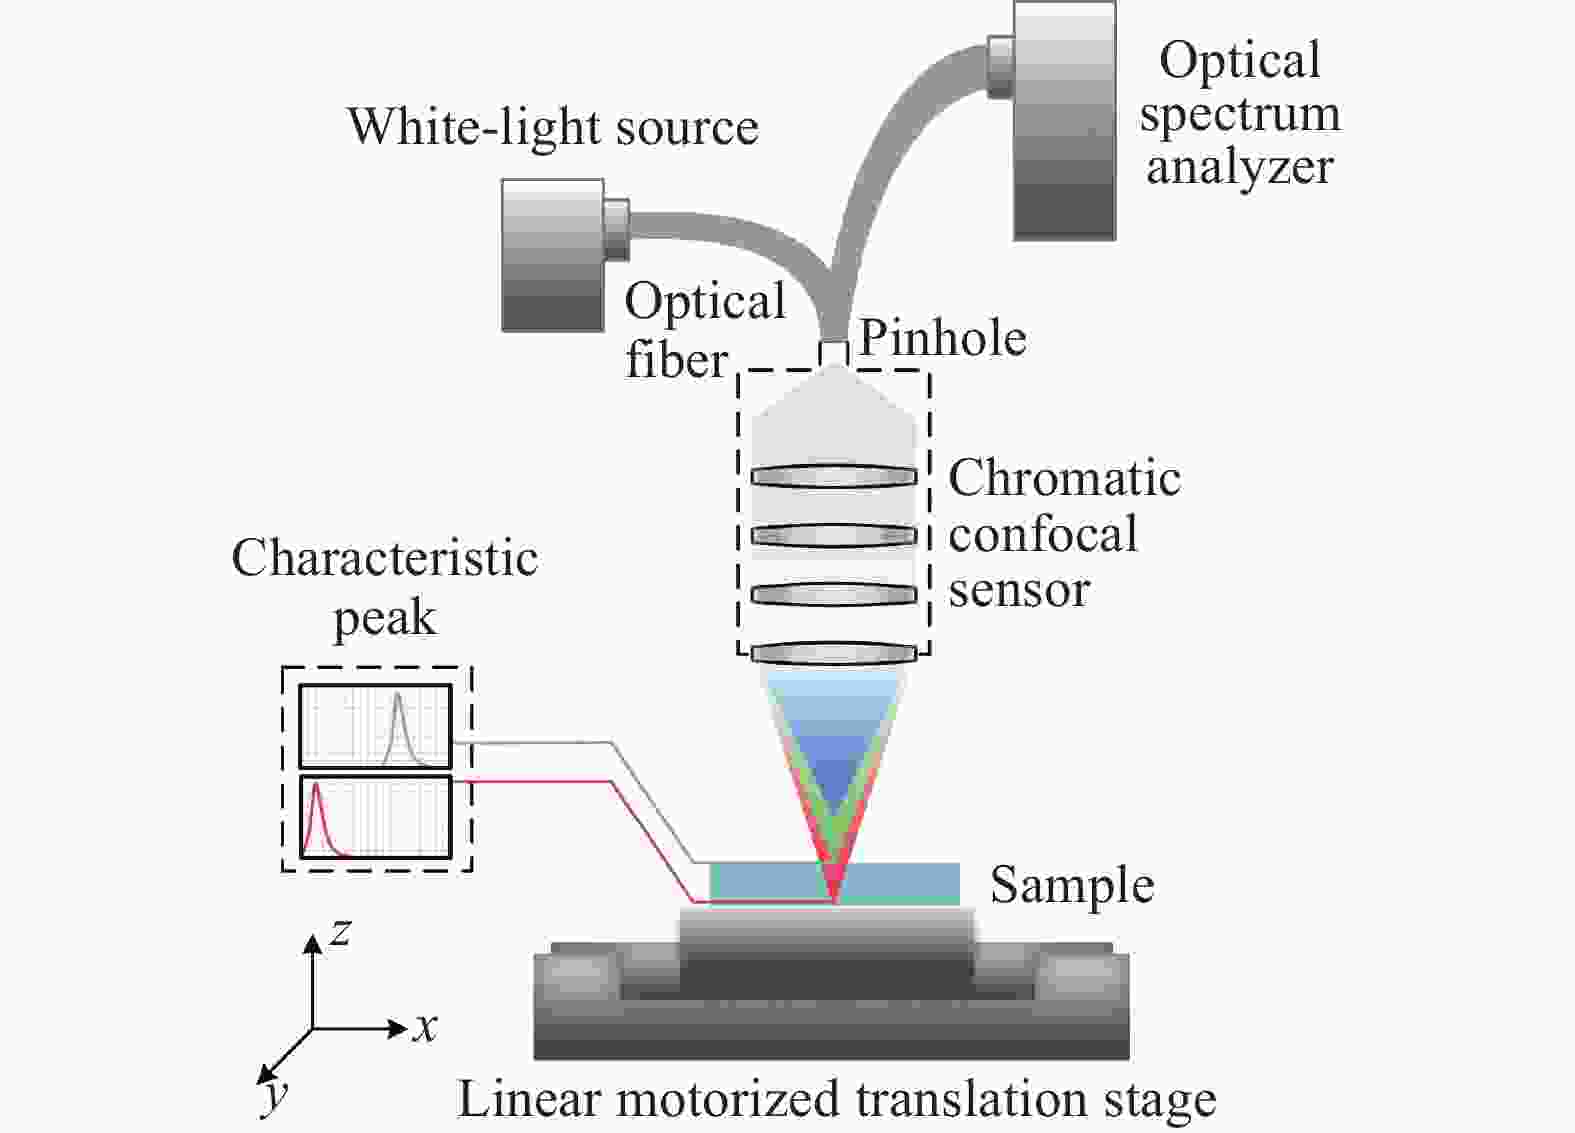
      Figure 1.  Schematic diagram of spectral confocal thickness measurement system

      图2所示,未放被测样本时,各光束聚焦点在色散范围内的位置分布基本呈现线性,两焦点之间的距离$ {h_0} $可表示为:

      式中:${Z_{\lambda _1}}$、${Z_{\lambda _2}}$分别为光波$ {\lambda _1} $、$ {\lambda _2} $的轴向聚焦位置;$ k $为波长-位移系数。

      Figure 2.  Spectral confocal thickness measurement model

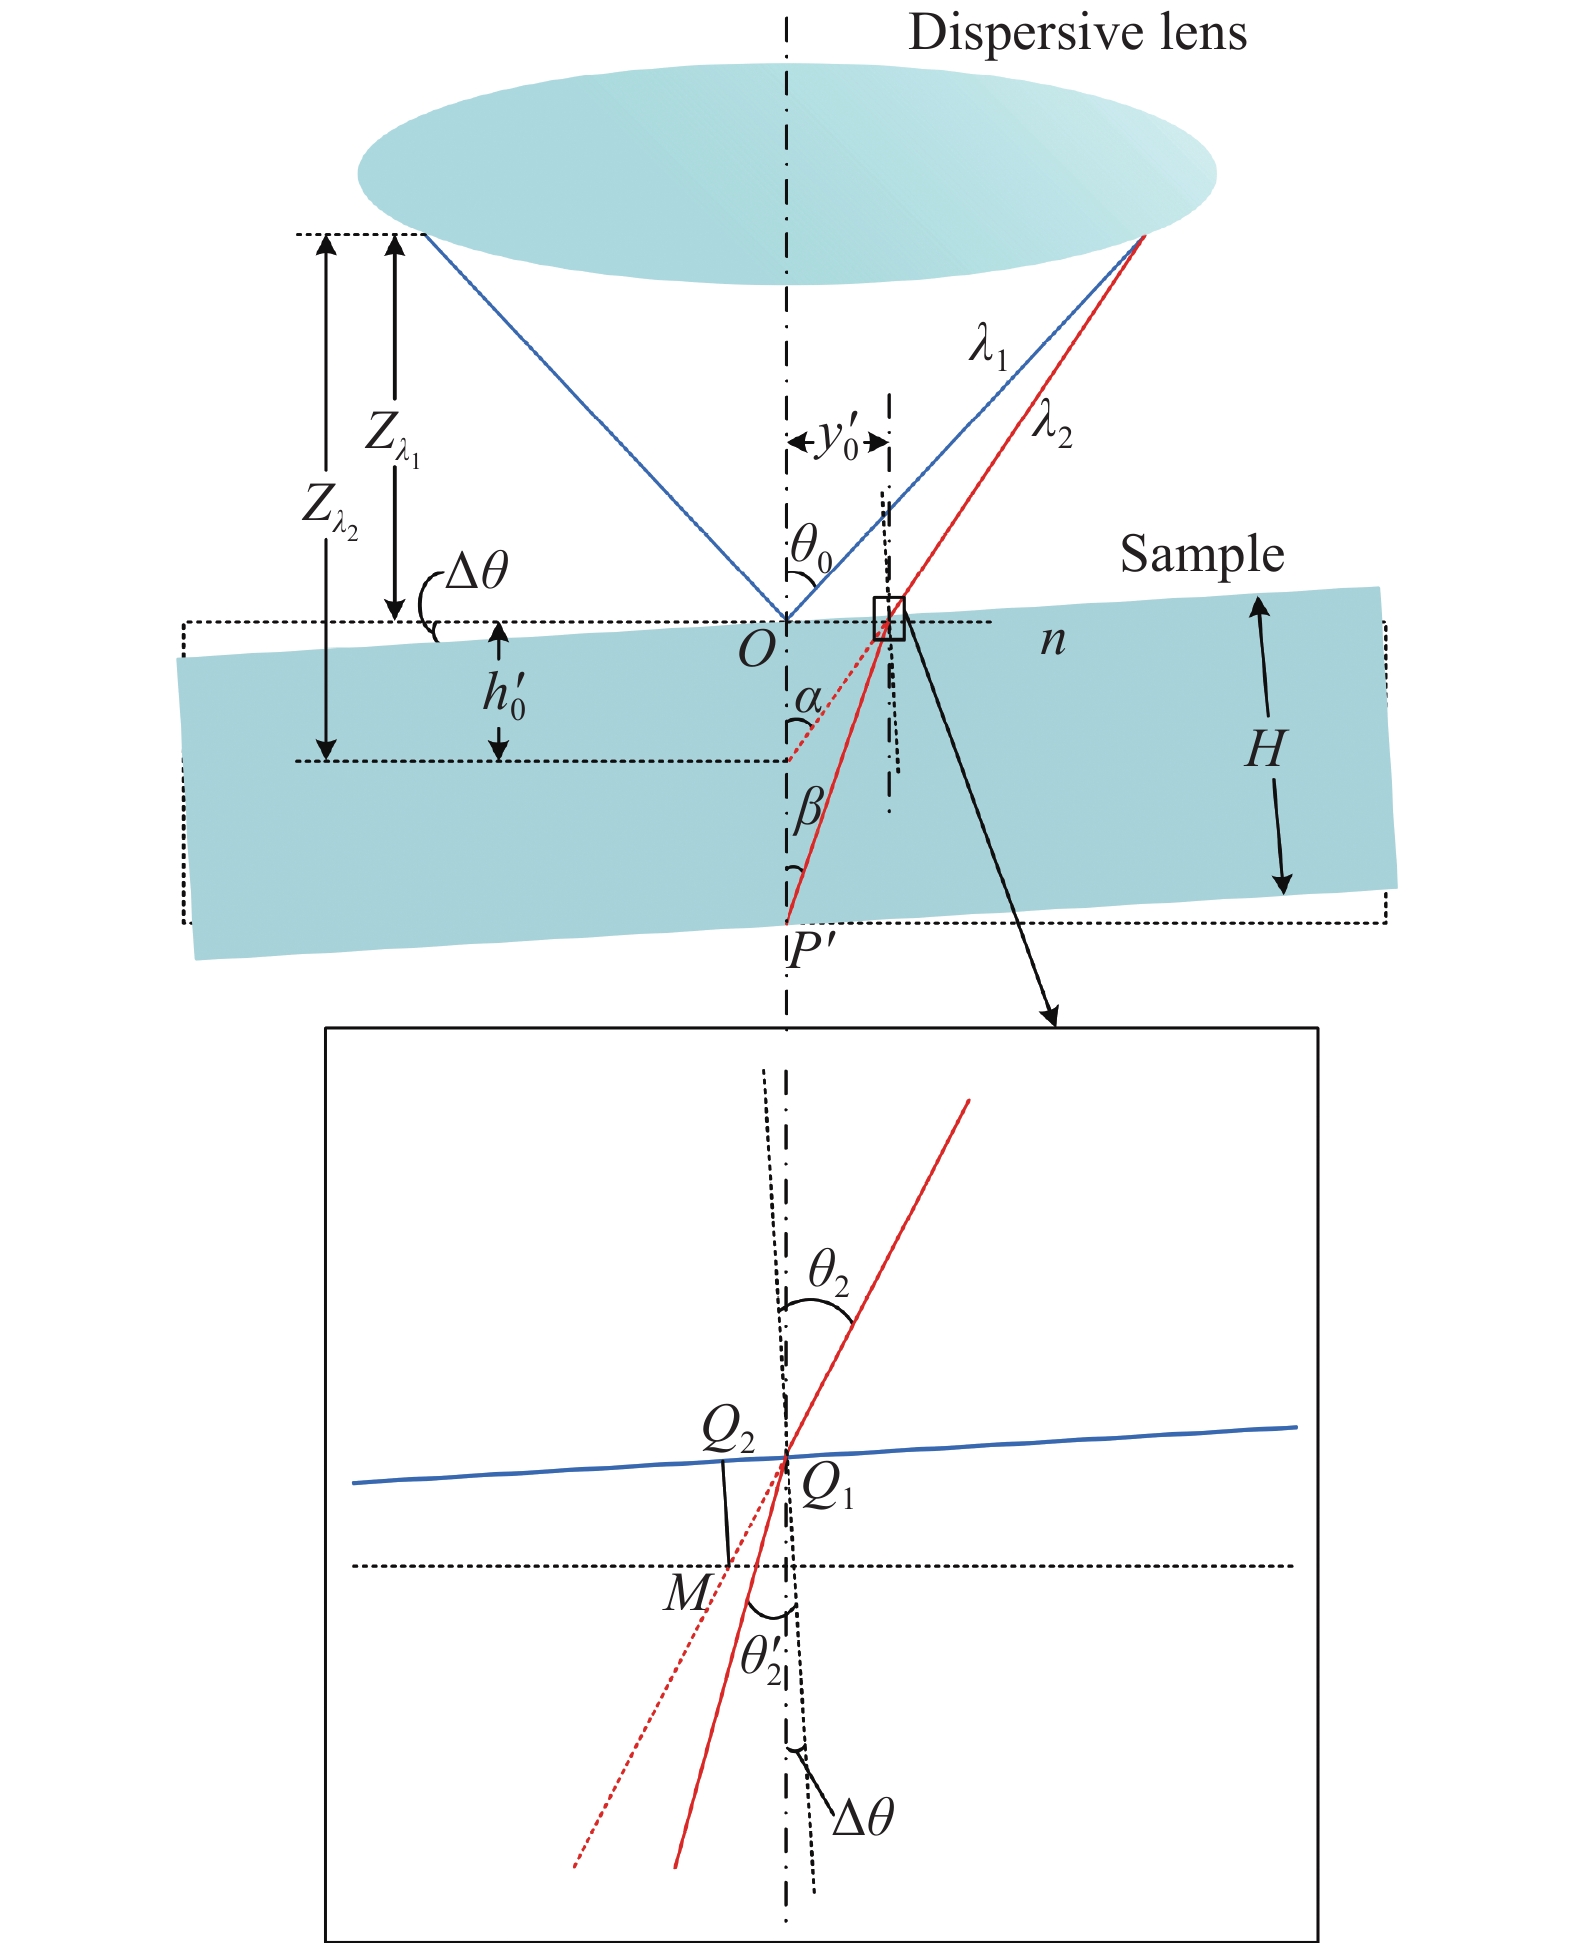
      放入待测样品后,色散光波$ {\lambda _1} $聚焦在样品的上表面并发生反射;$ {\lambda _2} $光束入射至样品上表面的Q点,然后折射到达下表面P点聚焦发生反射,$ {\lambda _1} $、$ {\lambda _2} $在接收到的光谱分布上以波峰形式呈现。H0为样品的实际厚度,即$ {\lambda _1} $与经过样品后的$ {\lambda _2} $聚焦点之间的轴向距离OP。设Q点与色散物镜光轴之间的距离$ OQ $为$ {y_0} $。由几何关系可知:

      式中:$ {\theta _1} $、$ {\theta _1}^\prime $分别为$ {\lambda _2} $的入射角和折射角,其中$ {\theta _1} $的大小由色散物镜的像方孔径角决定,由折射定律$ \sin {\theta _1} = n\sin {\theta _1}^\prime $,结合公式(1)得样品的实际厚度H0为:

      式中:$ n $为样品的折射率;$ {\theta _1} $由色散物镜的数值孔径决定。

    • 图3所示,为了获得透明材料各处的厚度分布,需要移动传感器探头进行多点测量,而传感器探头在水平面内横向移动会发生机械抖动,改变光束进入样品的折射特性,使接收到的光谱响应曲线存在随机噪声,测量数据发生漂移,可靠性降低[5]。存在抖动效应时,探头偏离原来位置,与理想竖直光轴之间产生随机抖动角$ \Delta \theta $,为便于分析,仍设探头出射光轴为竖直方向,待测样品表面发生小角度$ \Delta \theta $的倾斜[4],如图4所示,此时$ {\lambda _2} $在上表面的入射点为$ {Q_{\text{1}}} $,入射角为$ {\theta _2} = {\theta _1} + \Delta \theta $,且在下表面不再聚焦于P点,而是聚焦于$ P' $点。

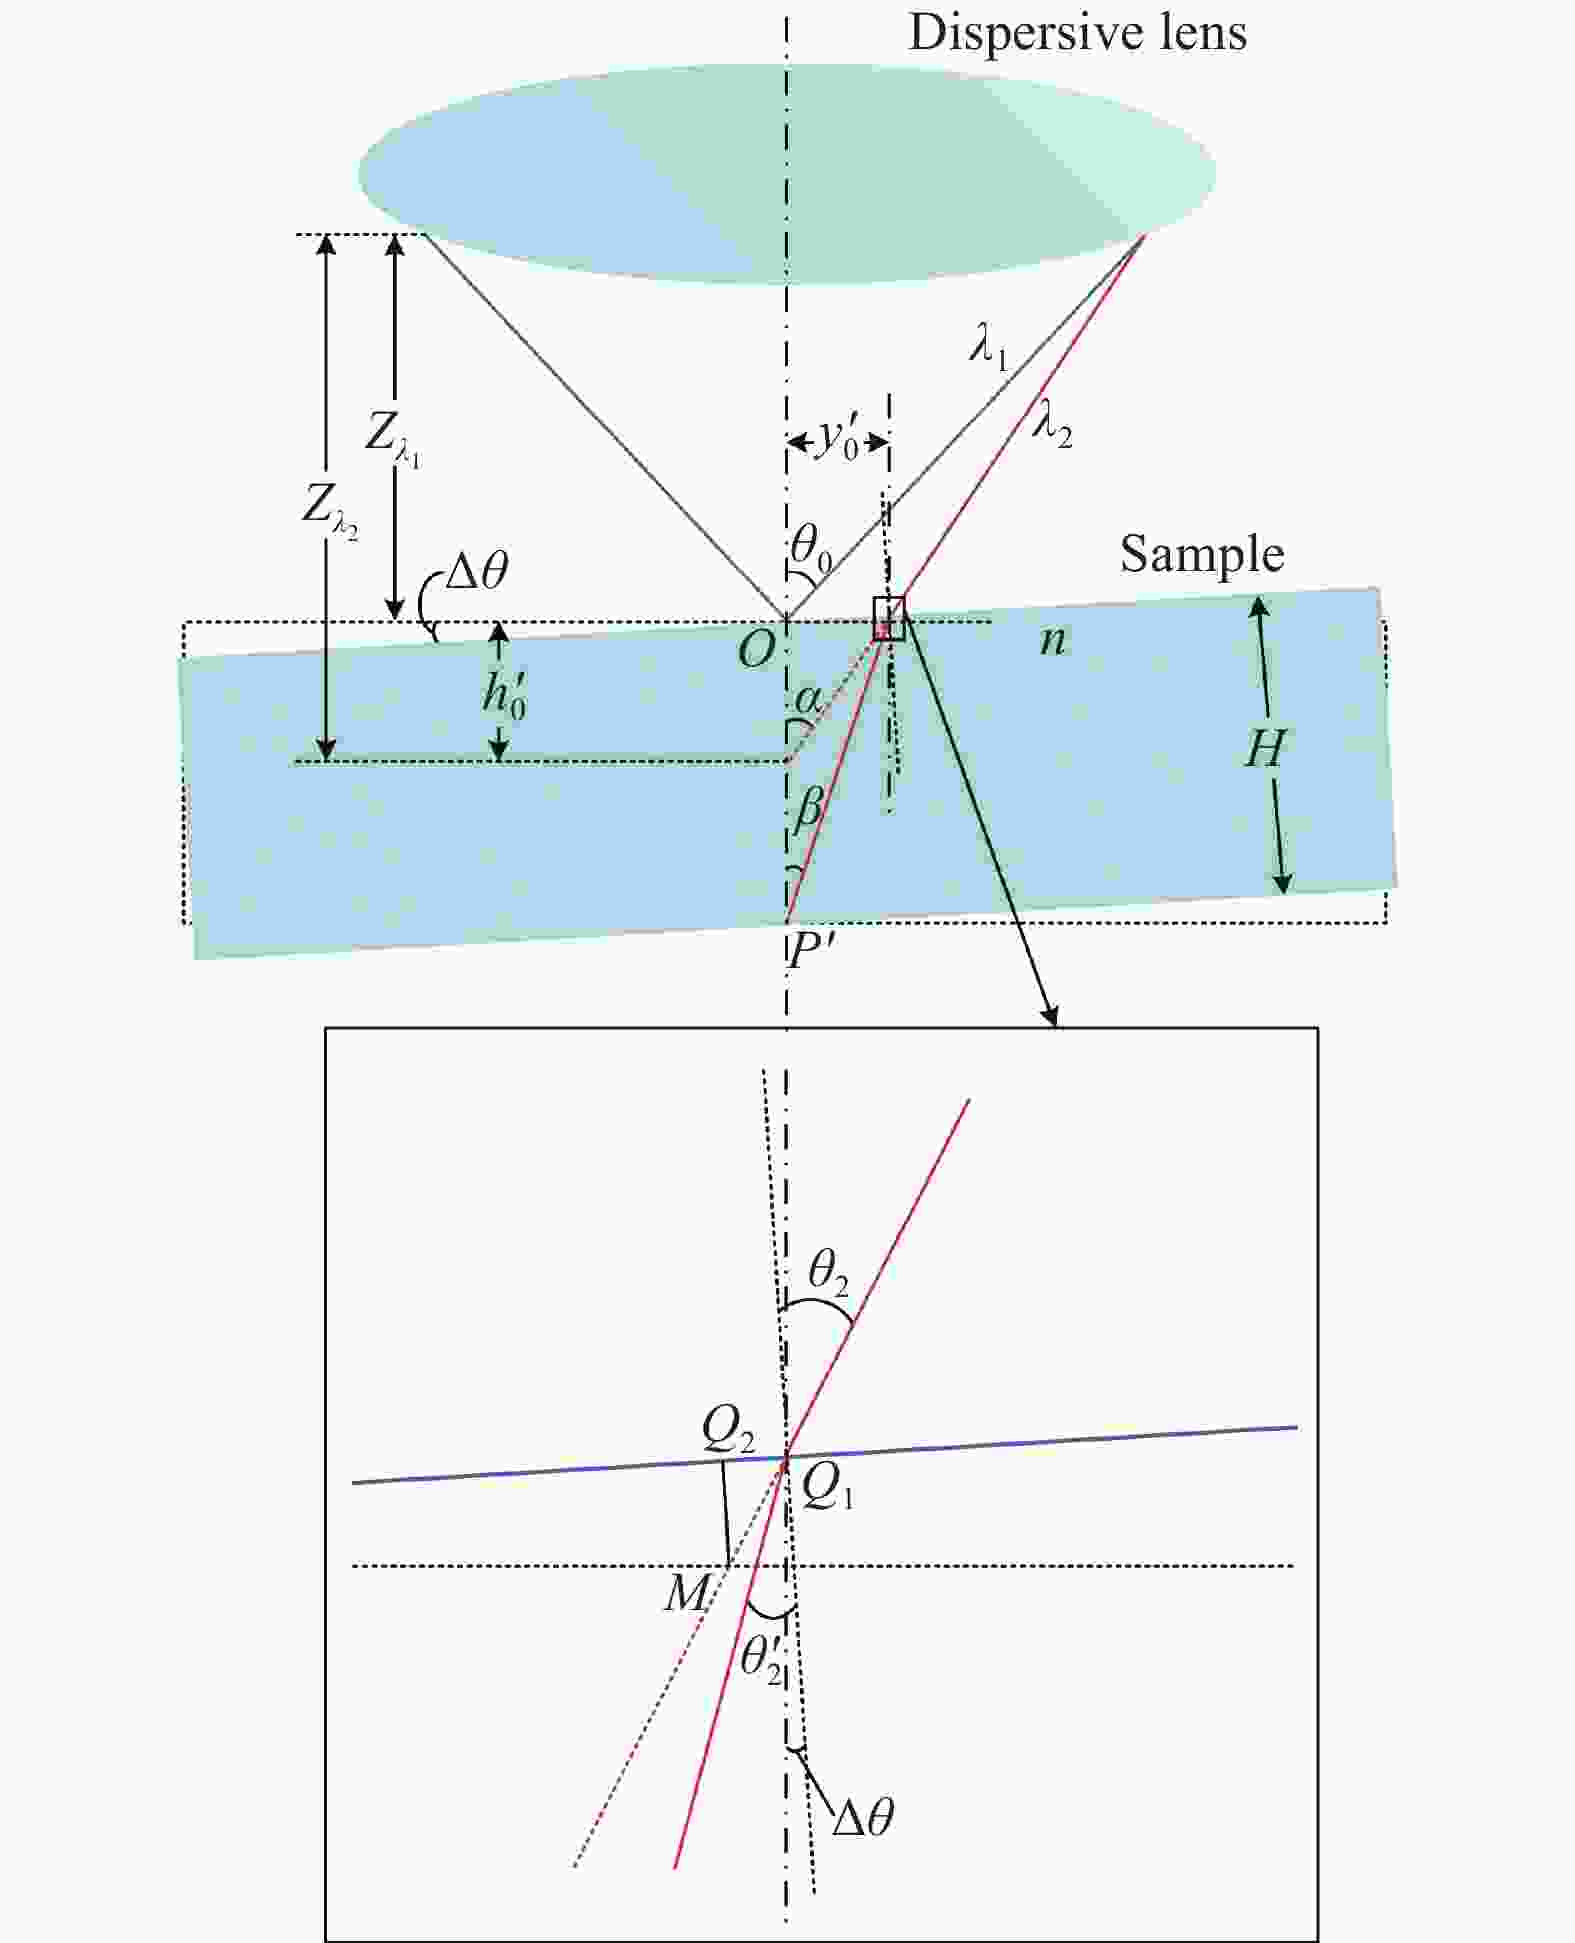
      Figure 3.  Relational model of the influence of jitter on spectral confocal thickness measurement

      Figure 4.  Effect of jitter on thickness measurement. (a) Thickness PDF of 4 samples under different random jitter; (b) Comparison between PDF analysis results of thickness H and MC simulation results

      由折射定律可得,$ {\lambda _2} $在$ {Q_{\text{1}}} $处的折射角$ {\theta '_2} $为:

      此时样品实际厚度$ H = P'{Q_1} \cdot \cos {\theta '_2} $,由三角关系可得:

      式中:$ \alpha $为$ {\lambda _2} $在$ {Q_{\text{1}}} $点处入射光线的延长线与光轴的夹角;$ {y'_0} $为$ {Q_{\text{1}}} $与色散物镜光轴之间的距离;$ \;\beta $为$ {\lambda _2} $入射至样品下表面时与色散物镜光轴的夹角。将公式(5)代入公式(4)可得此时样品的实际厚度H

      又由$ \;\beta = {\theta '_2} - \Delta \theta $,可得光谱共焦厚度测量受抖动的影响为:

      为了获得不同位置的多点数据,压电致动器或步进电机通过线性位移台驱动探头水平移动[12]。线性位移台的位置不受随机噪声的影响,位移台的抖动和轴向位置的不确定性视为测量过程中的抖动。当线性位移台移动并发生机械抖动时,探头光轴会有小角度的倾斜,测量光束穿过相对于光轴倾斜的被测样品或测量光束本身发生倾斜时就会产生抖动效应引起的测量误差。移动过程中造成的随机抖动角是指色散物镜光轴的瞬时方向相对于期望的竖直方向的不确定性,一般情况下随机抖动角呈正态分布,均值为零,方差相等。$ \Delta \theta $为随机抖动角的变化量,将厚度H表示为随机抖动角$ \Delta \theta $的函数$ {f_H}(\Delta \theta ) $,由于$ \Delta \theta $在0附近变化,将$ {f_H}(\Delta \theta ) $用泰勒级数在0处展开,得到:

      式中:$ o(\Delta \theta ) $为$ \Delta \theta $的高阶无穷小量。

      将公式(7)代入公式(8)可得厚度H关于$ \Delta \theta $函数为:

      则厚度数据样本$ {X_{Hi}} $为非中心卡方分布,则:

      式中:$ \gamma $为随机变量$ {X_{Hi}} $非中心参数;k为自由度;$ i = 1,2, \cdots,k $。

      则$ H $的PDF为:

      式中:${I_{{k}/{2} - 1}}(\Delta \theta ) = {\left(\dfrac{{\Delta \theta }}{2}\right)^{{k}/{2} - 1}}\displaystyle\sum\nolimits_{i = 0}^\infty {\tfrac{{{{\left({{\Delta \theta }}/{2}\right)}^{2 i}}}}{{i!\varGamma \left({k}/{2} + i\right)}}}$为第一类修正贝塞尔函数。设$ \Delta H $为厚度测量误差,则:

      式中:H0为真实厚度。由公式(13)可以看出,抖动对厚度测量的影响不可忽视。

    • 为精确分析抖动对厚度测量的影响,文中对实验采用的欧姆龙ZW-S5030光纤同轴位移传感探头的色散光波波长与各波长轴向聚焦点空间位置之间的编码关系进行了精确标定及数据拟合。获得500~650 nm色散光波与轴向聚焦位置的标定函数关系为$z\left( \lambda \right)$[13-14]

      色散物镜像方孔径角θ(λ)与波长的关系为:

      将103个数据样本代入公式(7)和(9),并使用MC模拟,获得不同抖动标准差影响的厚度H的PDF,仿真结果如图4所示。其中,抖动标准差为σ,为便于分析,设定入射到待测样品上表面的光束波长λ1均为500 nm,图4(a)为不同厚度的H(对应不同的λ2)在抖动影响下的PDF。同时,文中为验证厚度H的PDF的可靠性,将公式(12)的解析结果与利用公式(7)、(9)的获得的MC仿真结果进行对比,如图4(b)所示。

      图4(a)所示,分析了4种被测样品在不同程度随机抖动下的厚度H的PDF(聚焦在样品下表面的波长λ2分别为650、625、600、550 nm,抖动标准差σ分别为0.001、0.05 rad)。结果表明:抖动效应会导致光谱共焦厚度测量系统性能下降,尤其是在样品厚度H较大的情况下,在抖动标准差较大的情况下,测量较薄的样品具有更好的抗抖动性能。通过图4(b)厚度H的PDF解析结果和MC仿真结果的对比可知,抖动标准差较小的情况下,MC仿真结果与解析结果非常吻合,但当抖动标准差增大(抖动标准差σ≥0.1 rad、方差约大于35′)时,MC仿真结果与解析结果的偏差增大,此时应采取有效措施抑制动态测量过程中发生的抖动效应。

      为进一步说明抖动对厚度测量的影响,针对上述4种以及λ2=575、525 nm的6种样品,通过计算得出不同随机抖动引起的具体厚度测量误差如图5所示。

      Figure 5.  Thickness measurement errors due to jitter

      图5可以看出,抖动标准差σ从0增加0.05 rad时,较厚的被测样品(λ2=650 nm)厚度H测量误差ΔH从0增加到0.7425 mm;在同等条件下,较薄的被测样品(λ2=525 nm)厚度H测量误差ΔH从0增加到0.1025 mm。因此,较厚的被测样品更容易受到抖动效应影响,当被测样品厚度较厚时,需要降低抖动来减小误差,与图4(a)的分析结果相符。

    • 为补偿抖动效应对光谱共焦厚度测量的影响,文中首先对实验时获取的含有抖动效应的原始光谱数据进行滤波处理,消除各种随机噪声的影响,将滤波之后的光谱数据与前期进行系统标定时采用同样滤波方法进行处理获得的标准数据进行对比分析,计算并获取滤波后光谱数据的抖动因子,即随机抖动角幅度。利用获取的抖动因子对光谱数据进行补偿,修正抖动带来的影响,然后提取光谱数据的峰值波长,进行厚度数据信息的解算,其中采用的滤波算法及峰值波长获取的方法如下。

    • 实验获得的光谱信号不仅包含样品表面聚焦反射的有用共焦信号,同时夹杂着各种噪声,因此必须消除随机噪声,保留有效信号,才能实现峰值波长的准确提取[15-18]。实验搭建的光谱共焦厚度测量系统如图6所示,待测样品为透明平板,通过探头线性移动进行多点测量获取测量数据。

      Figure 6.  Experimental system diagram of spectral confocal thickness measurement

      对实验获取的光谱数据进行滤波时,常用的均值滤波、中值滤波、高斯滤波和S-G滤波的移动窗口宽度不同,对光谱信号的去噪性能不同。文中为确定所采用的滤波算法,首先通过改变滤波窗口的大小,对光谱数据的谱线特征得到的模拟信号分别进行均值滤波、中值滤波、高斯滤波和S-G滤波,得到滤波后的光谱,并利用去噪指标来衡量不同滤波方法对光谱信号的去噪性能。图7所示为滑动窗口分别设置为3、5、7、9和11时,不同滤波方法在滑动窗口下的去噪表现。

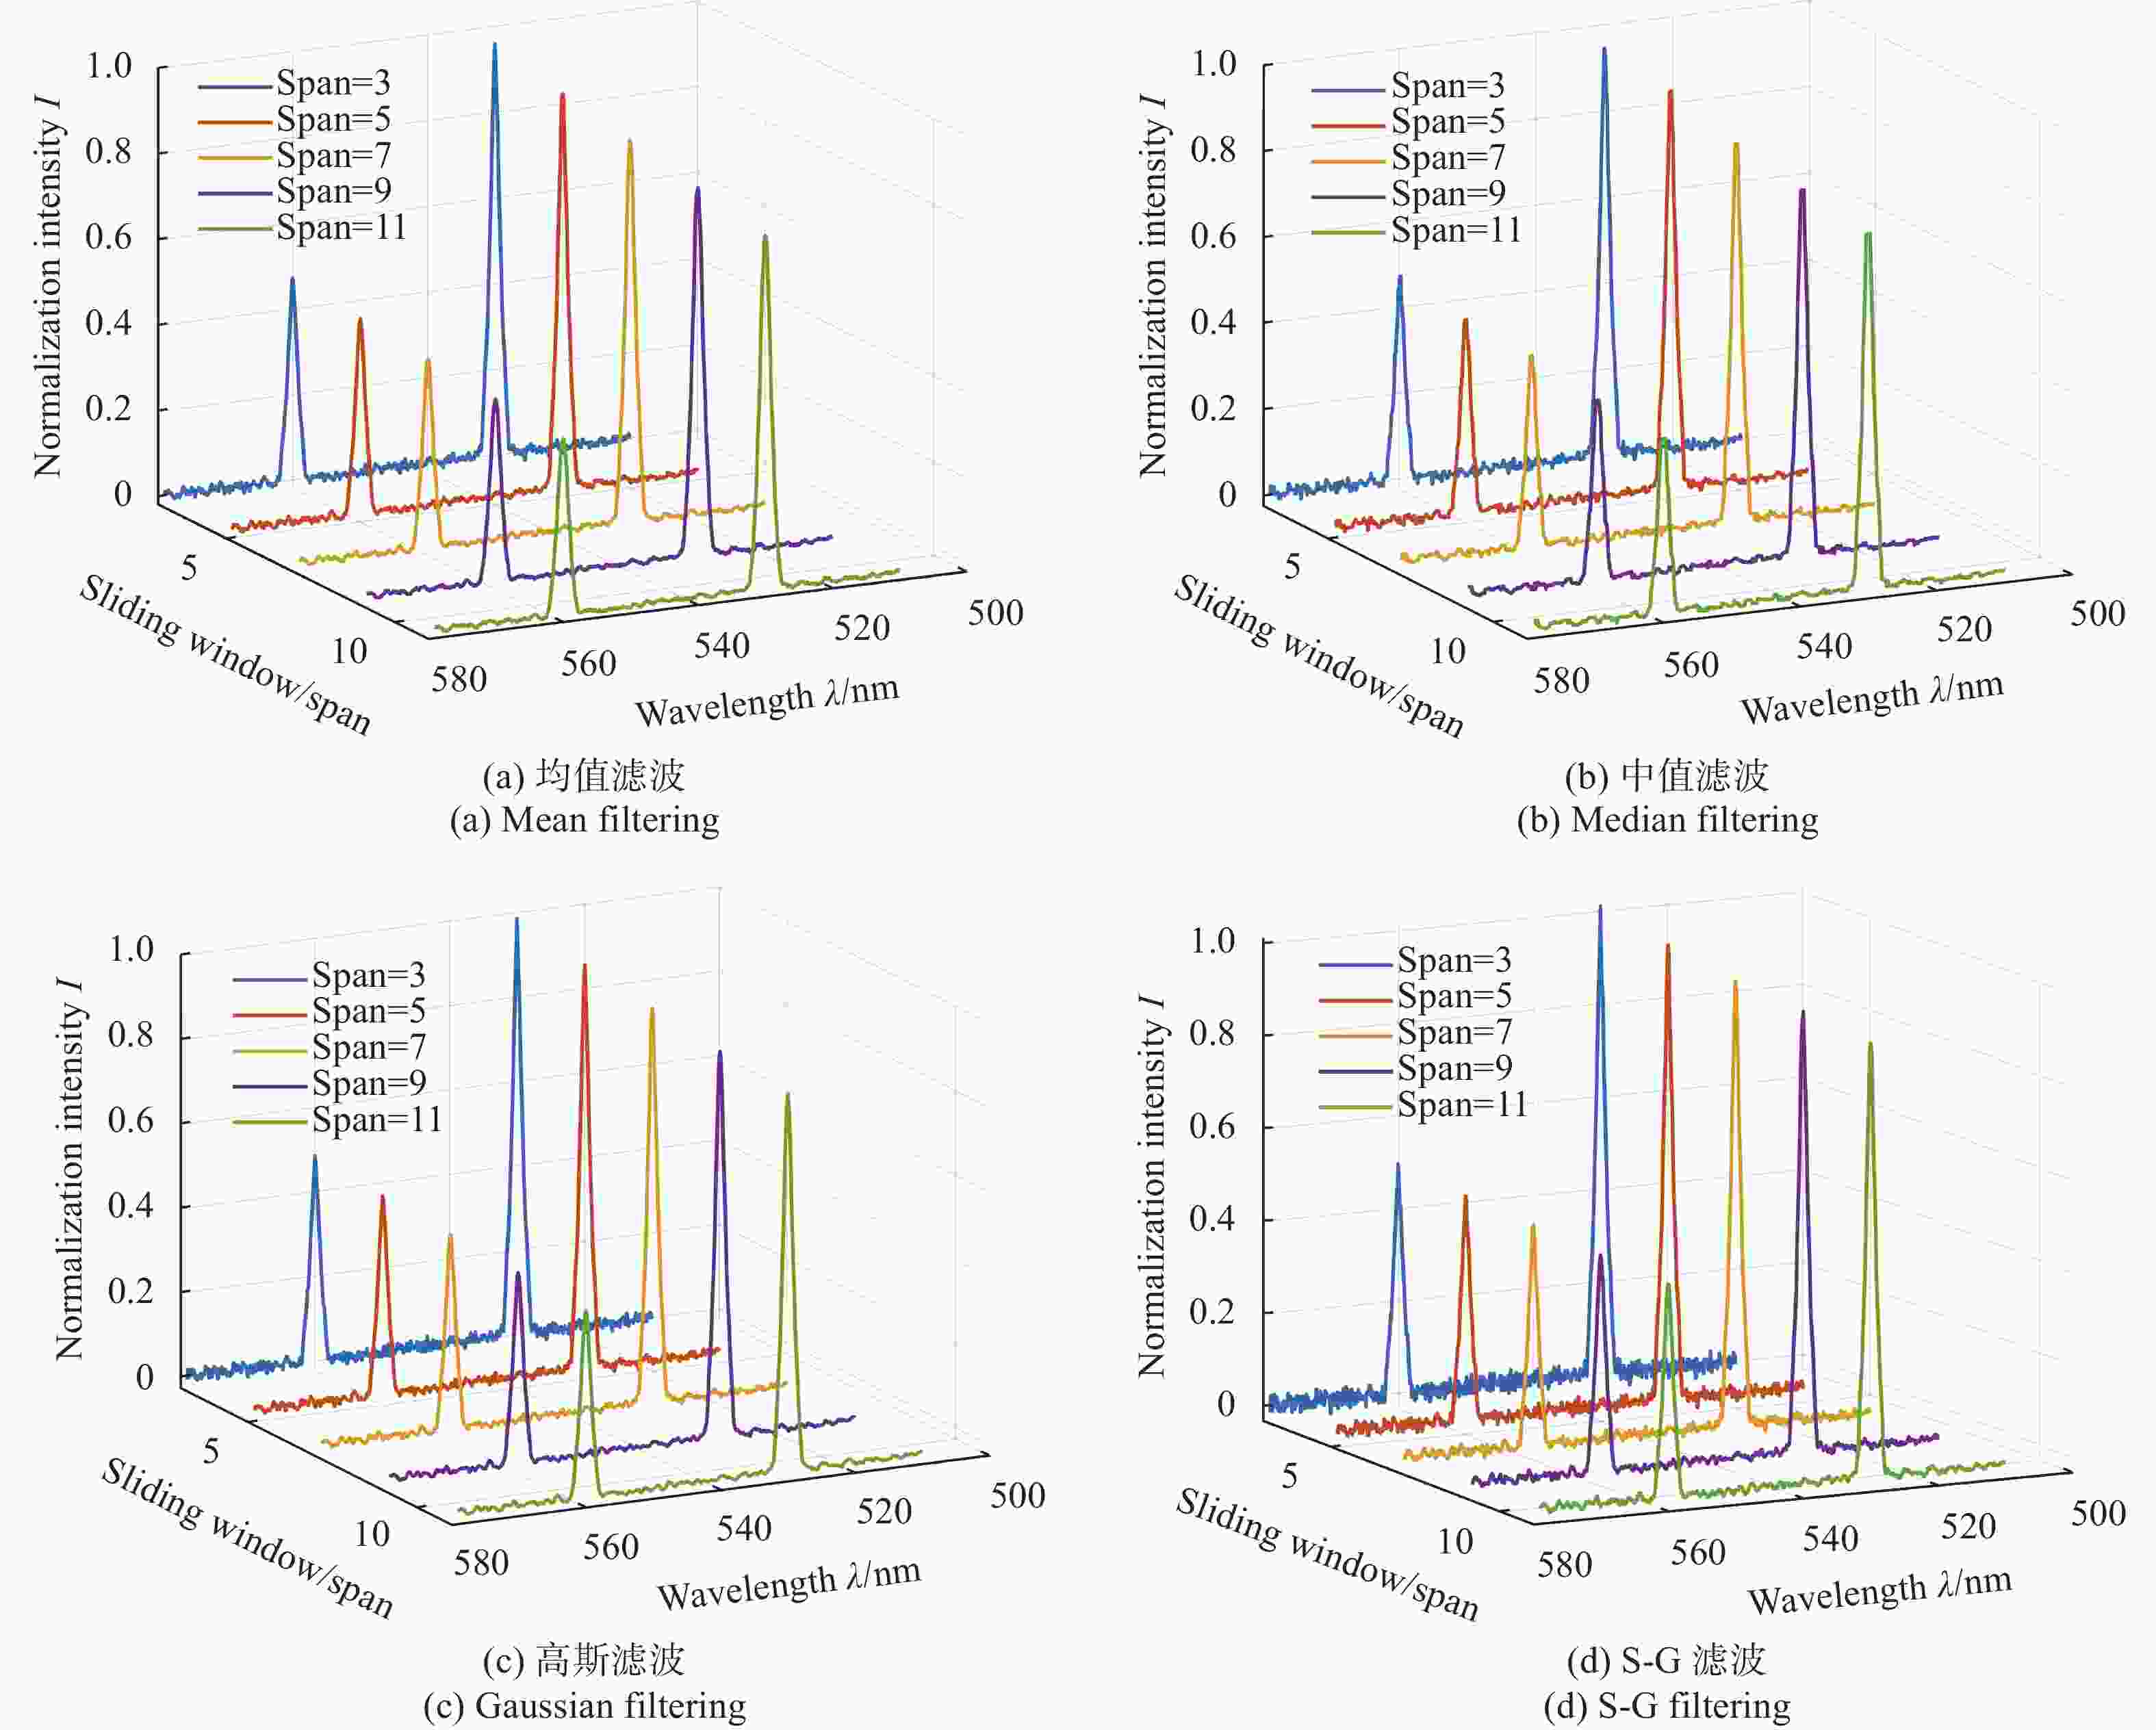
      Figure 7.  Spectral images after denoising by each filtering method. (a) Mean filtering; (b) Median filtering; (c) Gaussian filtering; (d) S-G filtering

      为了比较不同滤波方法的好坏,增加窗口变化的数值,计算不同滤波窗口大小下四种滤波方法的信噪比(Signal-Noise Ratio, SNR)和均方根误差(Root Mean Square Error, RMSE),其中SNR是衡量光谱信号消除噪声程度的指标,RMSE则表示滤波操作后的信号与无噪信号的相近程度,SNR越高,RMSE越小,代表对光谱噪声的去噪效果越佳,通常结合SNR和RMSE来共同说明滤波方法的去噪性能。

      图8可知,窗口大小的不同对均值、中值以及高斯滤波的影响较大,因此在使用均值、中值以及高斯滤波时需要谨慎考虑选择滤波窗口大小;而S-G滤波效果受窗口大小的影响较小,并且去噪效果优于均值、中值、高斯滤波,且具有较好的鲁棒性,因此文中采用S-G滤波对光谱信号进行随机噪声的滤波处理。

      Figure 8.  The denoising effect of each filtering method. (a) SNR; (b) RMSE

    • 由于S-G滤波受窗口大小的影响较小,为确定峰值波长提取方法,选择对窗口为9、3阶多项式拟合的S-G滤波后的光谱数据进行谱峰定位,并与真实值λ1=500.0 nm进行比较,为有效评估提取效果,文中选择对上表面聚焦光束λ1的峰值进行提取并对比5种峰值波长提取方法的性能,结果如表1所示。

      表1可知,利用不同的提取方法,得到的峰值波长不同,其中极值法对峰值波长的定位准确性最差,而高斯拟合法定位最准确,因此文中采用高斯拟合算法进行峰值提取。

      Peak localization
      method
      Extraction wavelength λ1/nmExtraction
      error λ1/nm
      Extremum method500.210.21
      Centroid method500.010.01
      Weighted centroid method500.010.01
      Polynomial fitting method500.110.11
      Gauss fitting method500.000

      Table 1.  Performance comparison of five peak extraction methods

    • 根据以上分析,文中建立抖动误差补偿算法模型,具体为选择S-G滤波对光谱数据进行滤波处理,消除各种随机噪声的影响,并利用标定实验中获取的标准数据计算并获取抖动因子,将抖动因子引入滤波后的光谱数据补偿并修正抖动带来的影响,然后利用高斯拟合提取峰值波长,进行厚度测量数据信息的解算,流程图如图9所示。

      Figure 9.  Jitter error compensation flow chart

    • 为验证抖动误差补偿算法的有效性,文中对厚度为(1.0±0.1) mm的熔融石英玻璃JGS1进行了实验测量。通过移动待测样品获得抖动误差补偿前和补偿后的厚度测量数据HH',并将二者与稳定状态下的单点多次测量得到的厚度H0的平均厚度$ {\bar H_0} $进行比较,测量结果如表2所示,其中抖动幅度为根据测量结果计算出的探头较静态条件下位置的偏移量,ΔH=H−$ {\bar H_0} $为移动测量进行抖动误差补偿前的厚度测量误差,重复性误差σΔH=19.84 μm,相对标准偏差δΔH=1.86%;ΔH'=H'-$ {\overline H_0} $为移动测量并进行抖动误差补偿后的厚度测量误差,重复性误差σΔH'=3.11 μm,相对标准偏差δΔH'=0.29%。

      Stable multipoint
      measurement
      H0/mm
      Moving measurement
      (before compensation)
      H/mm
      Moving measurement
      (after compensation)
      H′/mm
      Error
      (before compensation)
      ΔH/μm
      Error
      (after compensation)
      ΔH'/μm
      1.06431.08151.066117.21.8
      1.06401.08571.067221.73.2
      1.06421.08061.066116.41.9
      1.06421.08351.067219.33.0
      1.06391.08321.067019.33.1
      1.06401.08101.065717.01.7
      1.06411.08181.066517.72.4
      1.06371.08081.066017.12.3
      1.06411.08001.065915.91.8
      1.06431.08431.067920.03.6
      1.06411.08381.067919.73.8
      1.06391.08371.067519.83.6
      1.06391.08421.067320.33.4
      1.06391.08411.067420.23.5
      1.06421.08501.067420.83.2
      1.06401.08301.067019.03.0
      1.06431.08551.067221.22.9
      1.06381.08291.067119.13.3
      1.06381.08501.067621.23.8
      1.06421.08491.067720.73.5

      Table 2.  Experimental measurement result

      表2可知,稳定状态下对待测样品进行单点多次测量的平均厚度$ {\bar H_0} $=1.0640 mm,利用抖动补偿算法会减小移动测量过程中产生的测量误差,使得|ΔH'|<|ΔH|,通过表2中的测量结果可知,为获得多点数据,对样品进行移动测量,测量结果的稳定性由补偿前的δΔH=1.86%降低为补偿后的δΔH'=0.29%,验证了文中提出的抖动误差补偿算法的有效性。另外,通过分析测量结果发现,经过抖动误差补偿后,仍然存在一定的测量误差,产生原因可能为移动测量过程中的抖动模式较复杂,随机抖动不只含有常见的随机高斯分布,还可能含有其他抖动。针对理论仿真及实验现象,可以采取以下措施对系统进行改进设计,如采用平面反射镜和自准直仪或其他方式引出并测量具体的抖动状态,并在平衡测量误差和测量速度需求的条件下,结合移动测量时的确切驱动方式,确定抖动模式,改进误差补偿算法。

    • 文中基于光谱共焦法实现透明材料厚度测量时,移动产生的抖动效应会使测量数据发生漂移,系统研究了抖动效应对厚度测量的影响。首先,基于光谱共焦厚度测量系统的原理建立了抖动对厚度测量影响的关系模型,并进行理论推导,采用MC模拟进行仿真验证。其次对厚度PDF和MC仿真结果进行了对比分析,验证了厚度PDF表达式的正确性。结果表明:抖动效应会导致测量性能下降,尤其是在样品厚度较大的情况下;在抖动标准差较大的情况下,测量较薄的样品具有更好的抗抖动性能。为了修正或补偿抖动对测量结果的影响,提出采用S-G滤波及高斯拟合实现随机噪声滤除和光谱信号峰值波长的提取,并建立了抖动误差补偿算法模型。最后,对厚度为(1.0±0.1) mm的样品进行实验测量,稳定状态下测得平均厚度为1.0640 mm,移动测量结果的相对标准偏差由补偿前的1.86%降低为补偿后的0.29%,验证了文中提出的抖动误差补偿算法的有效性,并提出了改进措施。文中的研究结果对优化系统结构并进一步提高系统性能具有一定的指导意义,对光谱共焦位移传感系统进行稳定测量的实用化应用具有一定的推进作用。

Reference (18)

Catalog

    /

    DownLoad:  Full-Size Img  PowerPoint
    Return
    Return