Volume 53 Issue 3
Mar.  2024
Turn off MathJax
Article Contents

冯博, 刘炳国, 陈凤东, 等. 光学元件损伤在线检测图像处理技术 [J]. 强激光与粒子束, 2013, 25(7): 1697. doi:  10.3788/IRLA20230614
Citation: 冯博, 刘炳国, 陈凤东, 等. 光学元件损伤在线检测图像处理技术 [J]. 强激光与粒子束, 2013, 25(7): 1697. doi:  10.3788/IRLA20230614

Method for measuring laser damage threshold of optical thin film elements based on quantitative damage evaluation

doi: 10.3788/IRLA20230614
Funds:  National Natural Science Foundation of China (62175131); Ministry of Education Joint Fund (8091B032125); Shandong Province Key Research and Development Project (2020CXGC010204)
  • Received Date: 2023-11-06
  • Rev Recd Date: 2023-12-15
  • Publish Date: 2024-03-21
  •   Objective  Optical thin film components play a critical role in high-power lasers, and their ability to withstand laser-induced damage is crucial for the overall performance of the laser systems. Accurate measurement of the laser-induced damage threshold (LIDT) of thin film components is of great significance for improving the lifetime and output efficiency of lasers. However, the traditional test method for laser LIDT, based on the scheme outlined in GB/T 16601, involves evaluating the threshold value through damage probability, which requires numerous repetitive experiments and is both cumbersome and time-consuming. Moreover, the evaluation based on whether the damage occurs on the film surface introduces certain errors. The stability and reliability of the damage are influenced by factors such as laser stability, environmental disturbances, coating processes, and internal defects, which cannot be eliminated and affect the measurement results and accuracy. Additionally, probability statistics require testing many samples, resulting in high capital costs. Therefore, it is necessary to develop a fast and efficient method for measuring LIDT.  Methods  In this paper a novel method of quantitative evaluation of laser-induced damage degree (QELDD) is presented, for quantitatively assessing the degree of laser-induced damage in thin film components. The method involves analyzing the quantification of laser-induced damage at different energy densities and evaluating the LID threshold (LIDT) through damage trend fitting. To accurately quantify the laser-damaged area, super-resolution white-light interferometric measurement is employed, which ensures nanoscale measurement accuracy. Simulation results demonstrate that the proposed method allows for the three-dimensional reconstruction of nanoscale damage defects with a reconstruction volume error of less than 0.01%. Experimental samples, including laser resonator mirrors and window plates, were measured using this method, without repeating the laser damage experiments. The results were found to be consistent with those obtained using the S-on-1 method, with a deviation not exceeding 0.5 J/cm2. The standard deviations of the measurement results were 0.361 J/cm2 and 0.064 J/cm2, respectively.  Results and Discussions  In the simulation results of the laser damage structure model on the surface of the test element, the optimization algorithm achieved a relative error of less than 0.01% for the three-dimensional measurement results (Fig.7). And the reconstruction deviation value is in nanometers order (Fig.8). In the experiment, samples of two laser components are used. The measurement results for the laser resonator mirror are shown (Fig.10, Tab.1). The standard deviation of multiple measurement results is 0.361 J/cm2, and the difference from the S-on-1 result is less than 0.5 J/cm2. Similarly, the measurement results for the window slice are shown (Fig.11, Tab.2). The standard deviation of the multiple measurement results is 0.064 J/cm2, and the difference from the S-on-1 result is less than 0.3 J/cm2. The proposed QELDD method is based on single irradiation results of a single sample with different energy densities, eliminating the need for repetitive testing on multiple samples. This ensures good stability and accuracy while maintaining efficiency.  Conclusions  In this paper, a new laser damage threshold measurement method for optical films based on quantitative evaluation of the damage degree is proposed. The laser damage area is characterized and quantified with high precision using image super-resolution white light microscopic interferometry. The structural characteristics of the laser damage are also summarized. Based on the quantitative parameters of the laser damage degree, we fit and calculate the laser damage threshold. In the experimental setup, a 1 064 nm laser damage system is utilized, and the laser resonator mirror and window plate are selected as samples for testing. The standard deviations of the two sample results are 0.361 J/cm2 and 0.064 J/cm2, respectively. When compared with the results obtained using the S-on-1 method, the deviation of the measured results does not exceed 0.5 J/cm2, indicating good stability and accuracy of the proposed method. During the quantification and characterization of the laser damage area, the QELDD method effectively distinguishes between valid and invalid damage points based on the damage characteristics, thereby eliminating the influence of invalid damage on the result fitting, and improving measurement efficiency. This method introduces a new approach to LIDT measurement, facilitates further research on the laser damage mechanism of optical components, and provides a theoretical basis for enhancing the manufacturing and coating processes of optical components.
  • [1] 冯博, 刘炳国, 陈凤东, 等. 光学元件损伤在线检测图像处理技术 [J]. 强激光与粒子束, 2013, 25(7): 1697. doi:  10.3788/HPLPB20132507.1697

    Feng B, Liu B G, Cheng F D, et al. Image processing technology for online detection of optical element damage [J]. High Power Laser and Particle Beams, 2013, 25(7): 1697. (in Chinese) doi:  10.3788/HPLPB20132507.1697
    [2] 邱荣. 强激光诱导光学元件损伤的研究[D]. 绵阳: 中国工程物理研究院, 2013.

    Qiu R. Study on optical element damage induced by high intensity laser[D]. Mianyang: China Academy of Engineering Physics, 2013. (in Chinese)
    [3] 杨亮. 光学元件表面污染对负载能力影响的研究[D]. 成都: 电子科技大学, 2016.

    Yang L. Study on the effect of optical component surface contamination on load capacity[D]. Chengdu: University of Electronic Science and Technology of China, 2016. (in Chinese)
    [4] Fournier J, Grua P, Néauport J, et al. Temperature dependence of luminescence for different surface flaws in high purity silica glass [J]. Optical Materials Express, 2013, 3(1): 1-10. doi:  10.1364/OME.3.000001
    [5] Demos S, Staggs M, Minoshima K, et al. Characterization of laser induced damage sites in optical components [J]. Optics Express, 2003, 10(25): 1444-1450.
    [6] Liao Z M, Raymond B, Gaylord J, et al. Damage modeling and statistical analysis of optics damage performance in MJ-class laser systems [J]. Optics Express, 2014, 22(23): 28845-28856. doi:  10.1364/OE.22.028845
    [7] 周丽丹, 粟敬钦, 张小民, 等. 光学元件"缺陷"对助推放大级光束质量的影响 [J]. 强激光与粒子束, 2009, 21(3): 326.

    Zhou L D, Su J Q, Zhang X M, et al. Effect of optical element "defects" on beam quality of boost amplifier stage [J]. High Power Laser and Particle Beams, 2009, 21(3): 326. (in Chinese)
    [8] Zhu Y N. Discussion of the measurement methods for laser induced damage threshold of optical coating [J]. Laser Technology, 2006, 30(5): 0532.
    [9] Mann G, Pentzien S, Krüger J. Beam diameter dependence of surface damage threshold of fused silica fibers and preforms for nanosecond laser treatment at 1064 nm wavelength [J]. Applied Surface Science, 2013, 276: 312-316. doi:  10.1016/j.apsusc.2013.03.088
    [10] International Organization for Standardization. ISO 11254-2:2001 SNV[S].The Swiss Association for Standardization, 2001.ical surfaces - Part2: S-on-1 test [S]. Swiss: The Swiss Association for Standardization, 2001. https://www.intertekinform.com/en-AU/standards/iso-11254-2-2001-596043_saig_iso_iso_1365380/.
    [11] Rudolph W, Emmert L A, Rodriguez C, et al. Femtosecond to nanosecond laser damage in dielectric materials[C]//Pacific Rim Laser Damage 2013, Optical Materials for High Power Lasers, SPIE, 2013, 8786: 878602.
    [12] Sozet M, Néauport J, Lavastre E, et al. Laser damage density measurement of optical components in the sub-picosecond regime [J]. Optics Letters, 2015, 40(9): 2091-2094. doi:  10.1364/OL.40.002091
    [13] Martin S, Stéphane B, Johann B, et al. Sub-picosecond laser damage growth on high reflective coatings for high power applications [J]. Optics Express, 2017, 25(21): 25767. doi:  10.1364/OE.25.025767
    [14] Riede W, Willamowski U, Dieckmann M, et al. Laser-induced damage measurements according to ISO/DIS 11254-1: Results of a national round robin experiment on Nd:YAG laser optics[C]//Proc SPIE, 1998, 3244: 1997.
    [15] Bingelyte V, Sirutkaitis V, Eckardt R C. S-on-1-induced damage thresholds of high-reflection metallic coatings at 1064 nm[C]//Laser-Induced Damage in Optical Materials: 2002 and 7th International Workshop on Laser Beam and Optics Characterization, SPIE, 2003, 4932: 513-519.
    [16] Wu S, Shi W, Su J. Using an external electric field to reduce laser damage of DLC films [J]. International Journal of Materials and Product Technology, 2012, 45(1-4): 74-82.
    [17] Luo S, Sasaki O, Chen Z, et al. Exact surface profile measurement without subtracting dispersion phase through Fourier transform in a white-light scanning interferometer [J]. Applied Optics, 2018, 57(4): 894-899. doi:  10.1364/AO.57.000894
    [18] Zhang Y M, Jing W C, Zhang H X, et al. Computerized white light scanning interferometer and the application [J]. Optics and Precision Engineering, 2004, 12(6): 560-565.
    [19] Luu L, Wang Z, Vo M, et al. Accuracy enhancement of digital image correlation with B-spline interpolation [J]. Optics Letters, 2011, 36(16): 3070-3072. doi:  10.1364/OL.36.003070
    [20] Gao S, Gruev V. Bilinear and bicubic interpolation methods for division of focal plane polarimeters [J]. Optics Express, 2011, 19(27): 26161-26173. doi:  10.1364/OE.19.026161
  • 加载中
通讯作者: 陈斌, bchen63@163.com
  • 1. 

    沈阳化工大学材料科学与工程学院 沈阳 110142

  1. 本站搜索
  2. 百度学术搜索
  3. 万方数据库搜索
  4. CNKI搜索

Figures(11)  / Tables(2)

Article Metrics

Article views(38) PDF downloads(9) Cited by()

Related
Proportional views

Method for measuring laser damage threshold of optical thin film elements based on quantitative damage evaluation

doi: 10.3788/IRLA20230614
  • School of Information Science and Engineering, Shandong University, Qingdao 266237, China
Fund Project:  National Natural Science Foundation of China (62175131); Ministry of Education Joint Fund (8091B032125); Shandong Province Key Research and Development Project (2020CXGC010204)

Abstract:   Objective  Optical thin film components play a critical role in high-power lasers, and their ability to withstand laser-induced damage is crucial for the overall performance of the laser systems. Accurate measurement of the laser-induced damage threshold (LIDT) of thin film components is of great significance for improving the lifetime and output efficiency of lasers. However, the traditional test method for laser LIDT, based on the scheme outlined in GB/T 16601, involves evaluating the threshold value through damage probability, which requires numerous repetitive experiments and is both cumbersome and time-consuming. Moreover, the evaluation based on whether the damage occurs on the film surface introduces certain errors. The stability and reliability of the damage are influenced by factors such as laser stability, environmental disturbances, coating processes, and internal defects, which cannot be eliminated and affect the measurement results and accuracy. Additionally, probability statistics require testing many samples, resulting in high capital costs. Therefore, it is necessary to develop a fast and efficient method for measuring LIDT.  Methods  In this paper a novel method of quantitative evaluation of laser-induced damage degree (QELDD) is presented, for quantitatively assessing the degree of laser-induced damage in thin film components. The method involves analyzing the quantification of laser-induced damage at different energy densities and evaluating the LID threshold (LIDT) through damage trend fitting. To accurately quantify the laser-damaged area, super-resolution white-light interferometric measurement is employed, which ensures nanoscale measurement accuracy. Simulation results demonstrate that the proposed method allows for the three-dimensional reconstruction of nanoscale damage defects with a reconstruction volume error of less than 0.01%. Experimental samples, including laser resonator mirrors and window plates, were measured using this method, without repeating the laser damage experiments. The results were found to be consistent with those obtained using the S-on-1 method, with a deviation not exceeding 0.5 J/cm2. The standard deviations of the measurement results were 0.361 J/cm2 and 0.064 J/cm2, respectively.  Results and Discussions  In the simulation results of the laser damage structure model on the surface of the test element, the optimization algorithm achieved a relative error of less than 0.01% for the three-dimensional measurement results (Fig.7). And the reconstruction deviation value is in nanometers order (Fig.8). In the experiment, samples of two laser components are used. The measurement results for the laser resonator mirror are shown (Fig.10, Tab.1). The standard deviation of multiple measurement results is 0.361 J/cm2, and the difference from the S-on-1 result is less than 0.5 J/cm2. Similarly, the measurement results for the window slice are shown (Fig.11, Tab.2). The standard deviation of the multiple measurement results is 0.064 J/cm2, and the difference from the S-on-1 result is less than 0.3 J/cm2. The proposed QELDD method is based on single irradiation results of a single sample with different energy densities, eliminating the need for repetitive testing on multiple samples. This ensures good stability and accuracy while maintaining efficiency.  Conclusions  In this paper, a new laser damage threshold measurement method for optical films based on quantitative evaluation of the damage degree is proposed. The laser damage area is characterized and quantified with high precision using image super-resolution white light microscopic interferometry. The structural characteristics of the laser damage are also summarized. Based on the quantitative parameters of the laser damage degree, we fit and calculate the laser damage threshold. In the experimental setup, a 1 064 nm laser damage system is utilized, and the laser resonator mirror and window plate are selected as samples for testing. The standard deviations of the two sample results are 0.361 J/cm2 and 0.064 J/cm2, respectively. When compared with the results obtained using the S-on-1 method, the deviation of the measured results does not exceed 0.5 J/cm2, indicating good stability and accuracy of the proposed method. During the quantification and characterization of the laser damage area, the QELDD method effectively distinguishes between valid and invalid damage points based on the damage characteristics, thereby eliminating the influence of invalid damage on the result fitting, and improving measurement efficiency. This method introduces a new approach to LIDT measurement, facilitates further research on the laser damage mechanism of optical components, and provides a theoretical basis for enhancing the manufacturing and coating processes of optical components.

    • 自1960年第一台激光器问世以来,激光凭借着其较好的单色性、方向性和相干性及高强度、高亮度的特点被广泛应用于各个领域,深刻地影响了科学、技术、经济和社会的发展及变革。随着激光在加工、军事、通信等领域应用的深入发展,人们对激光器的功率有进一步的要求,高功率激光器应运而生。在高功率固体激光装置中,强激光通过介质时产生非线性效应, 容易导致光学元件表面膜层损伤和内聚焦丝形成,从而产生激光损伤[1],影响激光光束质量,严重者甚至因为热效应使元器件炸裂,损坏激光器。

      光学元件的激光损伤机制非常复杂,如多光子电离、雪崩电离、杂质、亚表面裂纹等[2]。其中主要损伤原因是材料生产和加工过程中引入的杂质和结构缺陷[3]。在光路系统中,这些缺陷对光束造成不同程度的散射,影响激光束均匀性[45]。尤其在高功率激光装置中,光束能量密度较高,若光束的近场均匀性差,在终端光路会对其元器件造成极大的负担与风险,危害系统的安全正常运行[67]。为提高装置负载能力、降低运行成本,研究强激光辐照下光学元件的损伤机制,并根据损伤机制对材料生产和加工环节提出工艺要求是非常有必要的。而对激光器中的光学元件膜层损伤阈值的测量是提高元件加工质量,优化镀膜工艺的关键。

      对于激光诱导损伤阈值(LIDT)的测试方法, GB/T 16601[8]中有着具体的定义及方案,通过相同激光束条件下多测试点冲击,损伤点数与总测试点数比值得到的损伤概率作为判断依据,制作光学元件激光损伤概率的统计曲线图,并由损伤概率曲线通过线性拟合外推至零损伤概率处,即为光学元件的激光损伤阈值。2013年,德国联邦材料研究和化验所的Guido Mann等[9]使用ISO 11254[10]标准的S-on-1方法测试不同纤芯直径石英光纤样品,探讨在纳秒脉冲激光下,不同光斑尺寸与LIDT的关系,通过热损伤模型解释了不同脉宽下的薄膜损伤机制;美国科罗拉多州立大学的 W.Rudolph,C.S.Menoni 等[11]研究在飞秒脉冲和纳秒脉冲激光下介质材料的损伤,通过标准电子密度模型,解释了不同脉宽下,薄膜损伤的机制和原理,并且证明LIDT随着脉宽的增大而增大;2015年,法国阿基坦科学技术研究中心的Martin Sozet等[12]使用1-on-1和S-on-1两种方法测试亚皮秒脉冲激光对高反薄膜镜片的损伤阈值,但由于该方法仅仅只是基于损伤概率获取损伤阈值参数,因此还需要借助扫描电子显微镜(SEM)观察损伤区域的破损状况;2017年,他又提出一种新的方法[13],通过实时观测相同能量密度下不同激光脉冲次数造成的损伤区域面积变化,总结出两者的线性关系及增长系数。

      文中提出一种基于损伤程度量化评估法(QELDD)的新型光学薄膜激光损伤阈值测量方法,通过对薄膜元件表面激光损伤区域三维测量,量化分析其损伤程度,并以该参数作为评判依据,对不同能量密度下薄膜元件表面的激光损伤程度进行拟合,由损伤趋势曲线确定损伤阈值。该方法根据实际测量的三维结果进行激光损伤情况分析,总结激光损伤规律,筛选有效测量数据,减少因杂质、结构缺陷等外部因素的干扰,有着较好的准确性及稳定性。

    • 根据GB/T 16601[9]中的规定,高斯分布的稳定激光束经过扩束系统、衰减系统以及聚焦系统后,传输到被测样片表面,采用一定的激光作用方式对损伤阈值进行测试。目前用于对短脉冲激光的LIDT的标准测量方法主要有1-on-1[14]和S-on-1[15]两种方法。1-on-1是单次激光辐照测试,在测试过程中,逐渐降低激光器输出的脉冲能量,从样品完全损伤到没有任何损伤点。每个脉冲能量采样多次,每个采样点辐照一次,每两个采样点间距恒定。依次记录各脉冲能量下有损伤的采样点所占总采样点的比例,即为该脉冲能量密度下的损伤概率。以激光能量密度为横轴,损伤概率为纵轴,得出损伤概率与激光能量密度的点分布,再用直线拟合并外推到零损伤概率,所对应的激光能量值即为该样品的LIDT[16]值。S-on-1是多次辐照测试,即对每个采样点处进行多次辐照,辐照次数为S,除此之外的其他测试流程与1-on-1相同。图1为激光损伤测量系统示意图,激光器出射光束经由可调衰减器AT1调制后入射到分束器BS1,其反射光被能量计EM接收用于激光能量监测,其透射光经由聚焦透镜L汇聚透过BS2后入射在待测薄膜样品表面, BS2的反射光经过衰减器AT2调制后被CCD相机探测,经BS2分束后的透射光到待测样片的距离与反射光到CCD靶面的距离相同,均位于L透镜的焦点处,故CCD监测到的激光束光斑尺寸与辐照在样片表面的光斑一致,该尺寸用于配合EM计算辐照激光脉冲的能量密度。LD光源用于增强激光辐照区域亮度,便于观测相机对激光损伤的判别及图像采集。图1右边是损伤区域的显微图。

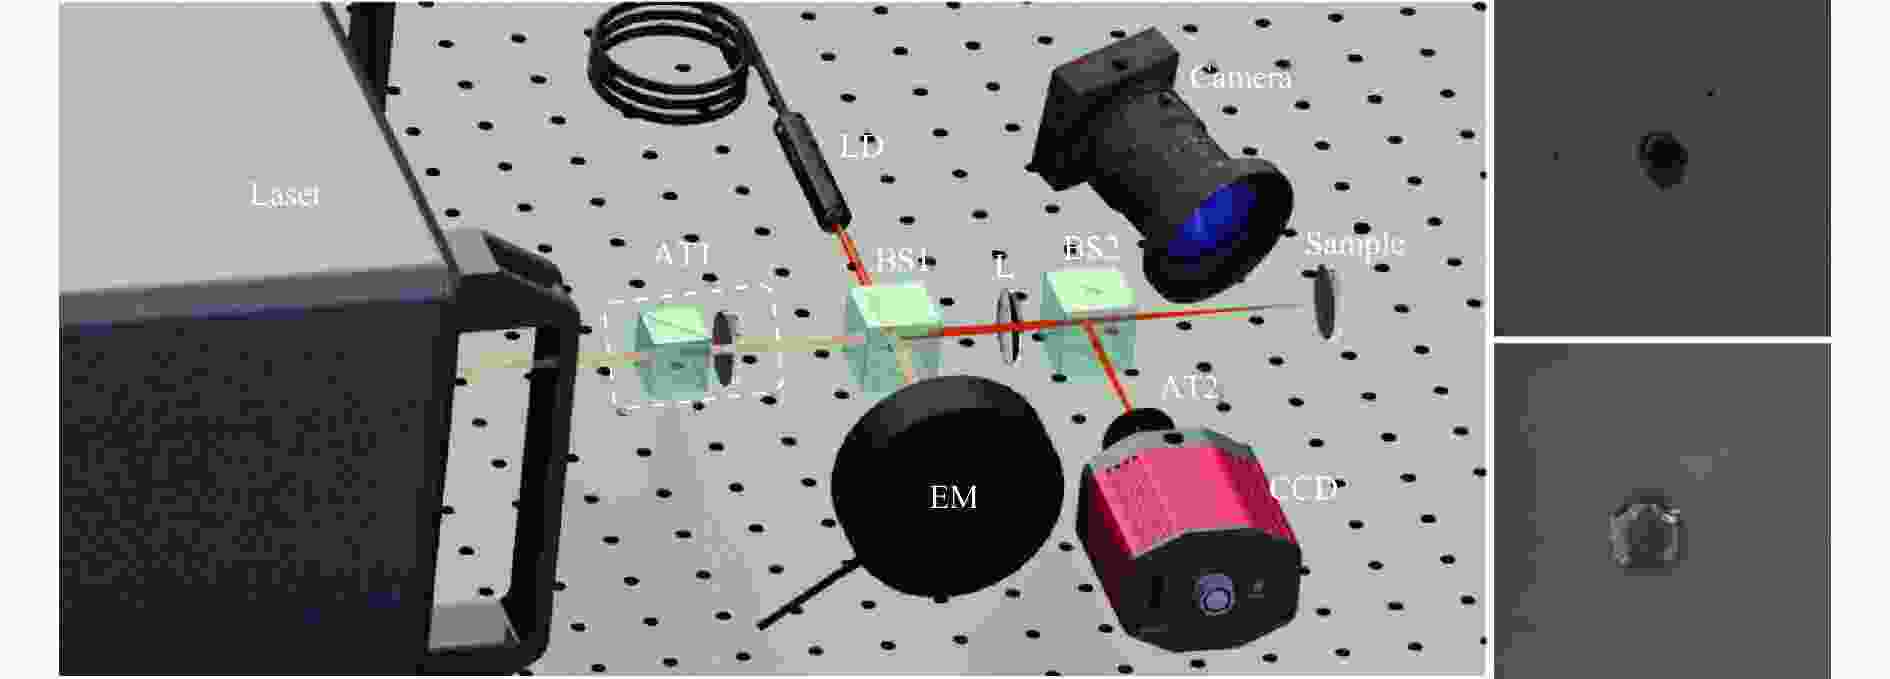
      Figure 1.  Schematic diagram of laser damage monitoring system

    • 文中提出的QELDD方法测量损伤阈值,是基于激光诱导损伤区域的量化,建立损伤程度与激光能量密度之间的对应关系,通过拟合方法评估损伤阈值。其中,对激光损伤程度的量化是通过元件表面损伤区域的三维测量实现,通过对不同能量密度下激光损伤情况多维度定量分析,总结激光损伤规律,筛选有效测量数据,减少因杂质、结构缺陷等外部因素的干扰,保证测量结果的准确性与稳定性。

      该方法测量流程如图2所示。第一步,通过激光损伤测量系统对待测样片进行激光损伤试验,使样品表面出现激光损伤并记录造成不同损伤对应的激光能量密度;第二步,基于白光显微干涉测量系统对激光产生的不同损伤区域三维测量,对损伤程度量化评估;第三步,结合损伤程度量化结果及对应激光能量密度构建激光损伤的离散点分布,通过线性拟合出损伤趋势,反推得到损伤阈值。

      Figure 2.  QELDD method flow chart

    • 在QELDD方法中,量化激光辐照产生的损伤程度,是评估LIDT值的关键环节,需要严格保证测量精度及稳定性,并且为防止测量过程对损伤区域产生额外影响,量化方法还需要具有无接触测量的特点。该方法最终采用白光显微干涉测量法[17-18],并在三维面形重构算法中结合超分辨处理,实现对激光损伤程度纳米级精度的三维表征。

      1)白光显微干涉测量技术

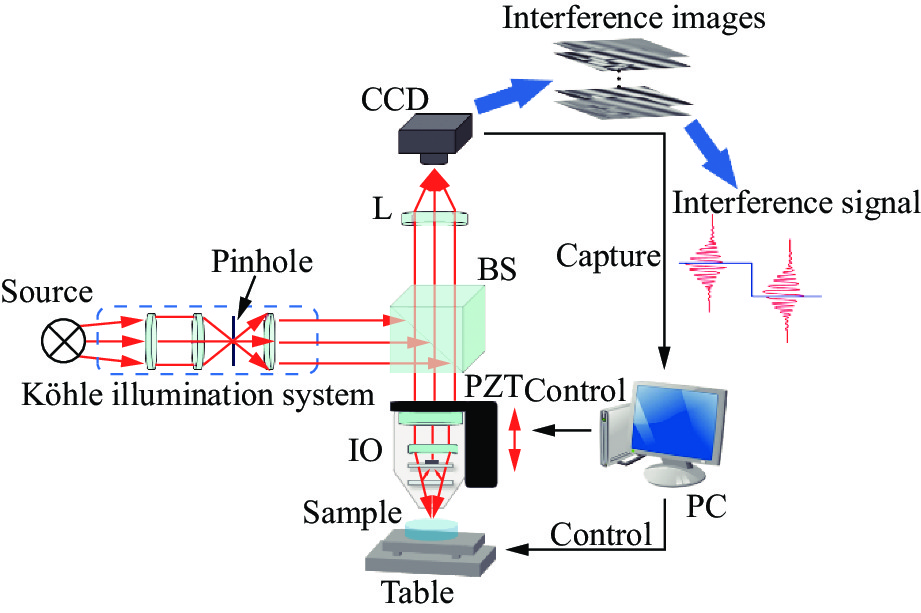
      白光显微干涉测量系统如图3所示,白光光源经过平行光调制后入射到分束器(BS)上,经分束器反射后进入干涉物镜(IO),经干涉物镜内的分光板后分为参考光与测量光,移动样品位移台,使参考光路与测量光路的光程差小于光源相干长度,产生干涉图,通过PZT位移器带动干涉物镜纵向扫描采样, CCD采集不同光程差的干涉图,提取出待测区域各像素处的干涉信号,计算零光程差位置(ZOPD),获得高度信息,构建待测样品的三维形貌。

      Figure 3.  Schematic diagram of the white-light interferometry system

      在待测面上某像素点测量位置处的纵向扫描白光干涉信号的光强分布可表示为:

      式中: $ {{{I}}_{bg}} $为背景光强,是干涉光强的直流部分;$ \gamma = \dfrac{{2\sqrt {{I_1}{I_2}} }}{{{I_1} + {I_2}}} $为干涉条纹衬比度;$ {l_c} = \dfrac{{{\lambda _c}^2}}{{\Delta \lambda }} $为光源的相干长度;$ {\lambda _c} $为中心波长;$ \Delta \lambda $为带宽;$ z $表示PZT位移器驱动物镜的垂直扫描位置;$ {z_0} $表示两光束光程差为零时,物镜所在的垂直位置(即为零光程差位置);$ h $为该测量像素点处的高度值,包含待测表面损伤程度信息;$ {\delta _0} $为光路系统内初始相位差。

      在得到单个像素单元处高度(深度)值后,结合像素单元成像尺寸,计算激光辐照产生的损伤体积,即为损伤程度的量化值。损伤体积计算公式如下:

      式中:$ a $与$ b $为像素单元成像区域的长度与宽度值;$ (x,y) $表示待测区域上的像素位置坐标。

      2) 图像超分辨算法

      在对白光显微干涉图处理过程中,对干涉图进行超分辨处理可以进一步丰富干涉图中的细节信息,提升激光损伤区域的测量精度。通过Bicubic插值法[19],对单个像素周围的16个像素加权平均得到像素点处的影响因子,插入不同数量的像素点,可以实现图像分辨率的提升。

      双三次插值法利用 Bicubic 函数作为基函数[20],Bicubic函数的表达式如下:

      式中:$ {{a}} = - 0.5 $。

      插值处理过程如图4所示,取原始图像中一像素点p,通过对p点周围16个整像素点的光强值进行加权平均计算得到对p点光强值的影响因子,并且根据16个像素点到p点距离不同,其权重也不同,距离越近,权重越大,计算公式为:

      式中:$ {G_{ij}} $为整数位置像素点;$ {\mu _{ij}} $为$ p $与$ {G_{ij}} $的纵向距离;$ {v_{ij}} $为$ p $与$ {G_{ij}} $的横向距离;$ I $表示该点的光强值;$ W $表示Bicubic函数。图3中的$ {G_{00}} $到$ p $点的横向距离是$ v $,纵向距离是$ \mu $,其对于$ p $的光强的权重是$ W(\mu )W(v) $,以此类推,计算不同像素处权重,获得亚像素位置处光强值。

      Figure 4.  Bicubic interpolation of interferogram

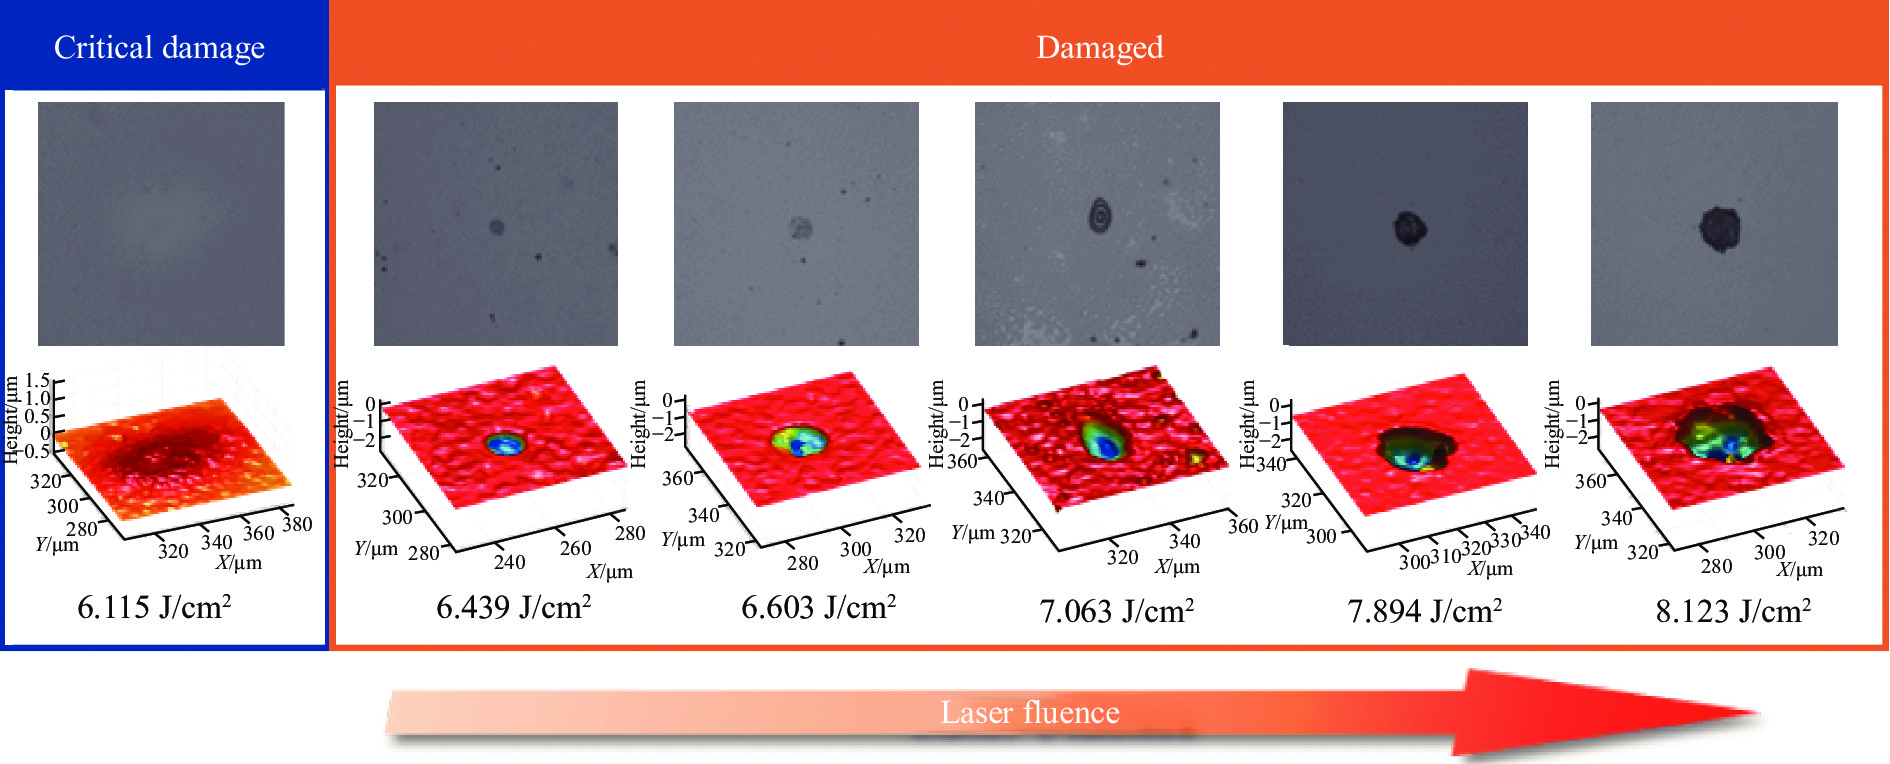
    • 在完成激光损伤程度量化后,结合对应的能量密度,得到激光损伤的趋势分布。图5为在对1064 nm窗口片(损伤阈值为6.3 J/cm2)损伤试验过程中,不同能量密度激光辐照下产生不同程度损伤的三维测量结果,从该图中可以看出该窗口片的损伤趋势。当处于临界损伤阈值时,表面并未出现明显损伤,但膜层出现凸起现象,是膜层受到激光辐照产生的热应力产生的轻微形变,当激光脉冲能量进一步提升,能量密度超过膜层损伤阈值,表面出现损伤坑洞,随着能量密度的增加,损伤区域的面积与深度明显增大,损伤程度加剧。将在下文中得到激光损伤程度量化数据设为纵坐标,能量密度设为横坐标,可获得损伤程度对应能量密度分布图;再对损伤程度分布图中各点作线性拟合,拟合方法采用最小二乘法,该方法通过最小化实验偏移误差的平方和匹配最佳拟合参数 。其拟合直线中的斜率和截距可由公式(5)的计算得到。得到拟合公式后,计算出与零损伤程度所对应的激光能量密度值即为激光诱导损伤阈值(LIDT)。

      Figure 5.  Laser damage degree of window plate under different fluence

      式中:$ ({x_i},{y_i}) $为离散坐标点,$ i = 3,4,5\cdots $;$ \overline x $、$ \overline y $分别为横、纵坐标的平均值。

    • 为验证所提出的图像超分辨白光显微干涉测量法,通过仿真元件表面激光损伤结构模型进行结果测试与分析。仿真模型是对一片镀有增透膜的窗口片在激光损伤试验中表面实际产生的激光损伤区域处理得到,对该窗口片损伤区域进行形貌测量,提取其三维空间分布信息,去除损伤边缘溅射杂质,只保留因激光冲击导致的坑陷区域结构,再进行滤波处理,获得损伤结构模型,该模型是从实际损伤结构中提取得到,具有激光冲击损伤代表性特征,可以有效地验证算法的三维重构效果。

      具体的仿真流程如下:将激光损伤结构模型作为待测区域,使用图像超分辨白光显微干涉测量法对结构模型进行三维形貌重构,比较重构结果与仿真结构模型,验证所提出方法的测量精度。

      仿真激光损伤结构三维模型如图6(a)所示,内部呈非均匀螺旋分布,存在较多细节结构分布,具有典型激光损伤结构特征。损伤区域纵向最大深度为3.6 μm,横向尺寸为1024 pixel×1024 pixel,与实验室白光干涉测量系统相机分辨率相同。在模拟白光干涉测量过程中,设定白光光源的中心波长为576 nm,光谱带宽为100 nm,纵向扫描步长为72 nm,仿真激光损伤结构模型的干涉图如图7所示。

      Figure 6.  3D measurement results of damage model. (a) Simulation damage model; (b) Three-dimensional measurement result; (c) Residual

      Figure 7.  Interferogram of simulation model

      仿真激光损伤结构模型的空间体积占比为22.03%,重构三维结果的空间体积占比为22.02%,二者相差约为0.01%,其最大纵向深度为3.598 μm,有效地还原出损伤结构的总体空间信息。重建三维结果与仿真结构的残差点云图如图6(c)所示,残差集中出现在凹陷内部不规则凸起部分,该部分由于细节信息较多,存在细微的高度提取误差。对计算结果的残差偏移量进行量化,将仿真模型图6(a)与测量结果图6(b)作差,偏差量空间分布如图8(a)所示,其最大值为0.76 μm,平均值为0.95 nm,图8(b)是偏差量的统计直方图,可以直观地看出偏差的分布区间集中在[−0.0098 μm, 0.0235 μm],该部分占整个数据量的99.35%,即偏差量主要集中在9.8~23.5 nm这个区间,重建残差及偏差在原始数据场中的占比定量地反映算法有着较好的精度。图8(c)是图6(a)与图6(b)在Y=512时横截面对比结果,两个曲线十分贴合。

      Figure 8.  Analysis of simulation results. (a) Spatial distribution of deviation; (b) Deviation histograms; (c) Cross-sectional comparison

    • 实验使用1064 nm激光谐振腔镜及窗口片作为测试样品,基底均为直径25.4 mm,厚度5 mm的熔融石英玻璃片,谐振腔镜镀有1064 nm波长增反膜,窗口片镀有近红外多层增透膜。该两种类型样品均为激光实验中的常用空间调制光学元件,具有激光元件的代表性与典型性,用以验证文中方法的测量效果。

      图9(a)是测量薄膜元件激光损伤系统,实验用1064 nm激光器,脉冲重复率为100 Hz,脉宽20 ns,最大输出能量为580 mJ;衰减器AT1是由偏振分束器和半波片组成的,通过旋转半波片进行能量强度调控;AT2是由两个可调衰减片(大恒光电,GCO-0703 M)组成,避免在监测聚焦光斑尺寸时损坏CCD相机;能量计EM是Coherent公司的J-50MB-IR能量计,CCD相机是Spiricon-OPHIR公司的SP620U-MIR光束质量分析仪。图9(b)是实验室自研白光显微干涉测量系统,光源是宽谱段LED光源,中心波长576 nm,带宽100 nm,干涉图采集模块使用IMPERX 公司的GEV-B1410M-SC000型号CCD相机,分辨率为1360 pixel×1024 pixel,像素尺寸为6.45 μm,配备10、20、100 倍干涉显微物镜,平面内最高可以实现0.06 μm单像素成像精度,纵向扫描模块使用PI公司生产的P-721, PIFOC高精度物镜扫描仪,扫描精度达到亚纳米量级。

      Figure 9.  Experimental measurement system. (a) Laser damage monitoring system; (b) White-light interferometry measurement system

      在实验中,笔者对激光器腔镜及窗口片进行单点多次激光辐照。为防止测试区域过近致使结果混淆,将每个样片按照钟表刻度划分为12个区域,分别对应不同的能量强度,在每个区域中选取一个位置作为测试点,对每个测试点进行100次激光辐照,让待测样片在激光不同能量密度下产生损伤。完成激光损伤操作后,使用算法优化的白光干涉法测量损伤区域,量化损伤程度,进行损伤趋势拟合。

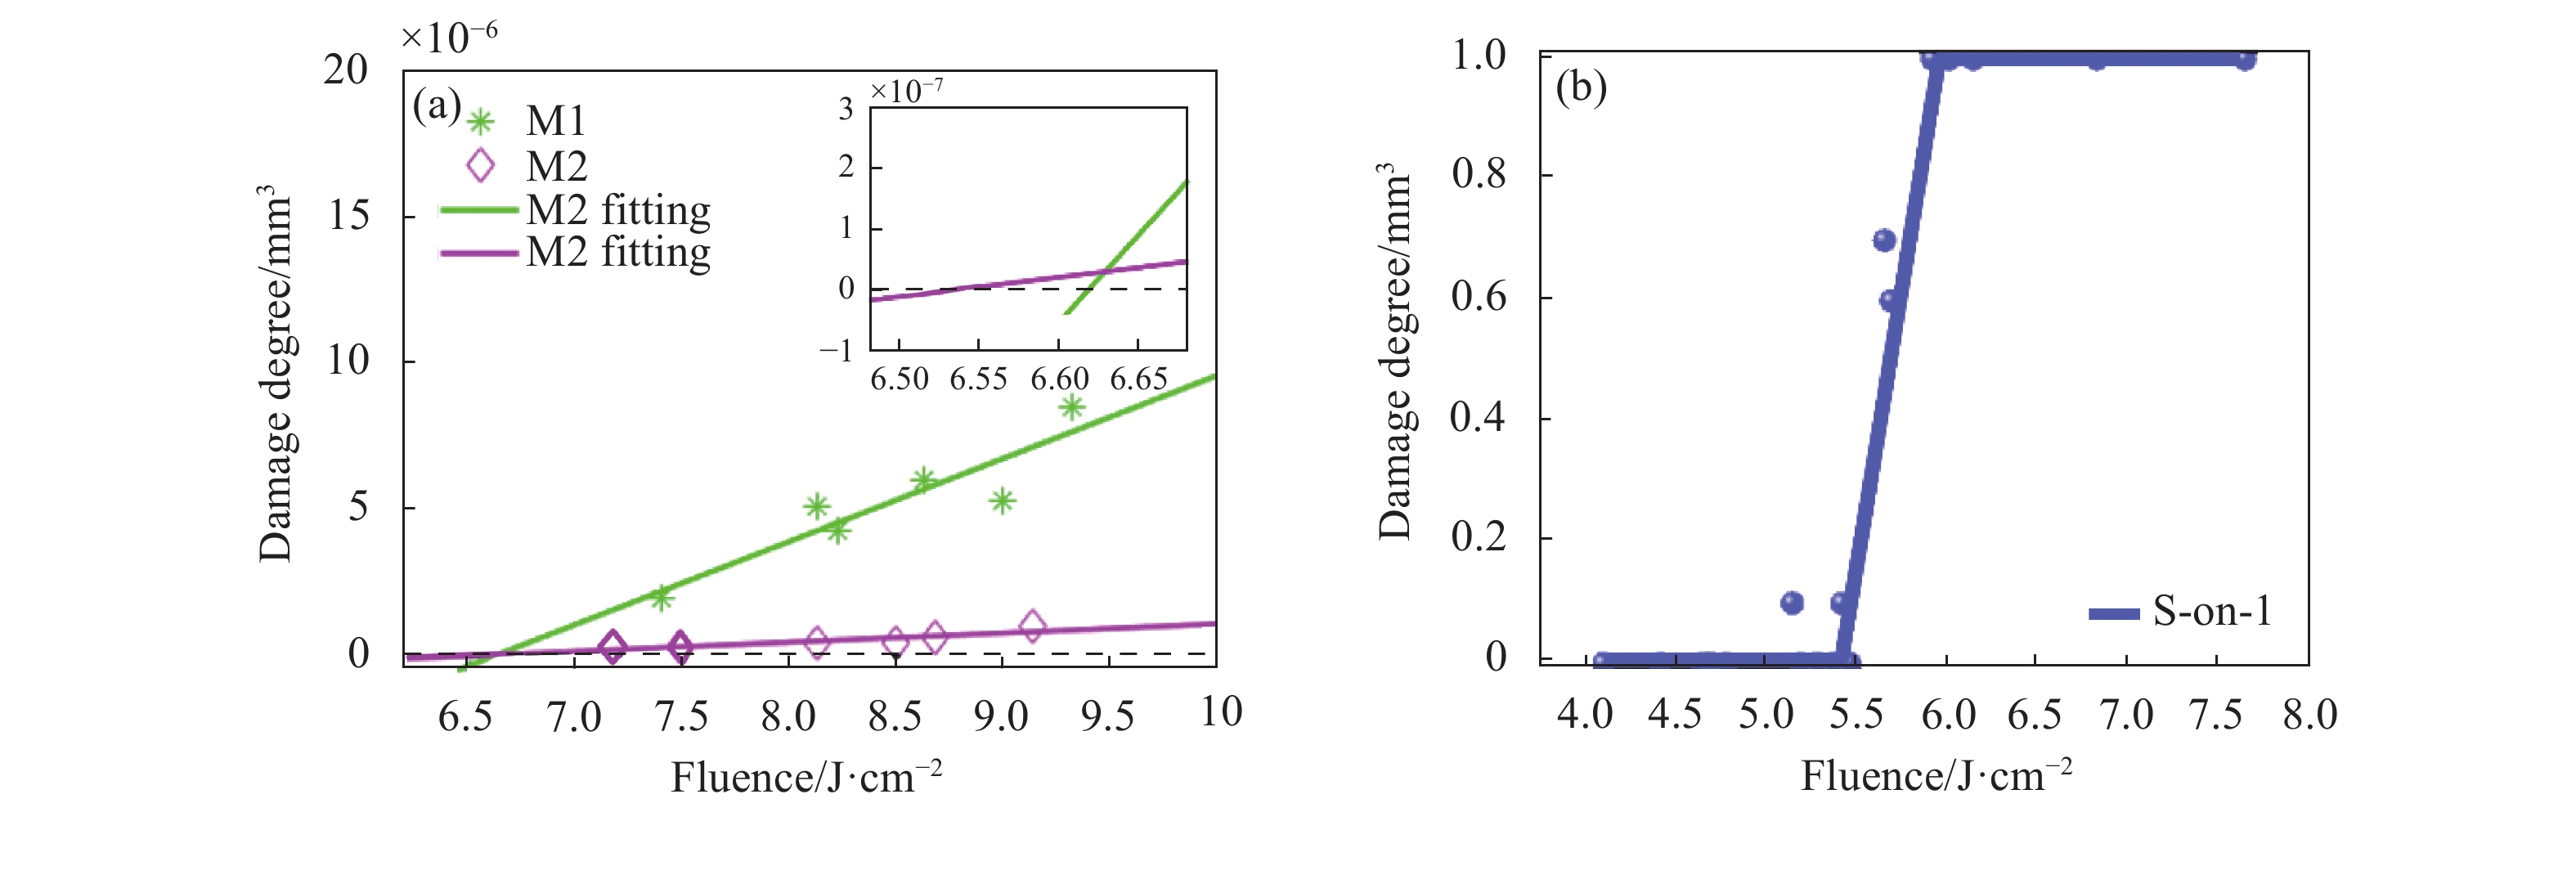
      腔镜及窗口片的QELDD测量结果分别如图10(a)和图11(a)所示。在图10(a)中,腔镜样片M1的激光损伤阈值结果为5.10 J/cm2,M2激光损伤阈值结果为5.61 J/cm2,标准差为0.361 J/cm2图11(a)中,窗口片W1的激光损伤阈值结果为6.62 J/cm2,W2的损激光伤阈值结果为6.53 J/cm2,标准差为0.064 J/cm2。两种样品的测量结果证明,QELDD方法有着较好的稳定性,薄膜样品的激光损伤虽然会收到激光器稳定性、环境扰动、镀膜工艺及内部缺陷等因素影响,但QELDD方法可以有效地筛选明显偏差点,基于有效损伤点进行拟合,具有较高的稳定性及鲁棒性。

      Figure 10.  Laser damage threshold measurement results of cavity mirrors. (a) QELDD method; (b) S-on-1 method

      Figure 11.  Laser damage threshold measurement results of windows. (a) QELDD method; (b) S-on-1 method

      为验证提出QELDD方法与国标测量结果是否一致,笔者用标准 S-on-1方法测试样品,S取100次。激光器腔镜测试结果如图10(b)及表1所示,评估激光损伤阈值约为5.53 J/cm2;窗口片测试结果见图11(b)及表2,评估激光损伤阈值约为6.33 J/cm2。从结果上看,QELDD法与S-on-1法测量结果相近,腔镜的结果相差不超过0.5 J/cm2,窗口片的结果相差不超过0.3 J/cm2,有着较高一致性。值得注意的是,在损伤概率统计过程中,发现存在一些统计数据点是偏离估算结果的,即在激光损伤阈值范围之外出现损伤,在图10(b)中,当激光能量密度为5.155 J/cm2时,其损伤概率为0.15,出现损伤点,存在偏差;同理,在图11(b)中,能量密度为5.887 J/cm2时,损伤概率为0.10,同样存在偏差损伤点。这些存在除激光能量之外诱因导致的损伤是难以避免的,如果不能有效筛除这些偏差数据,将会在一定程度上影响LIDT的测量精度。

      MethodSampleLIDT /J·cm−2
      QELDDM15.10
      M25.61
      S-on-1M35.53

      Table 1.  Damage threshold measurement results of laser resonator mirror

      MethodSampleLIDT/J·cm−2
      QELDDW16.62
      W26.53
      S-on-1W36.33

      Table 2.  Damage threshold measurement results of window plate

      在上述两种方法的测试过程中,方法S-on-1需要大量重复性实验,操作较为繁琐,测量结果精度难以保证,在出现激光输出不稳定、样品镀膜不均匀、材质有缺陷等问题导致的误差损伤时,损伤概率容易出现异常。在损伤概率从0~1跃变区域出现不定原因损伤时,会导致阈值评估范围出现偏差,为保证测试结果准确性及可靠性,需要对新的样片重复实验,增加工作量与测量时间。文中所提出QELDD方法基于元件损伤程度评估激光损伤阈值,不需要大量重复性激光损伤实验,任何激光损伤均可作为评估损伤阈值的重要参数,并且在对损伤区域三维测量过程中,根据测量结果是否满足激光损伤特征进行判断,筛除异常数据,保留有效损伤点的数据拟合,大大提升测量效率和降低成本。

    • 文中提出一种基于损伤程度量化评估的新型光学薄膜激光损伤阈值测量方法,通过图像超分辨白光显微干涉测量法对激光损伤区域进行高精度三维表征及量化,总结激光损伤结构特征,该方法通过仿真验证相对误差小于0.01%。然后基于激光损伤程度的量化参数,拟合计算激光损伤阈值。实验搭建1064 nm激光损伤系统,以激光谐振腔镜和窗口片作为样品进行测试,两种样品结果标准差分别是0.361 J/cm2和0.064 J/cm2,并将测量结果与S-on-1结果进行比较,结果偏差不超过0.5 J/cm2,有着较好的稳定性及准确性。所提出的QELDD法在对激光损伤区域量化表征过程中,基于损伤特征可以区分有效与无效损伤点,避免无效损伤对结果拟合的影响,有效地提升测量效率。该方法具有一般通用性,不仅局限于1064 nm波段元件,可以为多种波段光学元件的LIDT进行测量,为LIDT测量提供一种新的思路,有助于开展光学元件激光损伤机理研究, 为完善光学元件的制造生产工艺与镀膜加工工艺提供理论依据。

Reference (20)

Catalog

    /

    DownLoad:  Full-Size Img  PowerPoint
    Return
    Return