Volume 53 Issue 4
Apr.  2024
Turn off MathJax
Article Contents

Shu Yukang, Zhao Chao, Du Xiaoyu, He Xiang, Zhao Hang, Shi Xiaofeng, Ma Jun. Depth extension technique of spectral domain optical coherence tomography[J]. Infrared and Laser Engineering, 2024, 53(4): 20230720. doi: 10.3788/IRLA20230720
Citation: Shu Yukang, Zhao Chao, Du Xiaoyu, He Xiang, Zhao Hang, Shi Xiaofeng, Ma Jun. Depth extension technique of spectral domain optical coherence tomography[J]. Infrared and Laser Engineering, 2024, 53(4): 20230720. doi: 10.3788/IRLA20230720

Depth extension technique of spectral domain optical coherence tomography

doi: 10.3788/IRLA20230720
Funds:  Shandong Province Key Research and Development Plan Project (2019GHY112027)
  • Received Date: 2023-12-23
  • Rev Recd Date: 2024-01-13
  • Publish Date: 2024-04-25
  •   Objective   Spectral domain optical coherence tomography (SD-OCT) is a technique used for tomography and three-dimensional imaging of the internal microstructure of materials and biological tissues. By performing Fourier transform on the collected interference signal, the SD-OCT system can reconstruct image depth information, providing a detailed view of the sample's structure. However, the resulting image includes a mirror image with zero phase delay symmetry, which can be problematic. To address this issue, the sample is positioned on the zero phase delay side during scanning to eliminate the influence of the mirror image. This approach, while effective, only utilizes half of the imaging range space. Improving the detection depth of OCT systems by eliminating complex conjugate images is crucial for enhancing the accuracy and reliability of the imaging process.  Methods   The deconjugated imaging system was developed from the original SD-OCT system (Fig.3). The system utilizes a broadband light source, with the light being split by a beam splitting cube into the reference arm and sample arm. The reference arm consists of a collimator and a reflector, while the sample arm includes a two-dimensional galvanometer, scanning lens, and sample stage. The two-dimensional galvanometer enables scanning of the sample in both X and Y directions by deflecting the reflector. The entire sample arm system is finely tuned using an electronic displacement platform to adjust the relative position, create beam offset, and add carrier frequency. The sample stage can be moved axially to focus imaging at different depths within the sample, allowing for the superposition of focusing planes and enhancing the imaging depth.  Results and Discussions   To eliminate the influence of the complex conjugate image, the distance between the beam and the center of the mirror is adjusted to 1.2 mm. Before the spectral data undergoes the standard image reconstruction process, the complex conjugate image is removed using the added carrier frequency through Hilbert transform (Fig.5). This results in a doubling of the imaging range compared to the original image. However, the focal depth of the lens is much smaller than the imaging depth, leading to a decrease in lateral resolution outside the depth of field (DOF) range. By focusing on imaging samples at different depths, extracting the focal plane, and using Gaussian weighted fusion (Fig.6), the imaging depth of the system is doubled from 1.97 mm to 3.94 mm, without being limited by the lens depth of focus. The sample structure information is clearly visible (Fig.7). When applied to biological tissues, the beam penetration depth is limited by the scattering and absorption properties of the tissues. The imaging depth is increased from 0.51 mm to 0.65 mm, with well-connected tissue signals in the vertical direction. The strip-like structure of the colon wall recess is clearly visible (Fig.8).  Conclusions   A method has been developed to improve the depth and quality of OCT imaging by combining the carrier frequency method to remove conjugate images and beam focusing at different depths of the sample. This method was tested on various samples, including multi-layer transparent films and biological tissues. Results showed that the effective imaging depth for transparent films doubled to 3.94 mm, while for colon tissue, the imaging depth increased from 0.51 mm to 0.65 mm, a 27.5% increase. The extended depth also allowed for clearer display of deep structural information in the sample.
  • [1] Yi Ji. Visible light optical coherence tomography in biomedical imaging [J]. Infrared and Laser Engineering, 2019, 48(9): 0902001. (in Chinese)
    [2] Su Li, Song Kaiwen, Lv Peitong, et al. Optical coherence tomography technology for diagnosis of diseases in organs [J]. Infrared and Laser Engineering, 2022, 51(10): 20210803. (in Chinese)
    [3] Choma M A, Sarunic M V, Yang C, et al. Sensitivity advantage of swept source and fourier domain optical coherence tomography [J]. Optics Express, 2003, 11(18): 2183-2189. doi:  10.1364/OE.11.002183
    [4] Wojtkowski M, Kowalczyk A, Leitgeb R, et al. Full range complex spectral optical coherence tomography technique in eye imaging [J]. Optics Letters, 2002, 27(16): 1415-1417. doi:  10.1364/OL.27.001415
    [5] Kawagoe H, Yamanaka M, Makita S, et al. Full-range ultrahigh-resolution spectral-domain optical coherence tomography in 1.7 μm wavelength region for deep-penetration and high-resolution imaging of turbid tissues [J]. Applied Physics Express, 2016, 9(12): 127002. doi:  10.7567/APEX.9.127002
    [6] Lin Jiewen, Zhong Shuncong, Zhang Qiukun, et al. Five-frame variable phase-shifting method for full-range spectral-domain optical coherence tomography [J]. Applied Sciences-Basel, 2018, 8(9): 1580. doi:  10.3390/app8091580
    [7] Vakhtin A B, Peterson K A, Kane D J. Resolving the complex conjugate ambiguity in Fourier domain OCT by harmonic lock-in detection of the spectral interferogram [J]. Optics Letters, 2006, 31(9): 1271-1273. doi:  10.1364/OL.31.001271
    [8] Vakhtin A B, Peterson K A, Kane D J. Demonstration of complex-conjugate-resolved harmonic Fourier-domain optical coherence tomography imaging of biological samples [J]. Applied Optics, 2007, 46(18): 3870-3877. doi:  10.1364/AO.46.003870
    [9] Zhang J, Nelson J S, Chen Z P. Removal of a mirror image and enhancement of the signal-to-noise ratio in Fourierdomain optical coherence tomography using an electro-optic phase modulator [J]. Optics Letters, 2005, 30(2): 147-149. doi:  10.1364/OL.30.000147
    [10] Leitgeb R A, Michaely R, Lasser T, et al. Complex ambiguity-free Fourier domain optical coherence tomography through transverse scanning [J]. Optics Letters, 2007, 32(23): 3453-3455. doi:  10.1364/OL.32.003453
    [11] Bachmann A H, Leitgeb R A, Lasser T. Heterodyne fourier domain optical coherence tomography for full range probing with high axial resolution [J]. Optics Express, 2006, 14(4): 1487-1496. doi:  10.1364/OE.14.001487
    [12] Wojtkowski M, Srinivasan V J, Ko T H, et al. Ultrahigh-resolution, high-speed, Fourier domain optical coherence tomography and methods for dispersion compensation [J]. Optics Express, 2004, 12(11): 2404-2422. doi:  10.1364/OPEX.12.002404
    [13] Götzinger E, Pircher M, Baumann B, et al. Speckle noise reduction in high speed polarization sensitive spectral domain optical coherence tomography [J]. Optics Express, 2011, 19(15): 14568-14584. doi:  10.1364/OE.19.014568
    [14] Podoleanu A G, Dobre G M, Jackson D A. En-face coherence imaging using galvanometer scanner modulation [J]. Optics Letters, 1998, 23(3): 147-149. doi:  10.1364/OL.23.000147
    [15] Abu S S, Seong D, Wijesinghe R E, et al. Development of a deviated focusing-based optical coherence microscope with a variable depth of focus for high-resolution imaging [J]. Optics Express, 2023, 31(2): 1258-1268. doi:  10.1364/OE.479709
    [16] Li Y D, Tang P J, Song S Z, et al. Electrically tunable lens integrated with optical coherence tomography angiography for cerebral blood flow imaging in deep cortical layers in mice [J]. Optics Letters, 2019, 44(20): 5037-5040. doi:  10.1364/OL.44.005037
    [17] Luo Y M, Cui D Y, Yu X J, et al. Endomicroscopic optical coherence tomography for cellular resolution imaging of gastrointestinal tracts [J]. Journal of Biophotonics, 2018, 11(4): e201700141. doi:  10.1002/jbio.201700141
    [18] Dong B, Pan B, Zhang Y, et al. Microdefect identification in polymers by mapping depth-resolved phase-difference distributions using optical coherence tomography [J]. Polymer Testing, 2018, 68: 233-237. doi:  10.1016/j.polymertesting.2018.04.023
    [19] Zeng Y F, Xu S Q, Chapman W C, et al. Real-time colorectal cancer diagnosis using PR-OCT with deep learning [J]. Theranostics, 2020, 10(6): 2587-2596. doi:  10.7150/thno.40099
  • 加载中
通讯作者: 陈斌, bchen63@163.com
  • 1. 

    沈阳化工大学材料科学与工程学院 沈阳 110142

  1. 本站搜索
  2. 百度学术搜索
  3. 万方数据库搜索
  4. CNKI搜索

Figures(9)

Article Metrics

Article views(8) PDF downloads(3) Cited by()

Related
Proportional views

Depth extension technique of spectral domain optical coherence tomography

doi: 10.3788/IRLA20230720
  • Institute of Physics and Optoelectronic Engineering, Ocean University of China, Qingdao 266100, China
Fund Project:  Shandong Province Key Research and Development Plan Project (2019GHY112027)

Abstract:   Objective   Spectral domain optical coherence tomography (SD-OCT) is a technique used for tomography and three-dimensional imaging of the internal microstructure of materials and biological tissues. By performing Fourier transform on the collected interference signal, the SD-OCT system can reconstruct image depth information, providing a detailed view of the sample's structure. However, the resulting image includes a mirror image with zero phase delay symmetry, which can be problematic. To address this issue, the sample is positioned on the zero phase delay side during scanning to eliminate the influence of the mirror image. This approach, while effective, only utilizes half of the imaging range space. Improving the detection depth of OCT systems by eliminating complex conjugate images is crucial for enhancing the accuracy and reliability of the imaging process.  Methods   The deconjugated imaging system was developed from the original SD-OCT system (Fig.3). The system utilizes a broadband light source, with the light being split by a beam splitting cube into the reference arm and sample arm. The reference arm consists of a collimator and a reflector, while the sample arm includes a two-dimensional galvanometer, scanning lens, and sample stage. The two-dimensional galvanometer enables scanning of the sample in both X and Y directions by deflecting the reflector. The entire sample arm system is finely tuned using an electronic displacement platform to adjust the relative position, create beam offset, and add carrier frequency. The sample stage can be moved axially to focus imaging at different depths within the sample, allowing for the superposition of focusing planes and enhancing the imaging depth.  Results and Discussions   To eliminate the influence of the complex conjugate image, the distance between the beam and the center of the mirror is adjusted to 1.2 mm. Before the spectral data undergoes the standard image reconstruction process, the complex conjugate image is removed using the added carrier frequency through Hilbert transform (Fig.5). This results in a doubling of the imaging range compared to the original image. However, the focal depth of the lens is much smaller than the imaging depth, leading to a decrease in lateral resolution outside the depth of field (DOF) range. By focusing on imaging samples at different depths, extracting the focal plane, and using Gaussian weighted fusion (Fig.6), the imaging depth of the system is doubled from 1.97 mm to 3.94 mm, without being limited by the lens depth of focus. The sample structure information is clearly visible (Fig.7). When applied to biological tissues, the beam penetration depth is limited by the scattering and absorption properties of the tissues. The imaging depth is increased from 0.51 mm to 0.65 mm, with well-connected tissue signals in the vertical direction. The strip-like structure of the colon wall recess is clearly visible (Fig.8).  Conclusions   A method has been developed to improve the depth and quality of OCT imaging by combining the carrier frequency method to remove conjugate images and beam focusing at different depths of the sample. This method was tested on various samples, including multi-layer transparent films and biological tissues. Results showed that the effective imaging depth for transparent films doubled to 3.94 mm, while for colon tissue, the imaging depth increased from 0.51 mm to 0.65 mm, a 27.5% increase. The extended depth also allowed for clearer display of deep structural information in the sample.

    • 光学相干层析成像技术(Optical Coherence Tomography,OCT)是一种新型的光学成像技术,能够对材料和生物组织内部微观结构进行层析和三维结构成像[12]。具有分辨率高,实时成像速度快,无损检测等优点。根据技术路径的不同,OCT分为时域OCT和频域OCT两大类。频域OCT无须参考臂的纵向扫描,其成像速度更快,探测灵敏度更高,性能要优于时域。频域OCT分为谱域OCT(spectral domain OCT ,SD-OCT)和扫频OCT(swept source OCT,SS-OCT) [3]

      近年来,SD-OCT得到了长足的发展,然而复共轭镜像的存在却限制了其应用。SD-OCT系统通过对采集的干涉信号进行傅里叶变换重构图像深度信息,形成的图像不但包括样品本身的层析结构图像,还包括一个关于零相位延迟对称的镜像。由于镜像存在,无法清晰分辨或定位物体的层析结构,尤其是结构复杂的生物组织,为了避免共轭镜像相互混叠影响图像,实际SD-OCT扫描会把样品放置于零相位延迟的一侧,能够分开复共轭镜像与原图像,使其无法交叠,但是这样只是利用了实际成像范围空间的一半。去除复共轭镜像可以使成像范围空间加倍,可以把零相位延迟放置于样品的任何地方。这样去复共轭镜像就显得意义十分重大。

      为了去除复共轭镜像,利用OCT成像的全范围空间,在过去提出了许多技术。主要是包括移相法、相位调制法以及载频法。移相法基本原理是多次移动参考臂,引入相位差,记录干涉信号。当光程差变化时,干涉条纹的位置也作相应的移动[45]。五帧可变相移法不受多色误差的影响,提高了复共轭镜像的抑制[6]。但是由于色差和相位步进的准确性限制,复共轭镜像的抑制比较低,对小样本运动和干涉仪的机械稳定性极为敏感。基于正弦调制谐波探测能够调制相位来有效的去除复共轭镜像,使参考镜按正弦规律运动或者使用其他的相位调节器来调制相位[78],正弦相位调制方法信号获取容易且复共轭抑制率高。但是由于调制信号过程较为复杂,成像速度较慢。基于载频法去除复共轭的方法也很快被提出,在光束上添加一定的载频用以区分共轭像[911],添加载频的方式多样化,如利用电光、声光晶体以及光束偏移来添加载频,通过载频直接分离交叠的共轭镜像,取其中一项构造复数频谱,同时还消除了低频噪声和自相关像。载频法解决了复共轭镜像抑制率比较低的问题,且引入载频的方式简便,但是会引入色散[1213],需要使用软件补偿,对于高分辨率系统会产生影响,导致图像清晰度的下降。对于移相法和相位调制法,主要受实验复杂度与准确度的影响,而载频法则受图像清晰度困扰。

      文中提出了一种基于载频法去除复共轭镜像与调节光束聚焦平面扩展焦深相结合的方法来解决SD-OCT的成像深度与清晰度问题。通过样品臂整体移动添加载频,利用载频去除复共轭镜像信息。精确轴向移动控制样品台来对样品不同深度聚焦成像,实现聚焦平面的加权叠加,以解决焦深的限制,提升图像质量。

    • SD-OCT系统的“穿透深度”定义为由于光衰减导致的成像深度限制。穿透深度主要受光功率与样品折射率的影响。而 “成像范围”则被定义为在没有光学衰减的情况下系统可重建样品结构信息的最大深度。成像范围由光源波长以及光谱仪采样间隔决定。除此之外,成像范围还与零相位延迟的位置有关,当零相位延迟的位置设置于样品内部时,最大成像范围比零相位延迟设置于样品外时扩大一倍。

      SD-OCT系统最终重构的二维样品结构层析图像的成像深度,即“有效成像深度”,取决于穿透深度和系统成像范围中较小的那个。

      在对干涉信号进行傅里叶变换重构图像时,会产生复共轭镜像,其与原图像关于零相位延迟对称。正常OCT系统通过将零相位延迟设置在样品外部来去除复共轭镜像,但是这样会损失一半的成像范围。而当零相位延迟设置于样品内部时,复共轭镜像与原图像又会重叠,无法得到有效图像。

      文中将零相位延迟设置在样品内部,通过添加载频的方法去除复共轭镜像信号。具体实现方法如图1所示,通过扫描光束偏离扫描振镜的转轴中心一定距离,给系统引入一个额外的调制频率。

      Figure 1.  Schematic diagram of beam offset

      在正常SD-OCT系统扫描中,样品光束经过振镜中心,该振镜相对于入射光束的角度为45°,此时参考臂和样品臂之间的光程差(OPD)为零。把入射光束从振镜中心垂直移开一段距离d,由光束偏移的概念可知,会产生一定的光程差[14]。当振镜在扫描时,偏转角度为θ,通过偏转实现线扫描。

      由于光束偏移,光束路径发生变化,引入的光程差可以表示为:

      式中:h为振镜中心到扫描振镜的距离;θ为振镜偏转的角度;d为入射光垂直偏移的距离。由于SD-OCT系统扫描角度$ \theta $比较小,所以公式(1)近似为:

      第一项为二阶非线性项,相比于第二项可以忽略,所以引入的相位移动$ \varphi $可以表示为:

      因此,最终频谱图中引入调制频率$ {f}_{c} $可以表示为:

      式中:$ \omega $为振镜偏转的角速度。

      文中利用这个附加调制频率去除复共轭镜像,在傅里叶变换重构OCT图像之前,利用希尔伯特变换构造空间谱图的解析信号,使信号频谱仅含有正频率成分,从而去除复共轭镜像信息,最终实现去复共轭OCT系统相较普通OCT系统成像范围翻倍。

      SD-OCT系统中,随着有效成像深度的增加,扫描透镜的聚焦深度(DOF)与横向分辨率互相制约的问题也随之凸显。聚焦深度与横向分辨率相互制约,聚焦深度等于瑞利长度${z}_{{\rm{R}}}$的两倍,可以表示为:

      式中:$ \Delta x $为横向分辨率;$ \lambda $为光源波长。要获得横向分辨率较高图像,需要高数值孔径的物镜,但是数值孔径太高会减小聚焦深度,导致焦深外探测区域外的信号出现失真问题。这个问题在扩展成像范围后尤为明显。当成像范围远大于聚焦深度时,焦深之外的图像分辨率迅速下降。

      在不牺牲横向分辨率的情况下延长DOF的一个比较实用的解决方案是沿成像样品的深度方向轴向移动样品光束的焦点,如图2所示,OCT系统光源为高斯光源,每隔一半DOF的深度采集信号,对不同深度焦平面进行提取,高斯加权后叠加。

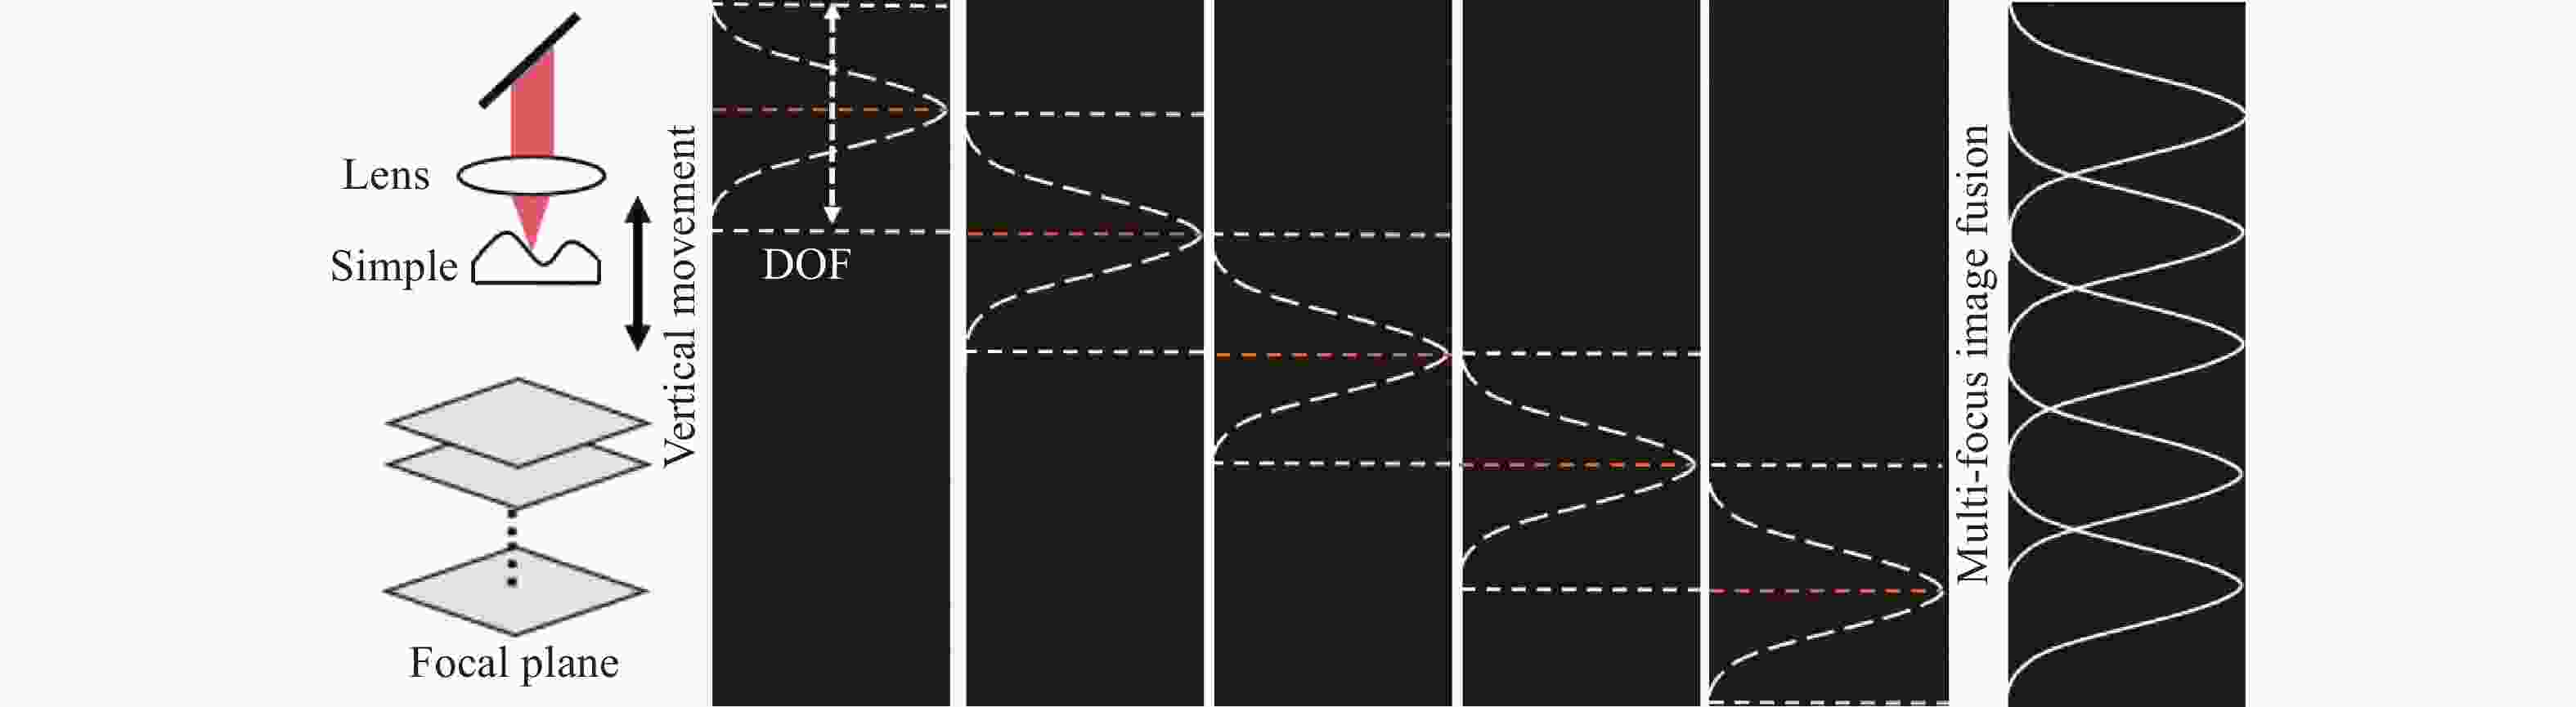
      Figure 2.  Schematic diagram of focal plane fusion

      在文中,在不影响去除复共轭镜像的影响下通过轴向移动扫描光学元件或成像平台来实现移动光束的轴向焦点,同时参考臂信号也不受影响。

    • 文中实验所采用的SD-OCT系统如图3所示。宽带光源为SD-OCT系统(Ganymede 621, Thorlabs,美国)自带系统光源、光谱仪,中心波长为900 nm,系统带宽为150 nm,扫描频率100 kHz。宽带光源的输入光由一个分束立方体分光分别传输到参考臂和样品臂中。参考臂由准直器和反射镜组成。样品臂由二维振镜、扫描透镜和样品台组成。二维振镜通过XY反射镜偏转来实现样品的二维扫描。整个样品臂系统基于电控位移平台精细调节,通过调节振镜与光束相对位置来使光束产生偏移添加载频。样品由位移台精确控制光束聚焦深度。扫描透镜用于将光束聚焦到样品,扫描透镜焦距为54 mm,聚焦深度为0.40 mm。样品臂与参考臂的干涉信号由分束立方体返回SD-OCT系统,显示器上显示实时OCT B扫描图像(B扫描图像即样品二维层析结构图像)。此OCT系统中的横向分辨率为11.46 µm,轴向分辨率为3.37 µm,最大成像范围为1.97 mm。

      Figure 3.  Schematic of the SD-OCT system

    • 实验所选取的样品是具有一定曲面的多层透明片。多层透明片折射率低,光束衰减小,穿透深度远大于成像范围,此时样品的有效成像深度受成像范围限制,即有效成像深度大小等于成像范围。去复共轭镜像的目标将成像范围扩大一倍。

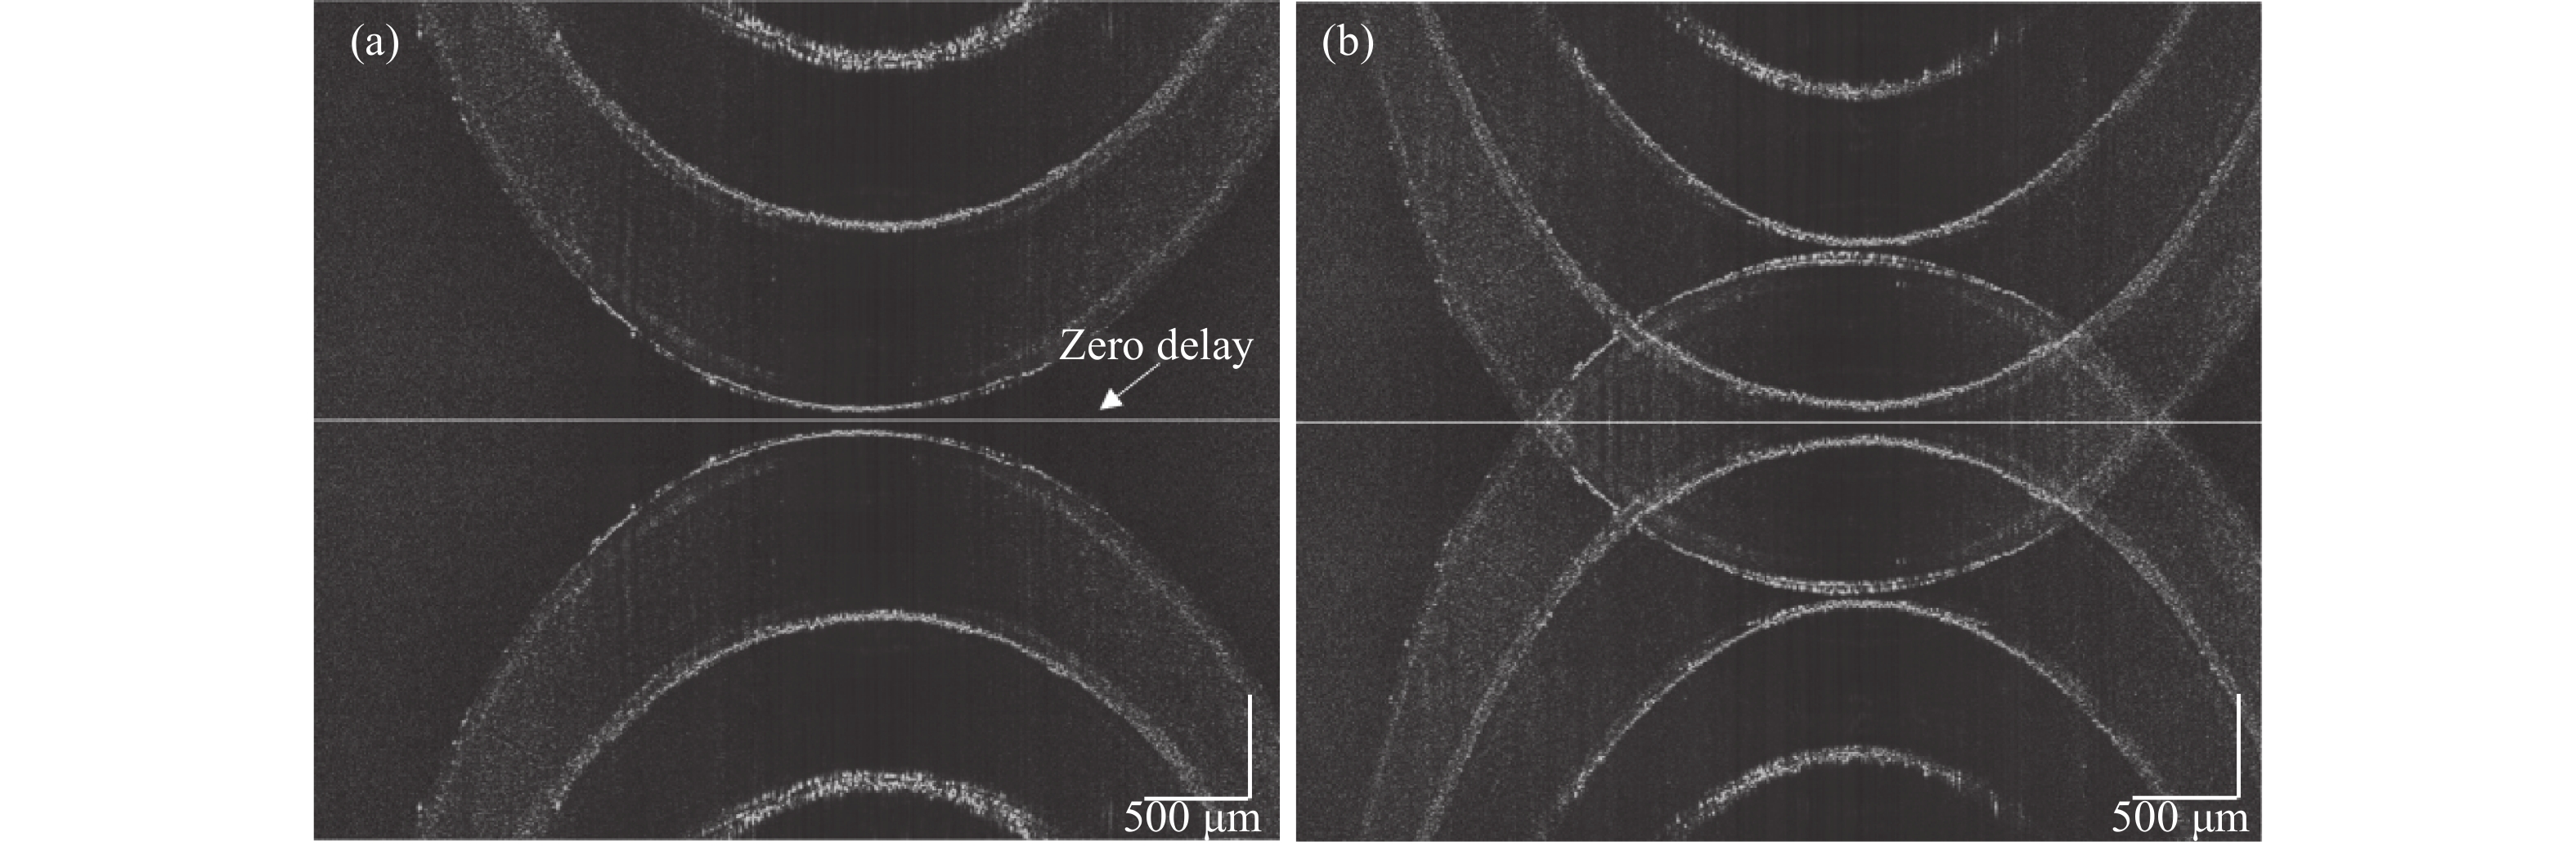
      在样品同一轴向位置采集OCT信号,对每个B扫描记录干涉信号。图4(a)显示了使用标准SD-OCT傅立叶变换算法得到的层析图像,此时光束聚焦在样品表面,图中亮线即为零延迟相位处,此时零相位延迟设置在样品外部,复共轭镜像与原图像并无交叠部分,此时只需要舍弃一半成像范围空间即可消除复共轭镜像,这正是普通OCT系统成像的方式,但是这种方式未能利用全部成像范围空间。图4(b)显示了光束聚焦在样品内部图像,轴向移动成像平台一定距离,使光束聚焦在样品内部,保持参考臂不变,此时由于参考臂与样品臂的相对位置发生变化,零相位延迟位置与光束聚焦位置相同,都设置在样品内部,复共轭镜像与原图像关于零相位延迟对称,真实的微观结构与复共轭镜像重叠,使得OCT图像模糊,无法观测到样品信息。同时由于光束聚焦在样品内部,受透镜聚焦深度限制,样品表层远离焦深范围处的图像信号质量有所下降。

      Figure 4.  Full range SD-OCT image. (a) Zero delay set outside the sample; (b) Zero delay set inside the sample

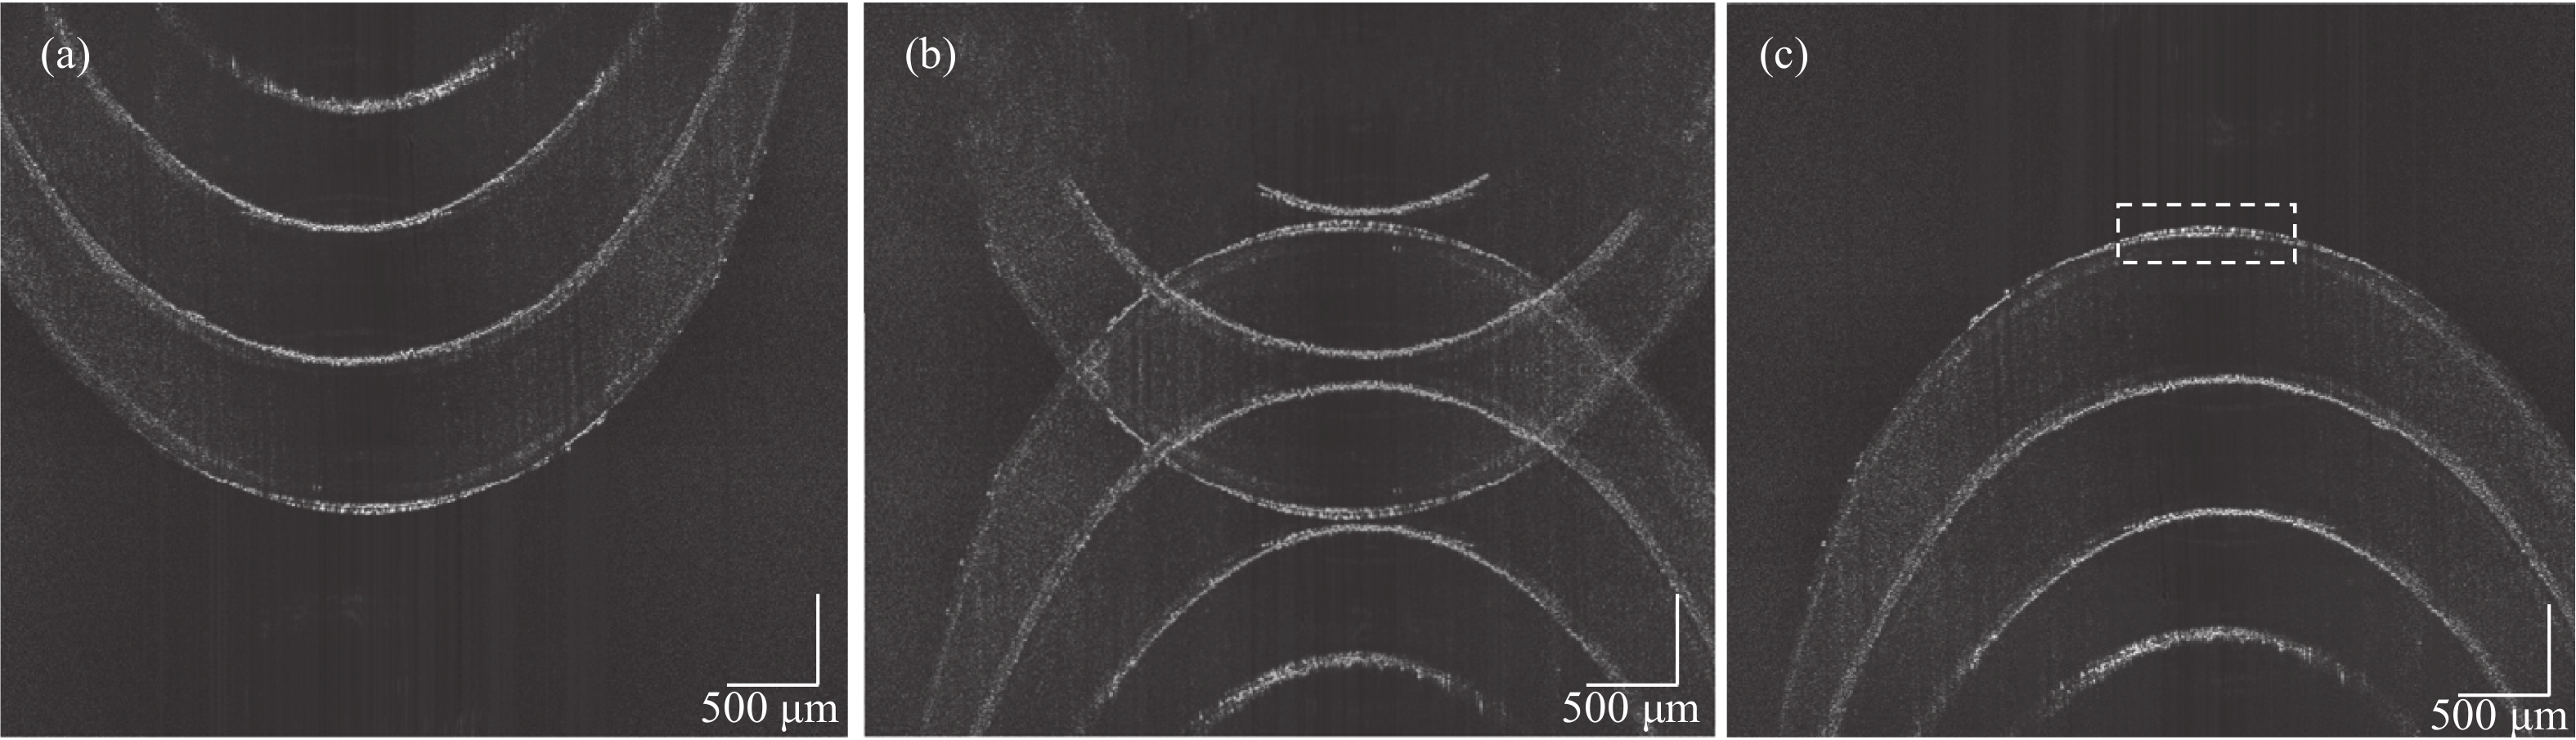
      首先要消除复共轭镜像的影响。在该实验中,基于电控位移平台精确移动整个样品臂系统,光束与振镜中心产生偏移,添加一定的载频。图4(b)是光束未产生偏移时重构的图像。光束偏移而产生的载频大小受样品固有空间频率的影响。光束相对振镜向下偏移为正向偏移。A扫描之间的时间间隔为10 μs,扫描速率为100 kHz。在此A扫描采样率下,将振镜的角速度设置为1.05 rad/s。图5为光束不同偏移距离下去除复共轭镜像的效果。当光束偏移距离为−0.8 mm时,即光束相对振镜向上偏移,此时样品信号被滤除,仅留下复共轭镜像信息。当偏移距离为0.4 mm时,由于附加的载波频率不够,不能完全去除复共轭镜像信息。当光束偏移振镜中心的距离设置为0.8 mm时,能够有效去除复共轭镜像信息。当偏移距离大于0.8 mm时,光谱信号及二维图像不再发生变化,已完全去除复共轭信号。最终偏移距离设置为0.8 mm,由公式(4)计算出对应的附加载频为3.7 kHz。获取重建图像前的OCT干涉信号,在光谱数据经过图像重建的标准流程前,先通过希尔伯特变换基于所加的载频,滤除负频信号,去除复共轭镜像的影响,再通过光谱标定,傅里叶变换以及滤波去噪获得去除复共轭镜像的OCT图像。

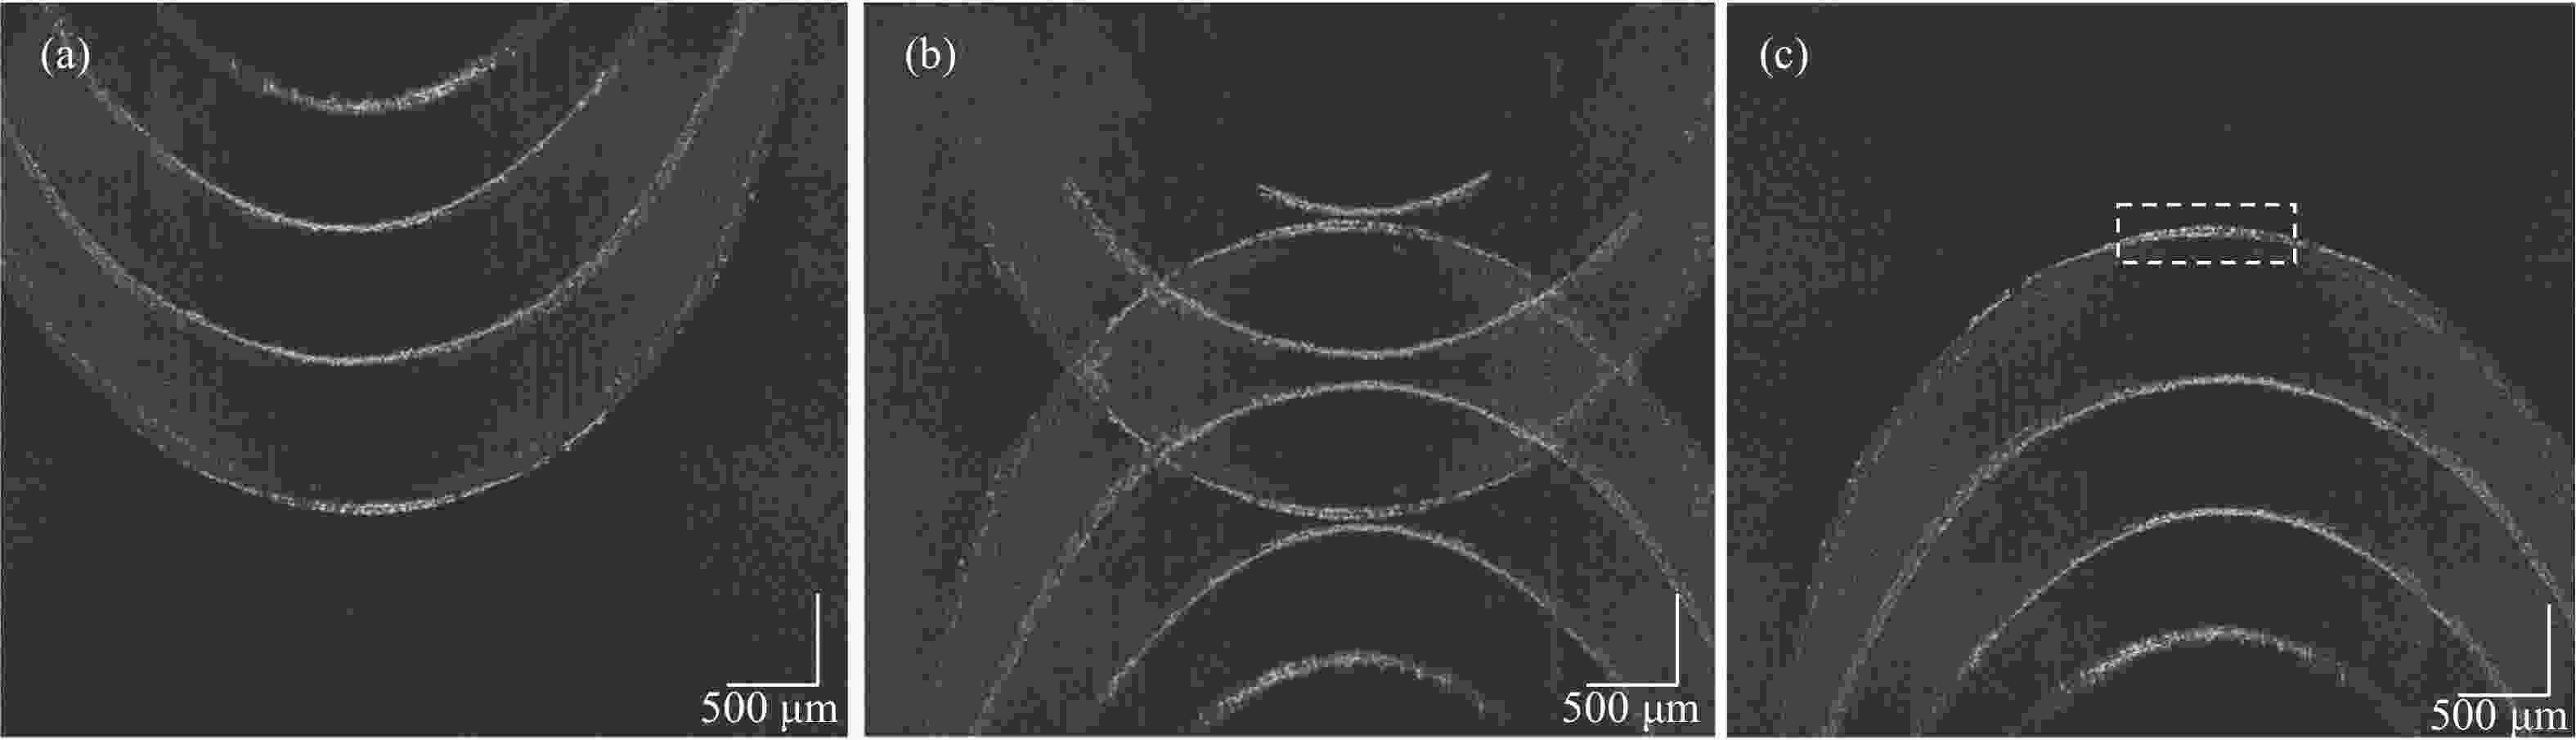
      Figure 5.  Removing conjugate mirror at different offset distances. (a) −0.8 mm; (b) 0.4 mm; (c) 0.8 mm

      图5(c)为去除复共轭镜像后的图像,可以正确地重建微观结构,不受复共轭镜像的影响。但是此时光束聚焦在样品深处时,样品表面由于受透镜DOF限制,仍然存在一定的伪影噪声,导致图像模糊。

      去复共轭算法去除镜像仍存在一定的缺陷。去复共轭镜像扩展成像深度后,成像范围扩大一倍,达到3.94 mm。计算得扫描透镜的DOF仅为0.40 mm,远远小于成像深度。因为透镜焦深与横向分辨率互相限制,所以当非相干光源焦点聚焦在样品深处时,在DOF以外的成像区域(如样品表面虚线区域)的横向分辨率会下降而导致图像模糊[15]。因此,拟采用调节光束聚焦在样品不同深度来提高图像横向分辨率。

    • 基于去复共轭技术扩展了OCT的成像范围,但图像质量也直接受光束焦点位置与DOF的影响。当光束焦点聚焦在样品某一深度时,焦平面附近的样品结构会由于该区域的激光功率密度较高,散射更多的光,从而产生更高的信号强度。当光束焦点聚焦在样品深处时,样品深处的结构会变得更加清晰可见,但受透镜DOF限制,其表层的图像分辨率会有所降低。

      想要获得较高的成像深度与成像质量,要去除复共轭镜像的影响,扩大成像深度,再采集光束聚焦在样品不同深度的OCT信号,基于高斯光源对于样品不同深度的焦平面进行高斯加权叠加,最终才能够在扩展成像深度的基础上保持最佳的横向分辨率[16]

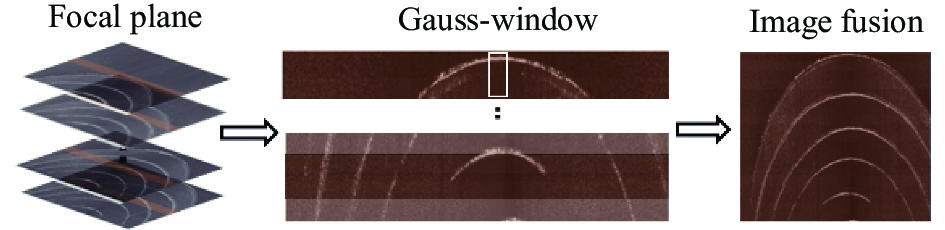
      不同深度聚焦平面的高斯叠加过程如图6所示。采集光束聚焦在样品不同深度的干涉信号,首先提取各个聚焦平面DOF范围内的光谱数据,再对其中的每一列光谱数据进行高斯加权求值。然后以图2所示的方式进行高斯加权叠加,最终生成融合图像。文中采用轴向移动样品台来精确控制光束聚焦深度,光源的波长及光束聚焦位置的光斑大小一直保持不变,所以不会对图像横向与轴向分辨率产生影响。

      Figure 6.  Schemaic of image weighted superposition

      采用的物镜DOF为0.40 mm,实验记录了光束焦点从样品表面逐渐深入的图像,每隔0.20 mm采集一次图像。图7(a)~(c)分别为当光束焦点聚焦在0、0.8、1.6 mm处所得的信号图像,均已去除复共轭镜像。图中黄色部分为光束DOF范围。当光束聚焦在样品表面时,样品表面清晰可见,但是未利用全范围成像空间,成像深度较浅。而当光束焦点聚焦在样品深处时,样品深处的结构会变得清晰,但受DOF限制,其表层的图像分辨率会有所降低,随着光束焦点的深入,图像表层结构的清晰度下降越明显。

      Figure 7.  OCT scanning images of removing complex conjugate images by focusing the beam at different depths of the sample . (a) 0 mm; (b) 0.8 mm; (c) 1.6 mm; (d) Weighted superposition of beam focusing at different depth focal planes

      对不同深度的聚焦平面进行高斯加权叠加,最终结果如图7(d)所示,等效于扩大了DOF范围,样品在整个深度上的横向分辨率不受影响。

      在原始SD-OCT系统中,扫描方式所得的干涉信号如图4(a)所示。此时,零相位延迟设置在样品外部,此时无需考虑复共轭镜像的影响,但是仅利用了一半成像范围空间。图7(d)是将零相位延迟设置在样品内部,去除复共轭镜像,移动光束焦点聚焦样品不同深度后进行加权叠加的最终结果。从图像中可以看出,通过去复共轭镜像与不同焦平面聚焦深度的聚焦面叠加,不仅成功在去复共轭的基础扩展了一倍的成像范围,也确保了不会因为光束焦点位置与DOF的影响而降低了图像的清晰度。

      实验结果表明,对于透明度较高的样品,此时穿透深度大于成像范围,有效成像深度由成像范围决定,去复共轭镜像与光束聚焦深度的叠加可以将成像范围(即有效成像深度)扩大一倍,并且样品二维层析图像分辨率不受影响,样品深层次结构信息清晰可见。

    • 文中也通过生物组织的离体成像验证了该方法的有效性。生物组织透明度较低,光束衰减大,此时穿透深度小于成像范围。生物组织的有效成像深度由穿透深度决定。SD-OCT系统中穿透深度一般定义为灵敏度下降6 dB处的位置。

      文中去复共轭镜像能够使成像范围翻倍,虽然成像范围翻倍并不能扩展生物组织的有效成像深度,但是去复共轭镜像能够将零相位延迟(即光束聚焦中心)设置在样品内部,能够提高生物组织深层次的激光功率。这能直接提高穿透深度,对于生物组织而言,穿透深度即为有效成像深度。

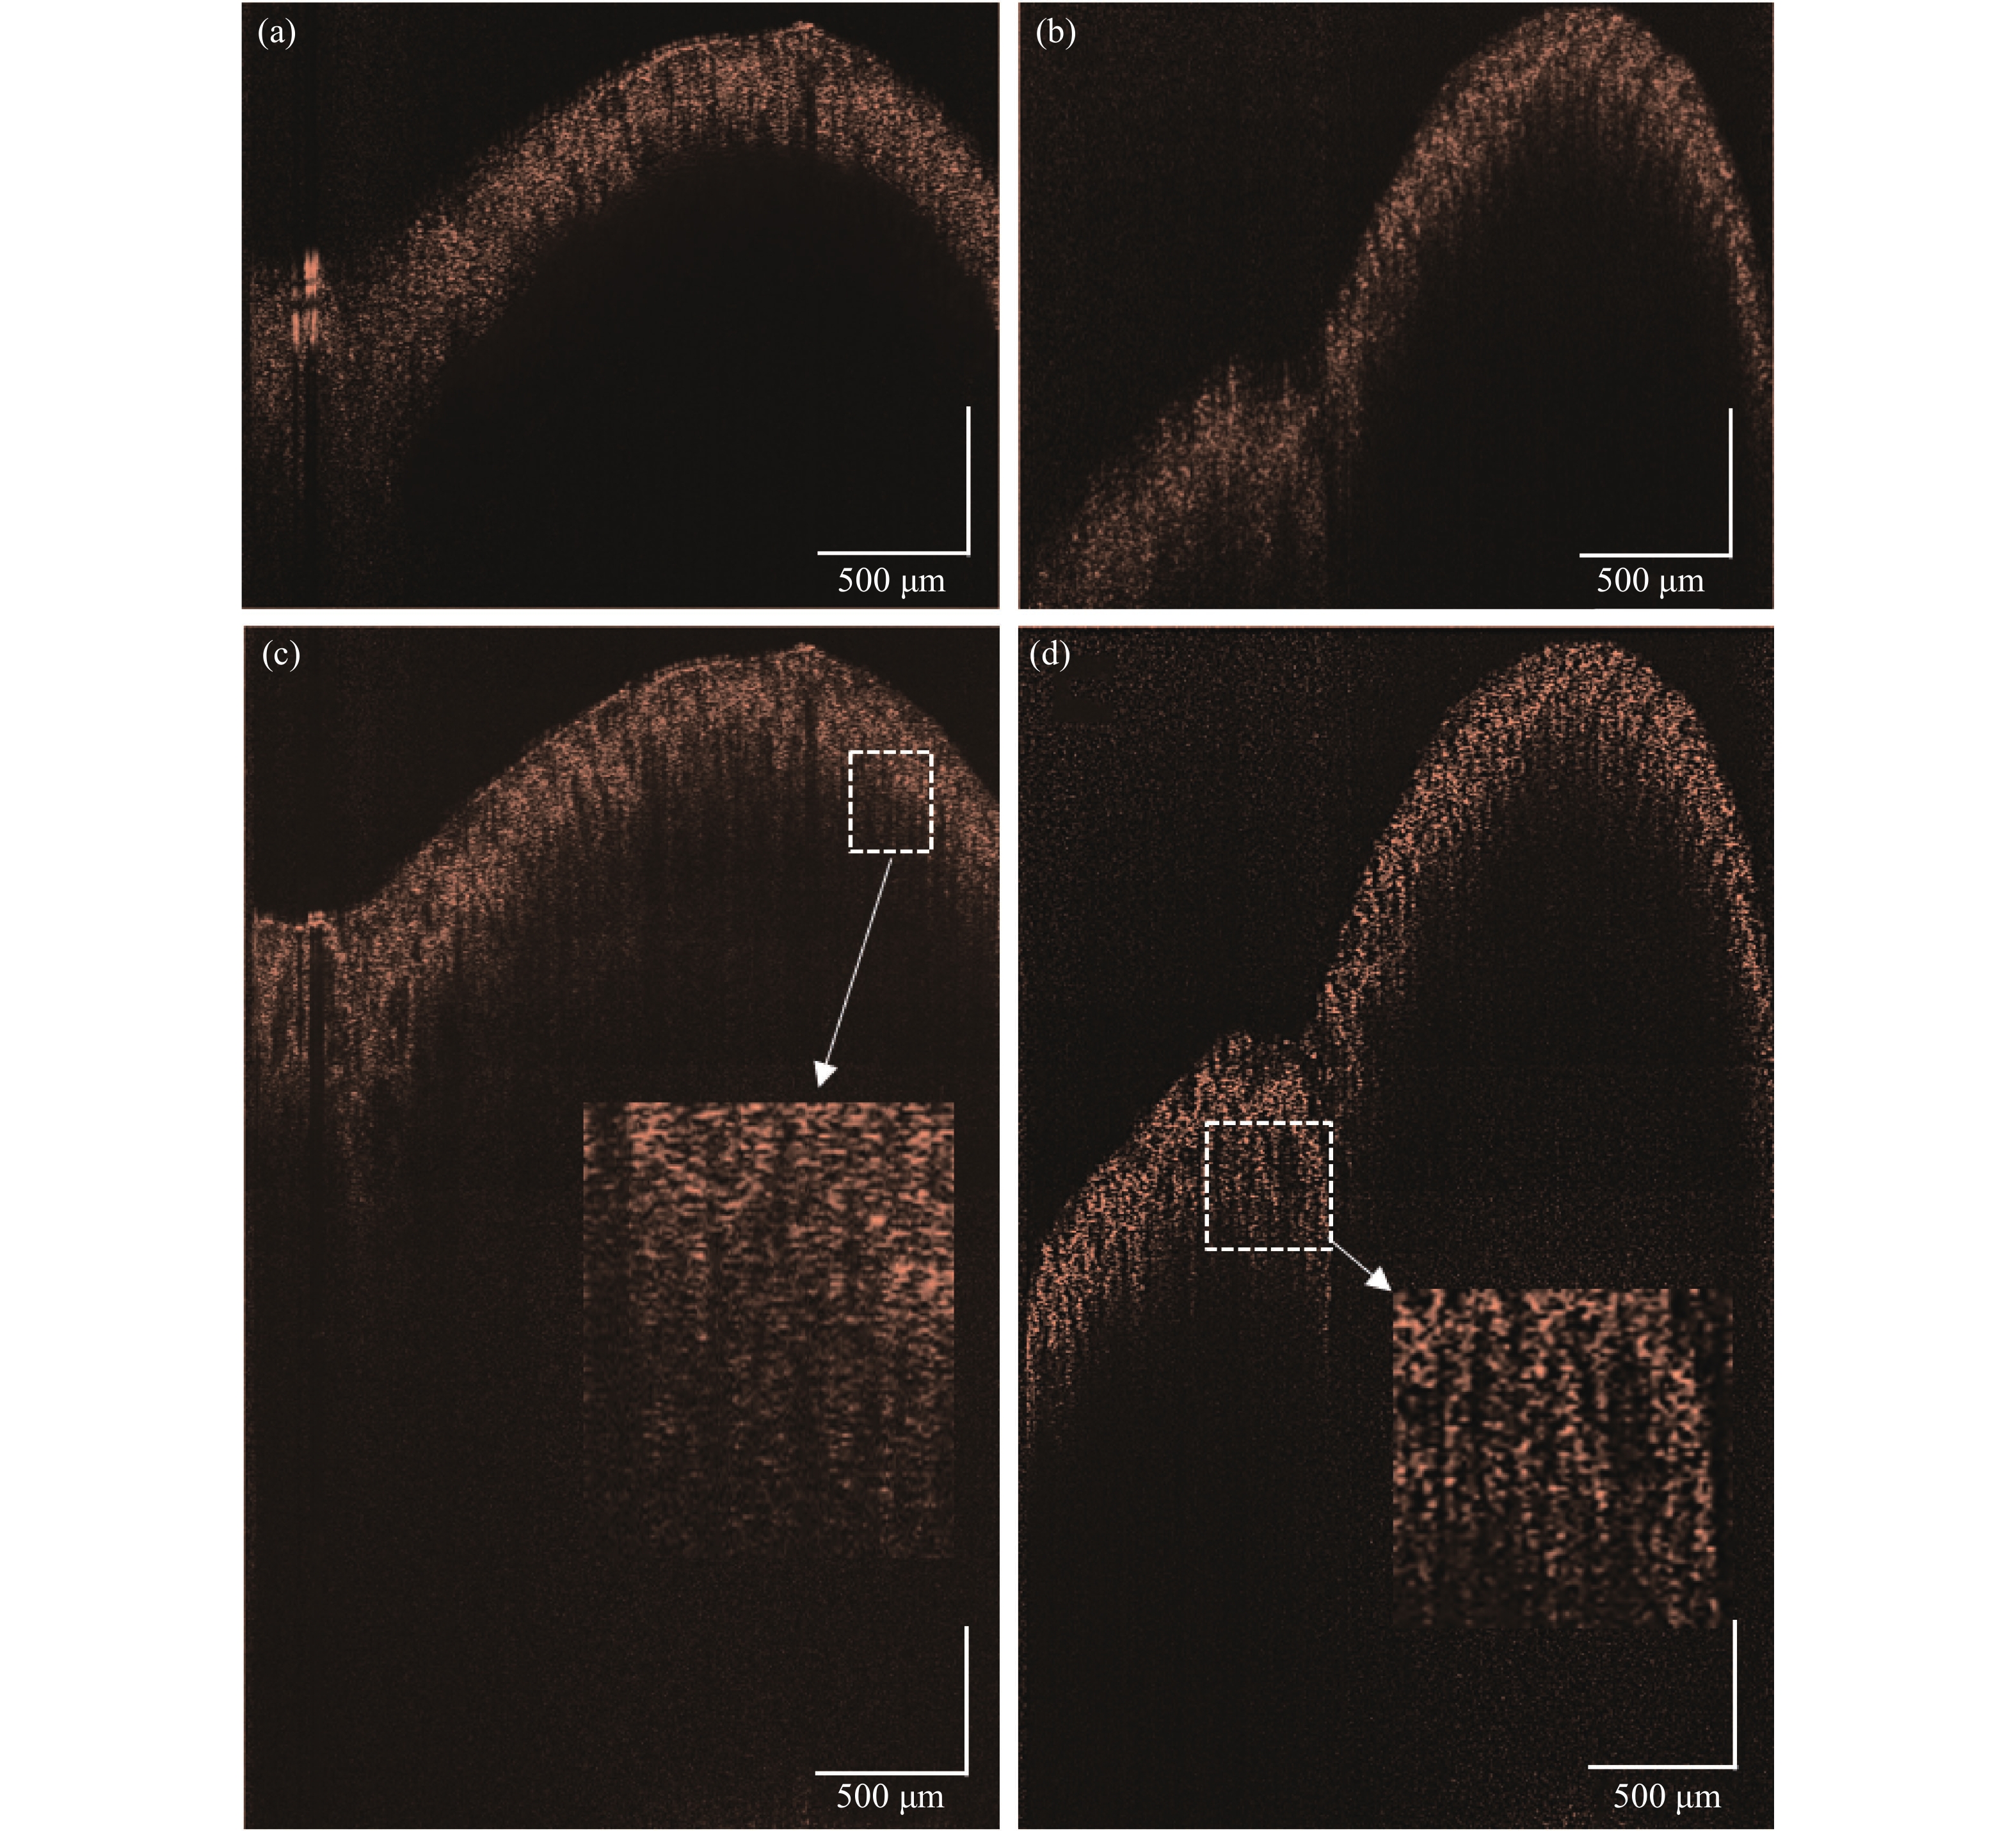
      图8来自人体的正常结肠壁组织样本,由于生物组织散射吸收性质,穿透深度受限,即使光束聚焦在组织深处也只能扩展一定的成像深度。由于生物组织与透明片样本固有空间频率不同,此时光束偏移的距离设置为0.6 mm,添加的载频为2.8 kHz。

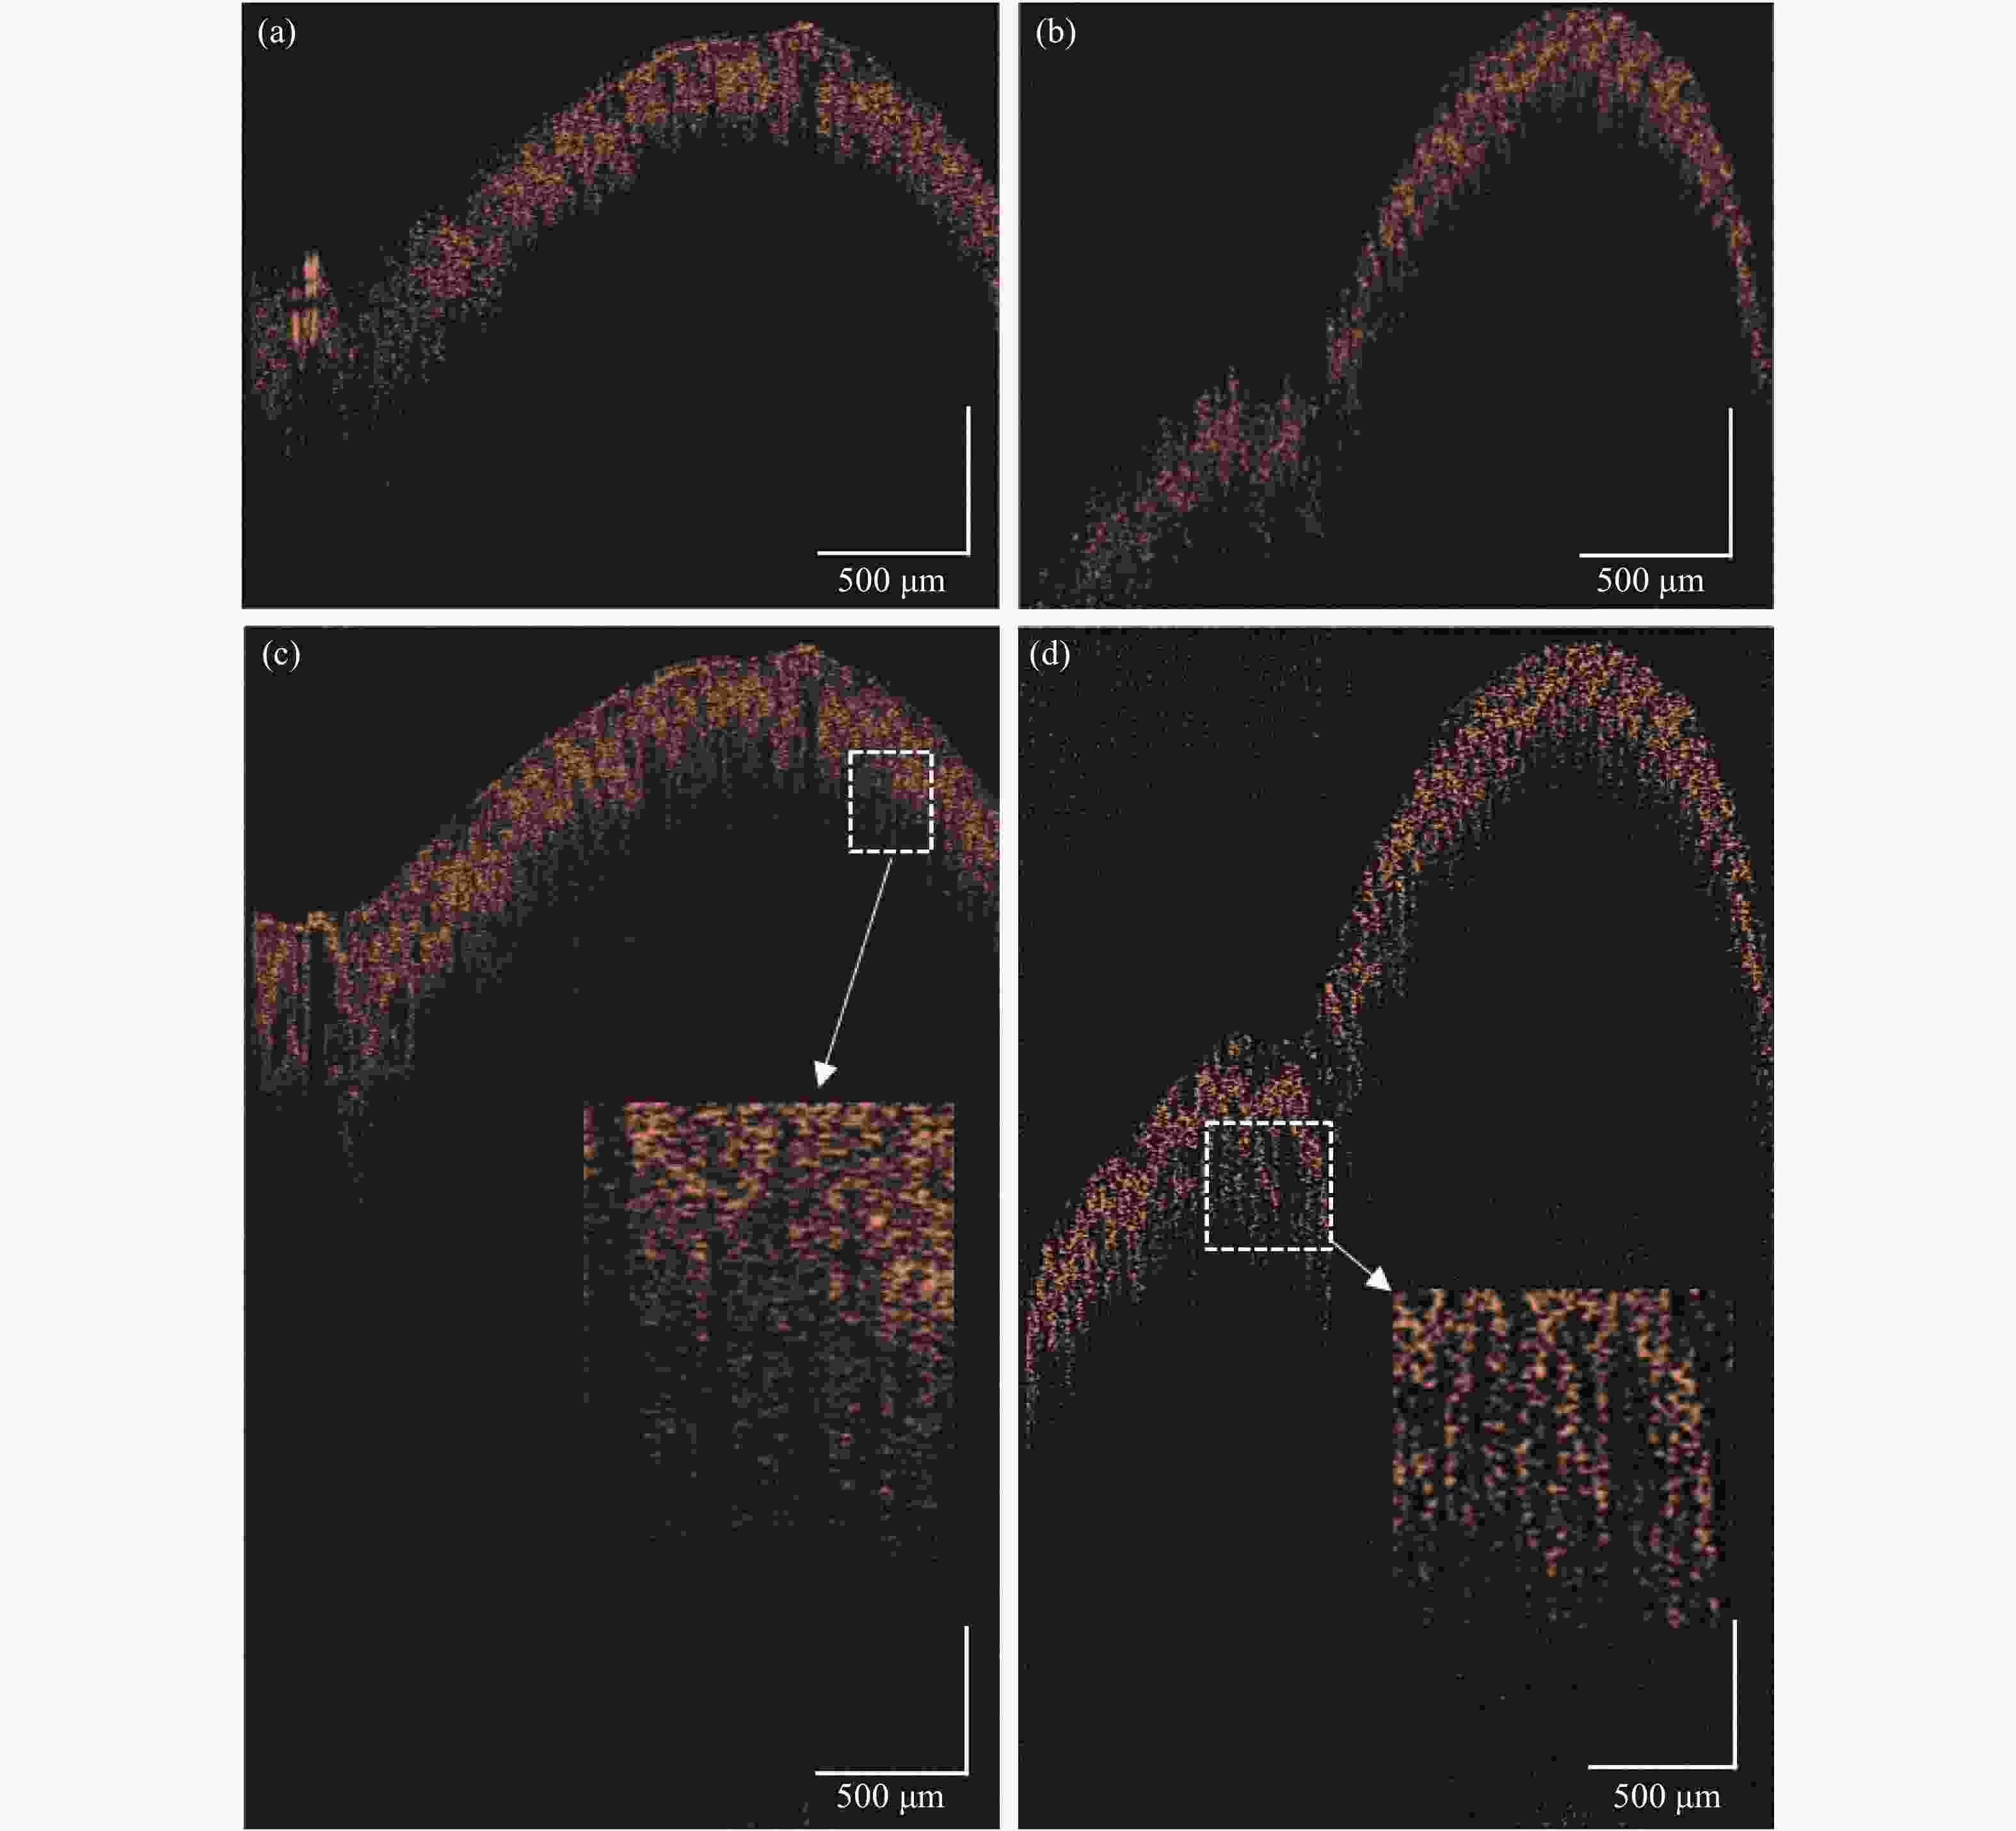
      Figure 8.  (a)-(b) Original images of colon tissue at different positions; (c)-(d) Colon tissue image after extended depth

      图8(a)~(b)显示正常OCT扫描所采集不同结肠位置的图像信号,图8(a)、(b)分别代表了组织表面平缓与起伏较大的两种情况。受扫描透镜DOF范围限制,当光束聚焦样品表面时,样品深处区域存在图像模糊问题。除此之外,对于表面起伏过大的样本,如图8(b)左侧底部所示,也会存在部分区域成像范围不够的问题。文中去除复共轭镜像后,提取光束在不同深度的聚焦平面并加权叠加,最终扩展深度的图像如图8(c)~(d)所示,与原始OCT探测所得的图8(a)~(b)比较,此时生物组织有效成像深度受穿透深度限制,成像范围空间扩大一倍并不能使有效成像深度扩大一倍。但是由于样品深处激光功率提高,光束衰减小,能扩展一部分穿透深度。

      图9图8(a)~(c)图像框选区域的某一位置对应的轴向强度分布图。根据穿透深度定义,灵敏度下降6 dB时,光束强度衰减至原先的四分之一。正常OCT系统结肠组织扫描平均穿透深度为0.51 mm,经过去复共轭系统深度扩展后的平均穿透深度达到0.65 mm。穿透深度提升了27.5%。该系统不仅将有效成像深度扩展了0.14 mm,而且解决了生物组织深处结构受DOF限制而导致的横向分辨率下降的问题。深度扩展后的图像在垂直方向上有连接良好的组织信号,结肠组织粘膜面隐窝腔的锯齿状结构也清晰可见。有研究表明,结肠壁的隐窝腔和杯状细胞,在OCT图像中体现为锯齿状结构,是早期发现结肠癌癌前病变的关键指标[17]

      Figure 9.  One-dimensional depth spectral data of colon tissue

      SD-OCT系统的有效成像深度受成像范围和穿透深度共同限制。成像范围受光谱仪参数影响,而穿透深度受光源以及样品散射吸收性质的影响。

      对于透明性较好的样品,光束衰减小,有效成像深度等于成像范围。如图7(d)结果展示,该系统实现成像范围扩大一倍,有效成像深度从1.97 mm扩展为3.94 mm。OCT技术可用于透明复合材料内部微观结构信息的探测与成像[18],成像深度的扩展能够直接探测更大范围材料内部的缺陷以及异常变形情况。

      生物组织成分复杂,受吸收与散射影响,光束衰减快,穿透深度小于成像范围,有效成像深度等于穿透深度。如图8(c)结果所示,系统将光束聚焦于样品不同深度,实现有效成像深度扩展了0.14 mm,并且突破了透镜焦深的限制,结肠组织深层次微观结构仍具有微米级分辨率。正常结肠壁的锯齿状结构模式能够用于定量评估结肠癌变情况[19],提高结肠组织的成像深度以及结肠内部微观结构的分辨率有助于提高结肠癌的识别结果。

      对于普通样品与生物组织,可以看出去除复共轭镜像与调节光束焦点扩展焦深相结合的方法能有效地扩展成像范围,提升系统有效成像深度,并且突破了透镜DOF 与横向分辨率的互相制约,不会受DOF限制导致图像模糊。

    • 文中提出了一种基于载频法去除共轭镜像与光束聚焦于样品不同深度相结合用以扩展OCT成像深度与质量的方法。在SD-OCT扫描中为避免复共轭镜像影响,仅利用一半的成像范围空间,文中通过光束偏移振镜中心添加载频去除共轭镜像,实现成像范围空间扩大一倍。再通过不同深度聚焦体的叠加,提高穿透深度,并解决扩展深度后图像分辨率与光束聚焦深度互相限制的问题。最后实现了成像深度的扩展,突破了焦深限制,并且能够应用于生物组织检测。通过对比扩展深度前后多层透明片与生物组织的SD-OCT图像,证明了该方法的有效性。对于透明片材料,有效成像深度扩大一倍,达到3.94 mm。对于结肠组织,有效成像深度从0.51 mm提高到0.65 mm,提升了27.5%,而且扩展深度的同时也能清晰地展现样品深层次结构信息。

Reference (19)

Catalog

    /

    DownLoad:  Full-Size Img  PowerPoint
    Return
    Return